 3
3peptides
spectra
0.000 | 0.000
0.358 | 0.412
0.519 | 0.582
0.000 | 0.000
0.000 | 0.000
0.030 | 0.082
0.000 | 0.000
0.000 | 0.000
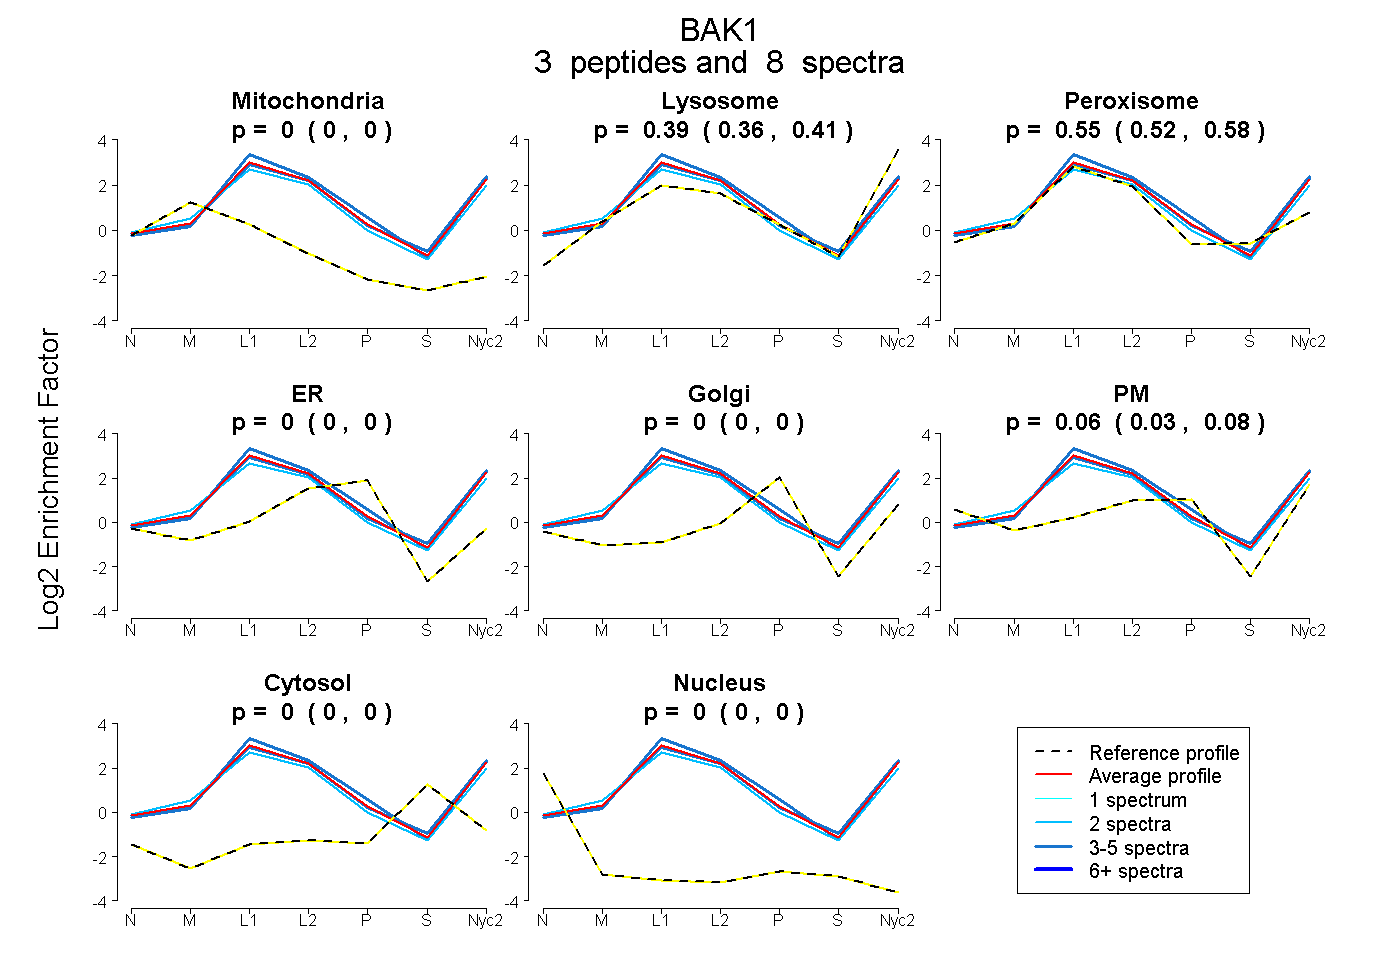
| Plot | Mito | Lyso | Perox | ER | Golgi | PM | Cytosol | Nucleus | |||||
| Expt A |
3 peptides |
8 spectra |
|
0.000 0.000 | 0.000 |
0.387 0.358 | 0.412 |
0.554 0.519 | 0.582 |
0.000 0.000 | 0.000 |
0.000 0.000 | 0.000 |
0.059 0.030 | 0.082 |
0.000 0.000 | 0.000 |
0.000 0.000 | 0.000 |
| 3 spectra, IASSLFK | 0.000 | 0.414 | 0.541 | 0.000 | 0.000 | 0.045 | 0.000 | 0.000 | ||
| 2 spectra, QLALIGDDINR | 0.000 | 0.289 | 0.582 | 0.000 | 0.000 | 0.129 | 0.000 | 0.000 | ||
| 3 spectra, GGWVAALSLR | 0.000 | 0.426 | 0.545 | 0.000 | 0.000 | 0.029 | 0.000 | 0.000 |
| Plot | Mito | Lyso or Perox | ER | Golgi | PM | Cytosol | Nucleus | ||||||
| Expt B |
1 peptide |
1 spectrum |
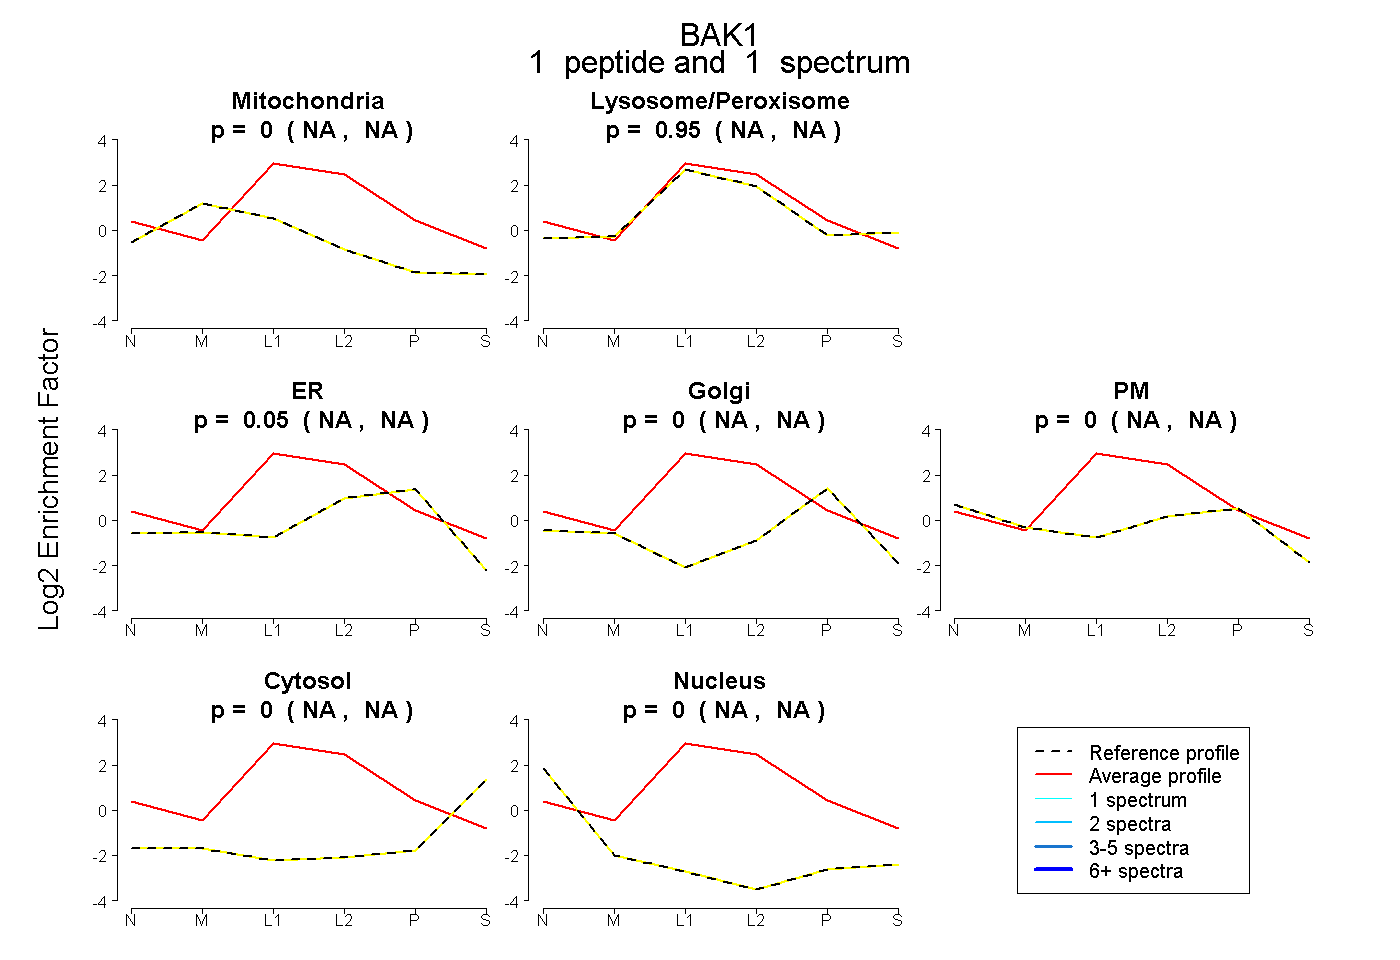 |
0.000 NA | NA |
0.950 NA | NA |
0.050 NA | NA |
0.000 NA | NA |
0.000 NA | NA |
0.000 NA | NA |
0.000 NA | NA |
|||
| Plot | Lyso | Other | |||||||||||
| Expt C |
6 peptides |
27 spectra |
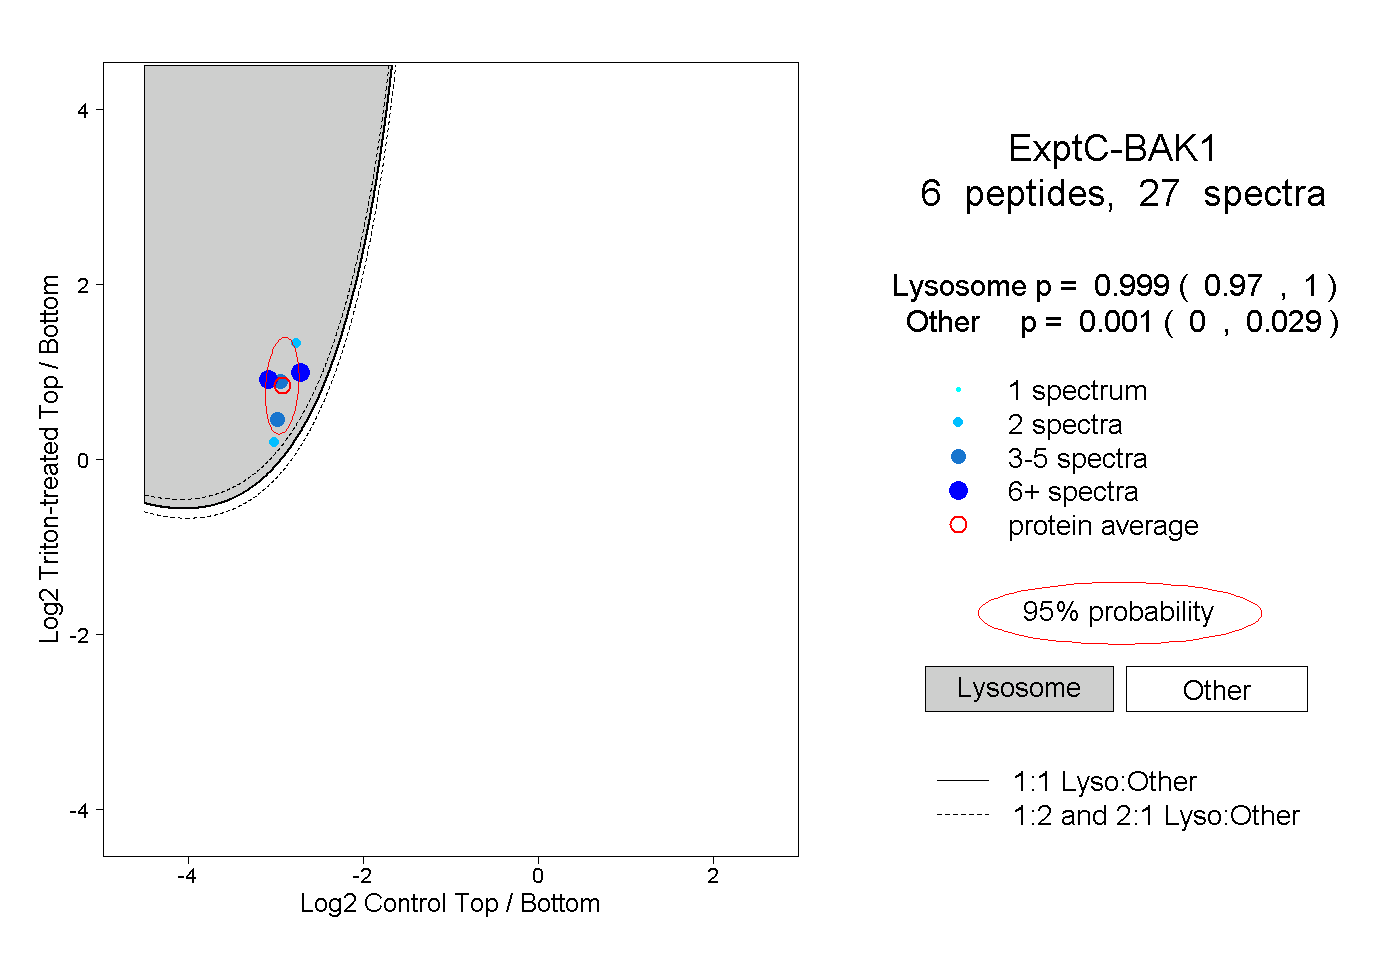 |
0.999 0.970 | 1.000 |
0.001 0.000 | 0.029 |
||||||||
| Plot | Lyso | Other | |||||||||||
| Expt D |
1 peptide |
2 spectra |
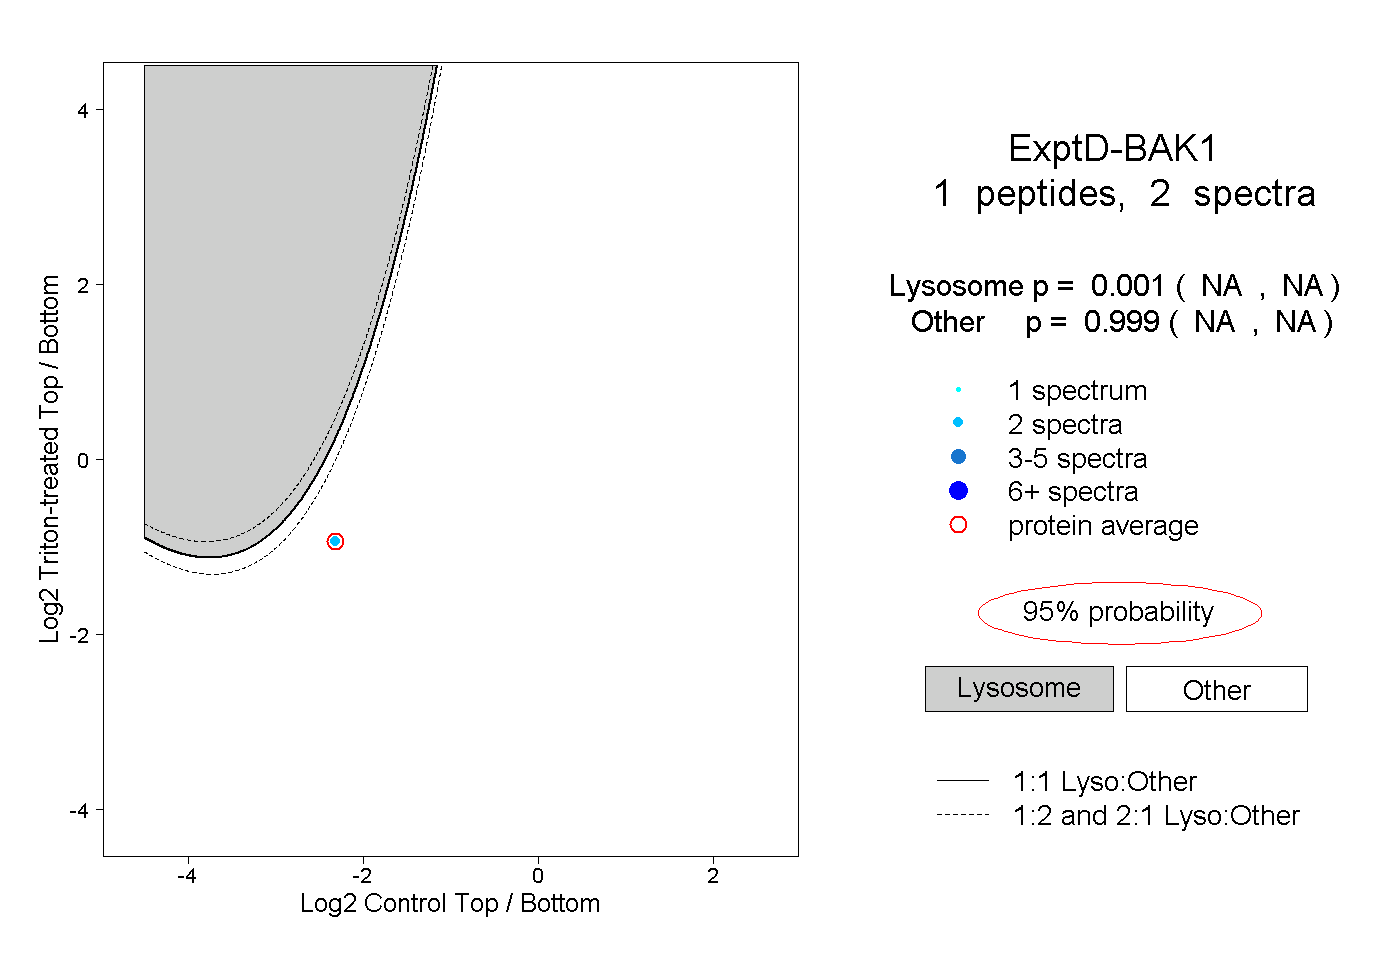 |
0.001 NA | NA |
0.999 NA | NA |