BAK1
[ENSRNOP00000000576]
Main page
| | | Plot |
Mito |
Lyso |
|
Perox |
ER |
Golgi |
PM |
Cytosol |
Nucleus |
|
| Expt A |
 3
3
peptides |
8
spectra |
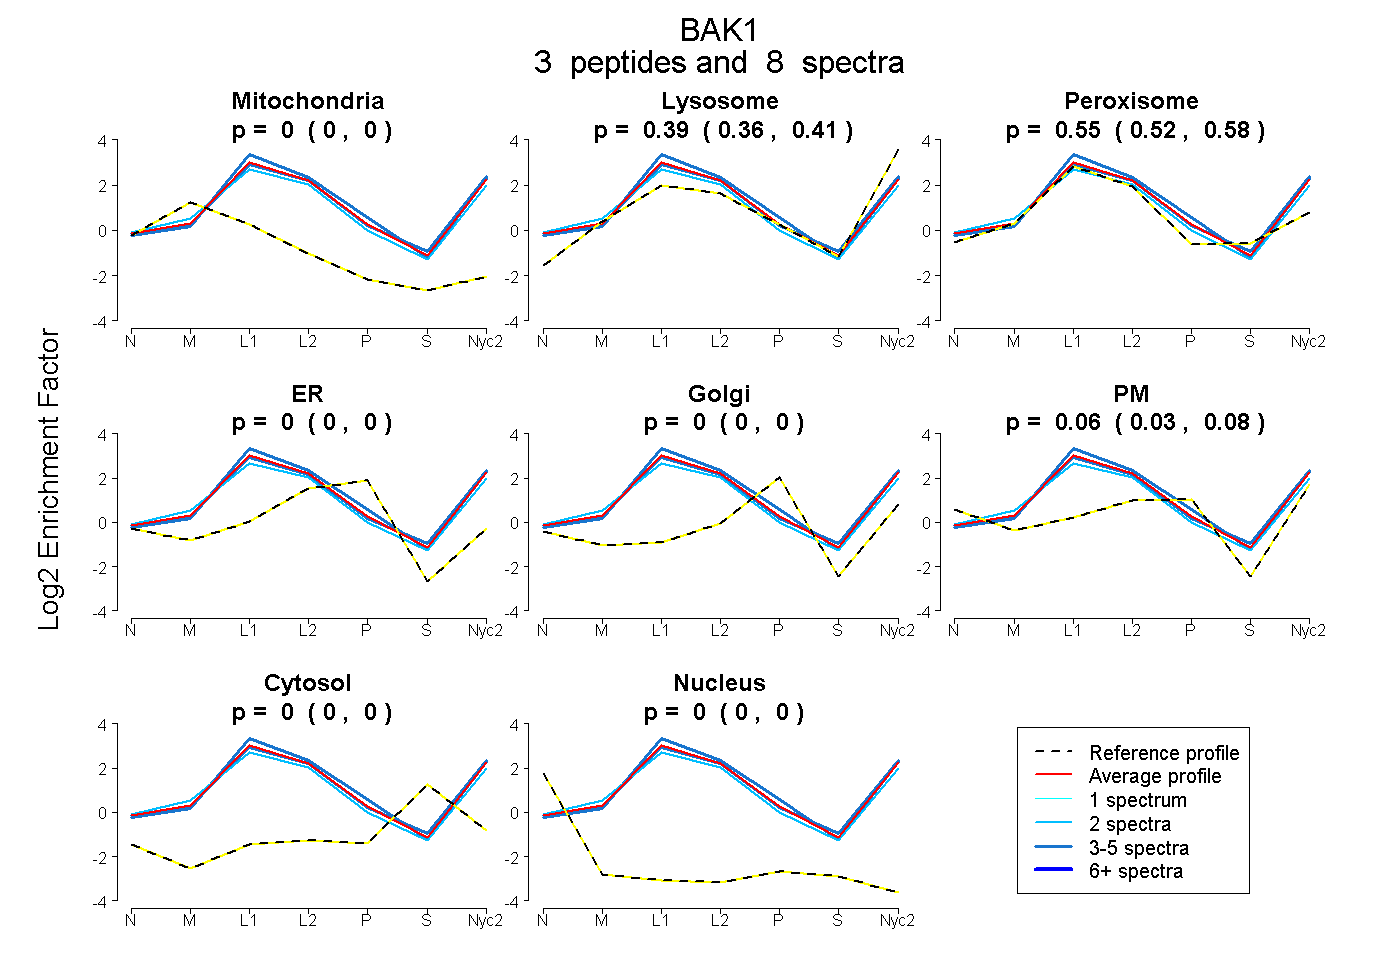 |
0.000
0.000 | 0.000 |
0.387
0.358 | 0.412 |
|
0.554
0.519 | 0.582 |
0.000
0.000 | 0.000 |
0.000
0.000 | 0.000 |
0.059
0.030 | 0.082 |
0.000
0.000 | 0.000 |
0.000
0.000 | 0.000 |
|
| | | Plot |
Mito |
|
Lyso or Perox |
|
ER |
Golgi |
PM |
Cytosol |
Nucleus |
|
| Expt B |
1
peptide |
1
spectrum |
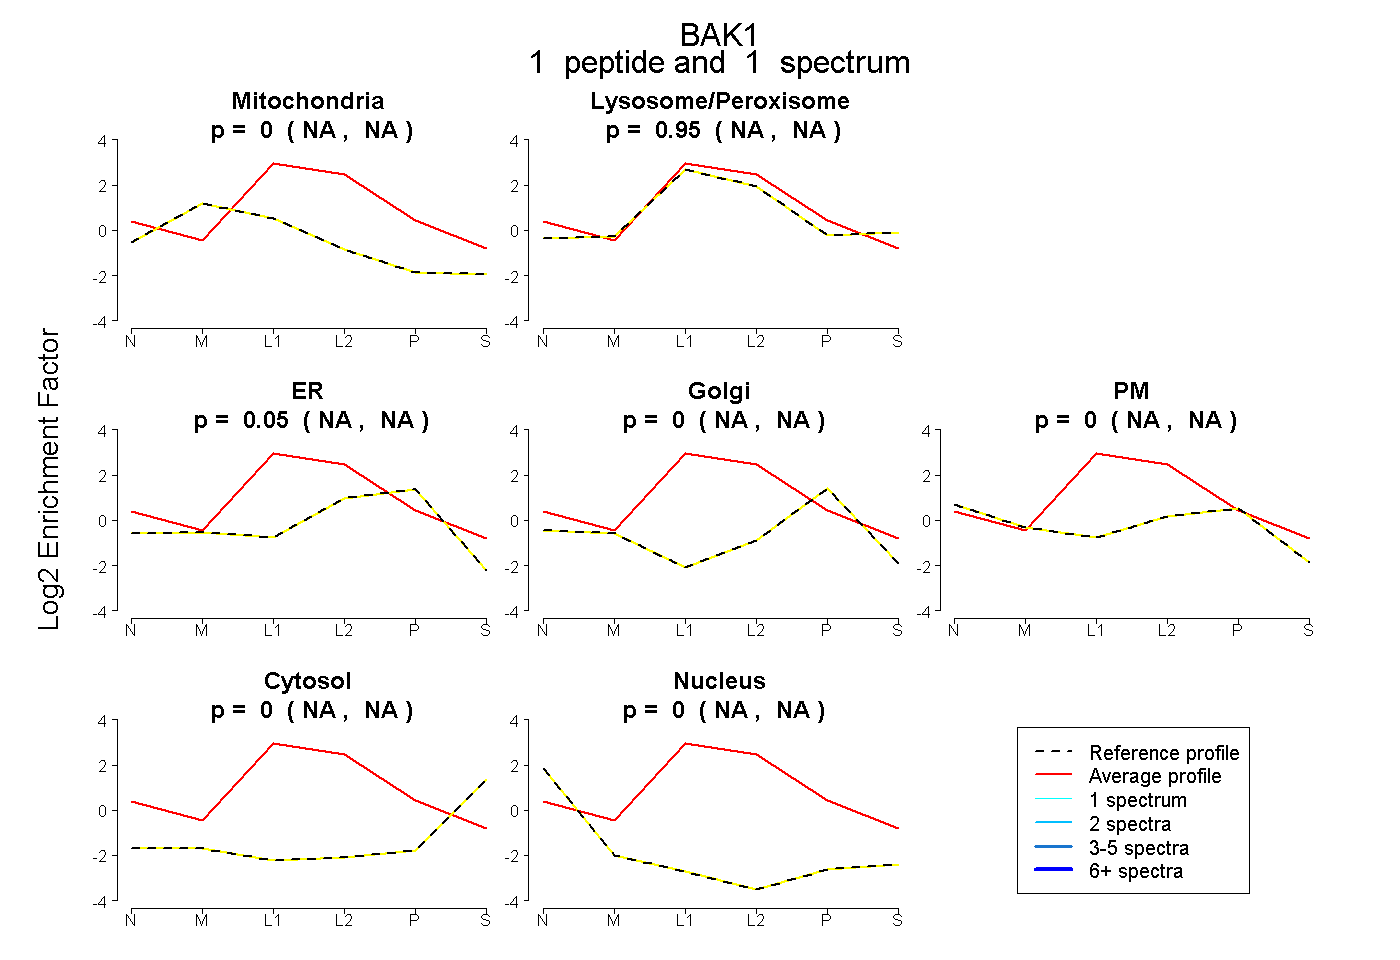 |
0.000
NA | NA |
|
0.950
NA | NA |
|
0.050
NA | NA |
0.000
NA | NA |
0.000
NA | NA |
0.000
NA | NA |
0.000
NA | NA |
|
| | | Plot |
|
Lyso |
|
|
|
|
|
|
|
Other |
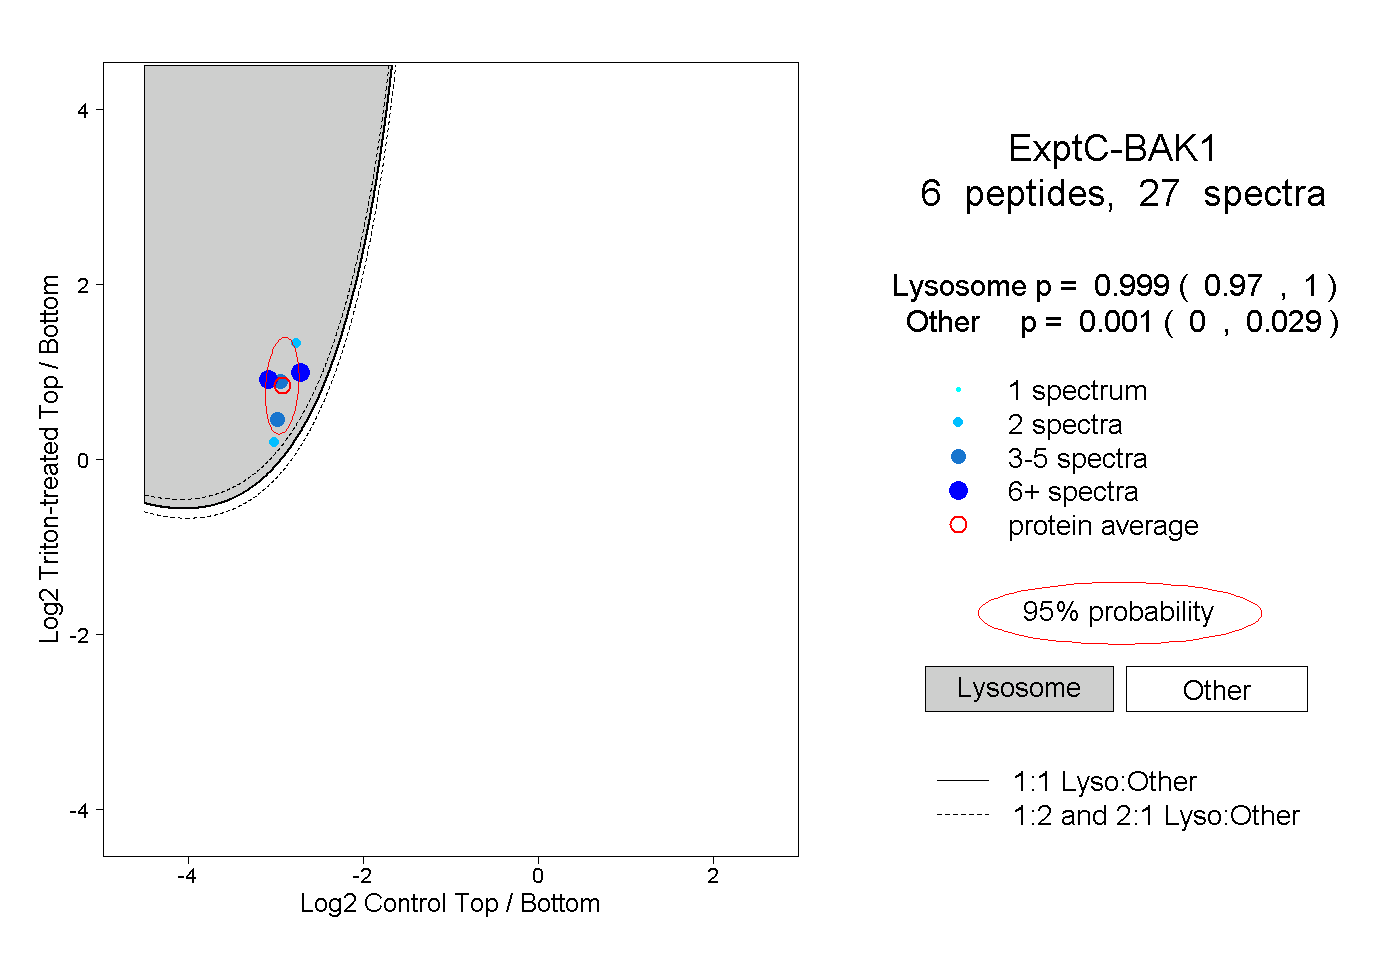
| Expt C |
6
peptides |
27
spectra |
 |
|
0.999
0.970 | 1.000 |
|
|
|
|
|
|
|
0.001
0.000 | 0.029 |
| 2 spectra, VVALLGFGYR |
|
1.000 |
|
|
|
|
|
|
|
0.000 |
| 4 spectra, SGISWGR |
|
0.991 |
|
|
|
|
|
|
|
0.009 |
| 7 spectra, IASSLFK |
|
0.997 |
|
|
|
|
|
|
|
0.003 |
| 8 spectra, QLALIGDDINR |
|
1.000 |
|
|
|
|
|
|
|
0.000 |
| 2 spectra, LALYVYQR |
|
0.936 |
|
|
|
|
|
|
|
0.064 |
| 4 spectra, GGWVAALSLR |
|
1.000 |
|
|
|
|
|
|
|
0.000 |
| | | Plot |
|
Lyso |
|
|
|
|
|
|
|
Other |
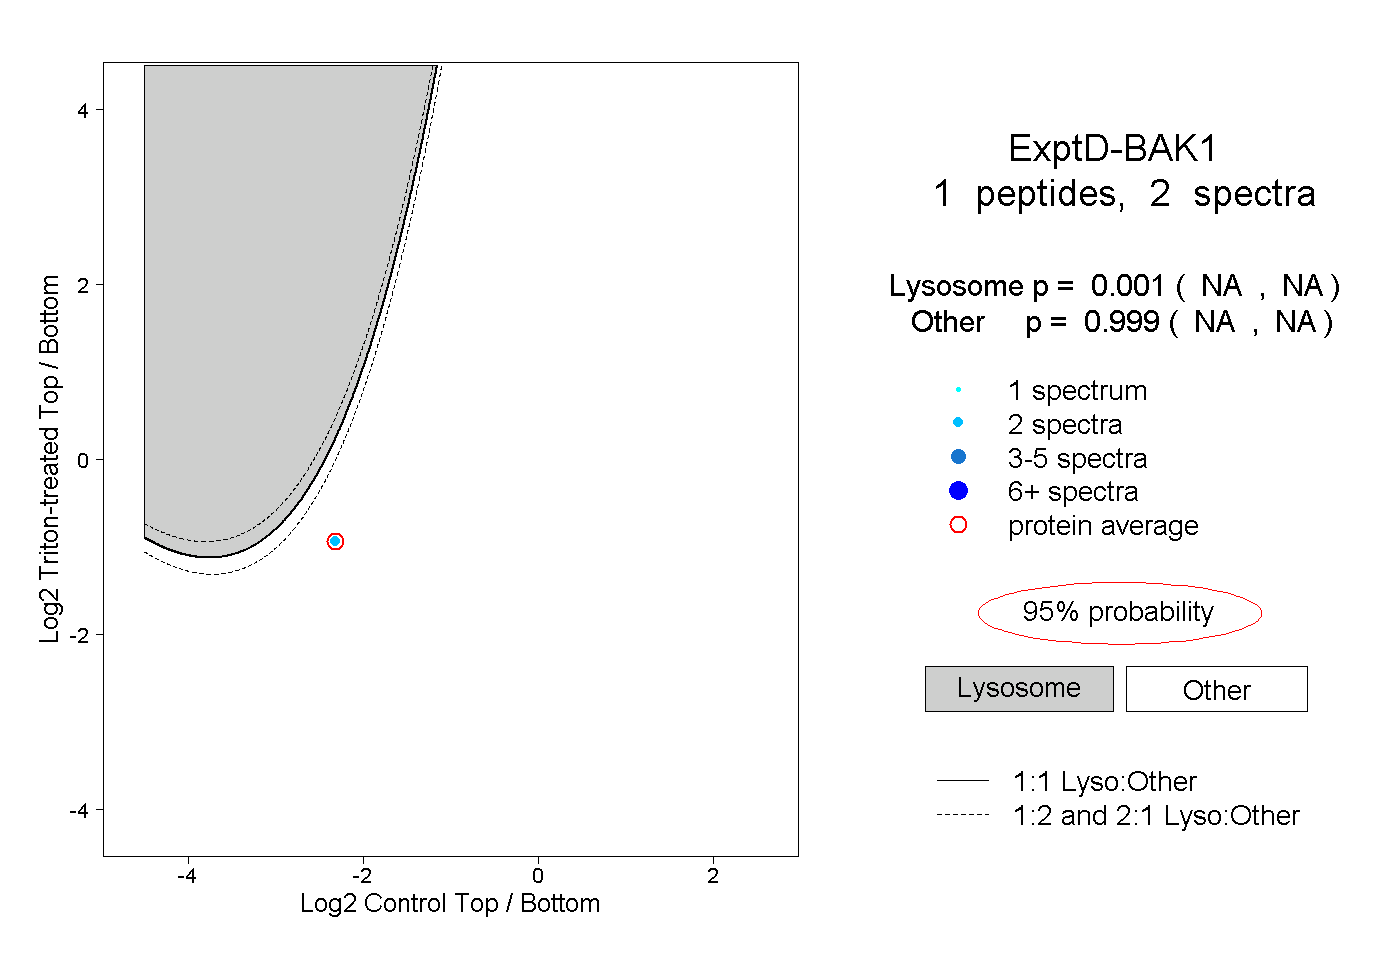
| Expt D |
1
peptide |
2
spectra |
 |
|
0.001
NA | NA |
|
|
|
|
|
|
|
0.999
NA | NA |