 10
10peptides
spectra
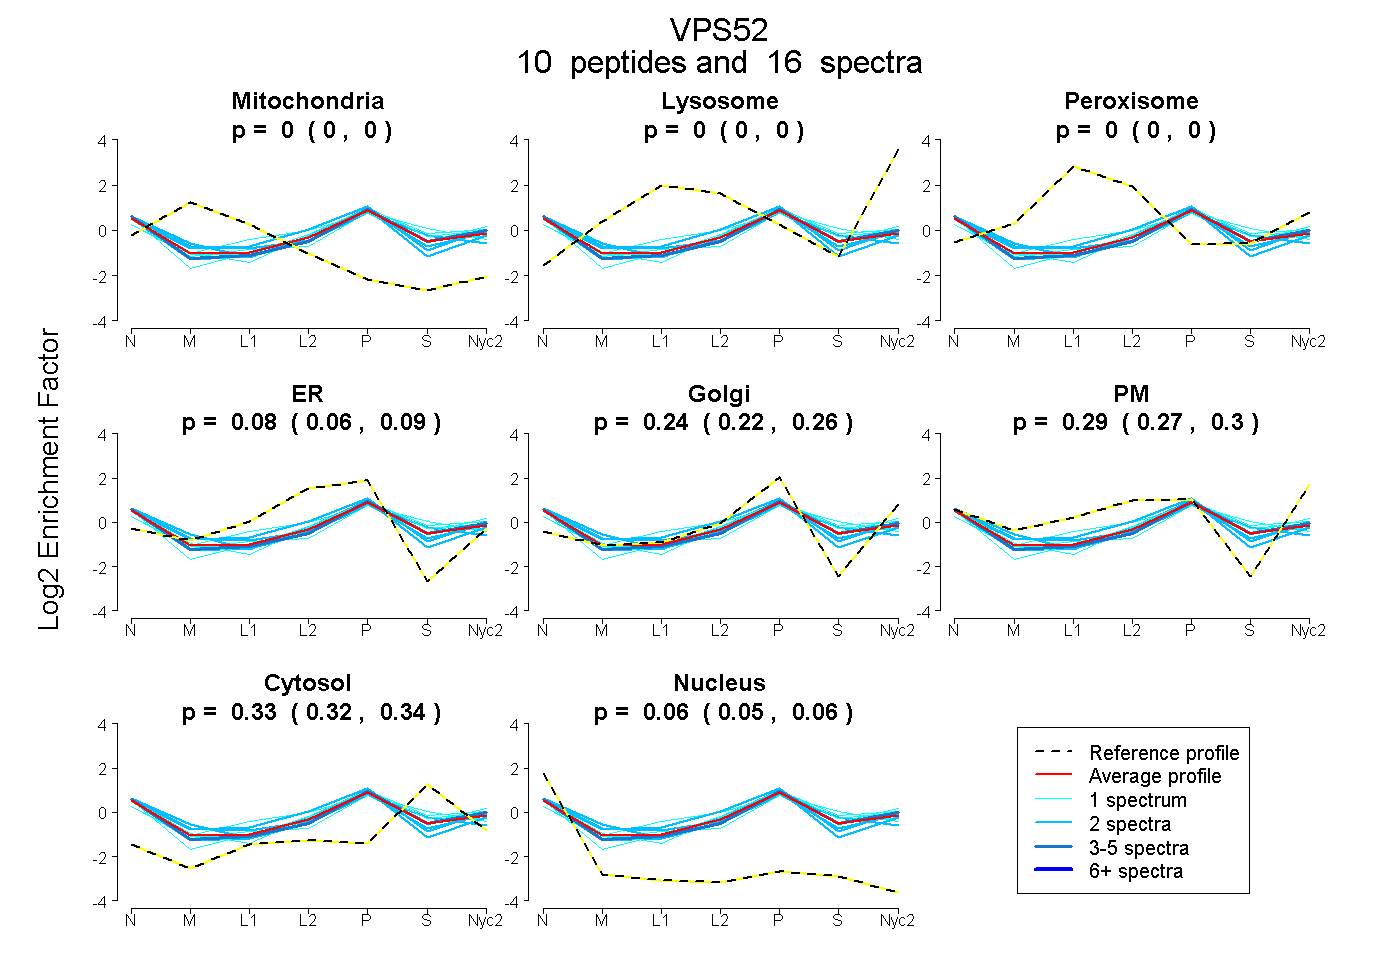
0.000 | 0.000
0.000 | 0.000
0.000 | 0.000
0.059 | 0.093
0.224 | 0.259
0.270 | 0.296
0.324 | 0.343
0.054 | 0.065
3peptides
spectra
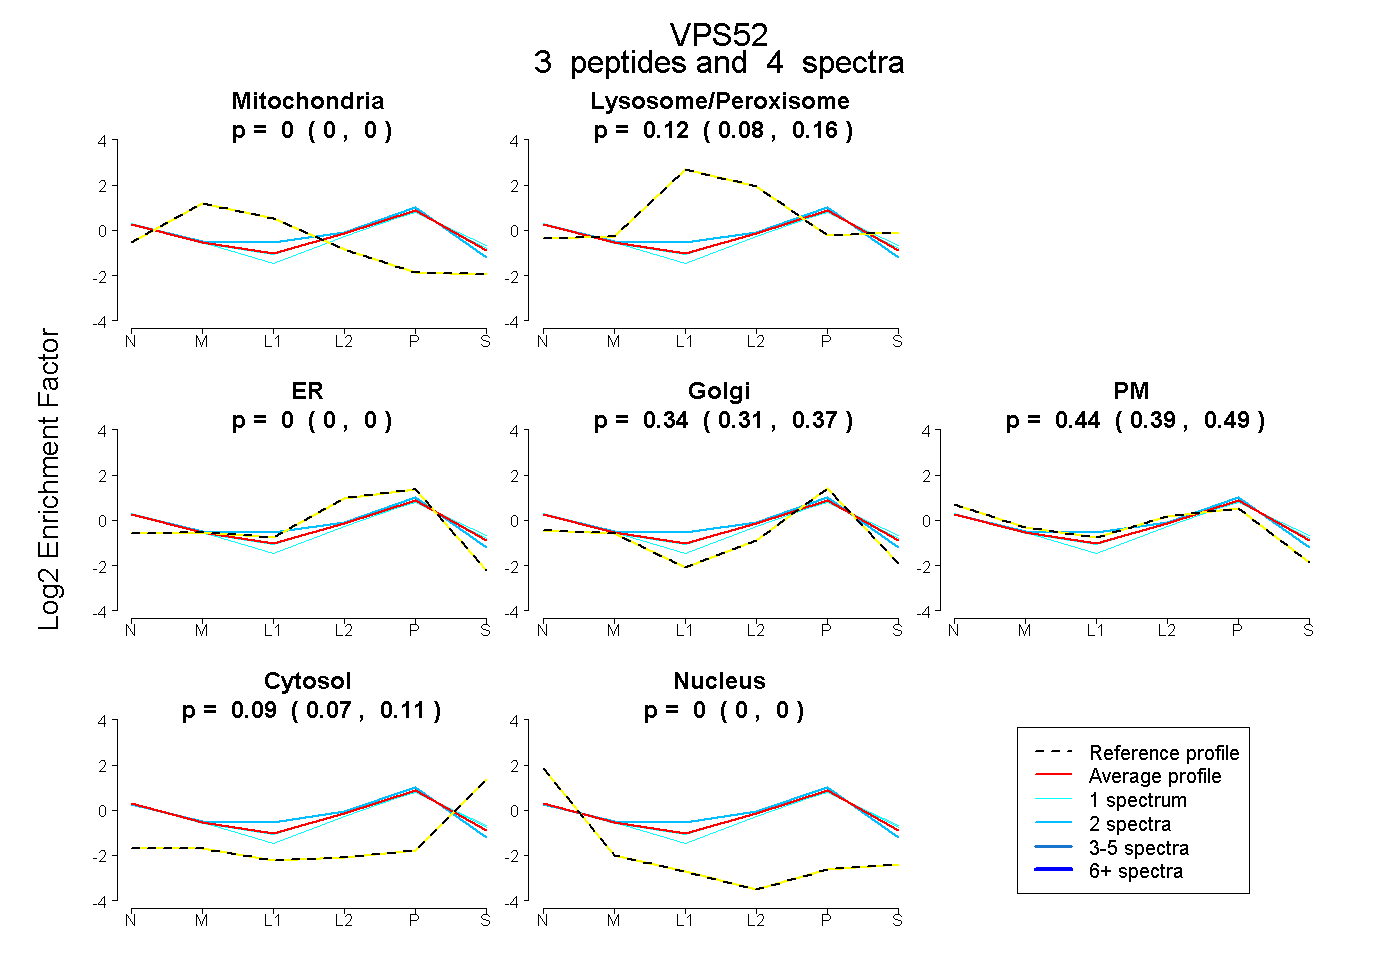
0.000 | 0.000
0.075 | 0.163
0.000 | 0.000
0.309 | 0.367
0.393 | 0.488
0.068 | 0.114
0.000 | 0.000
5peptides
spectra
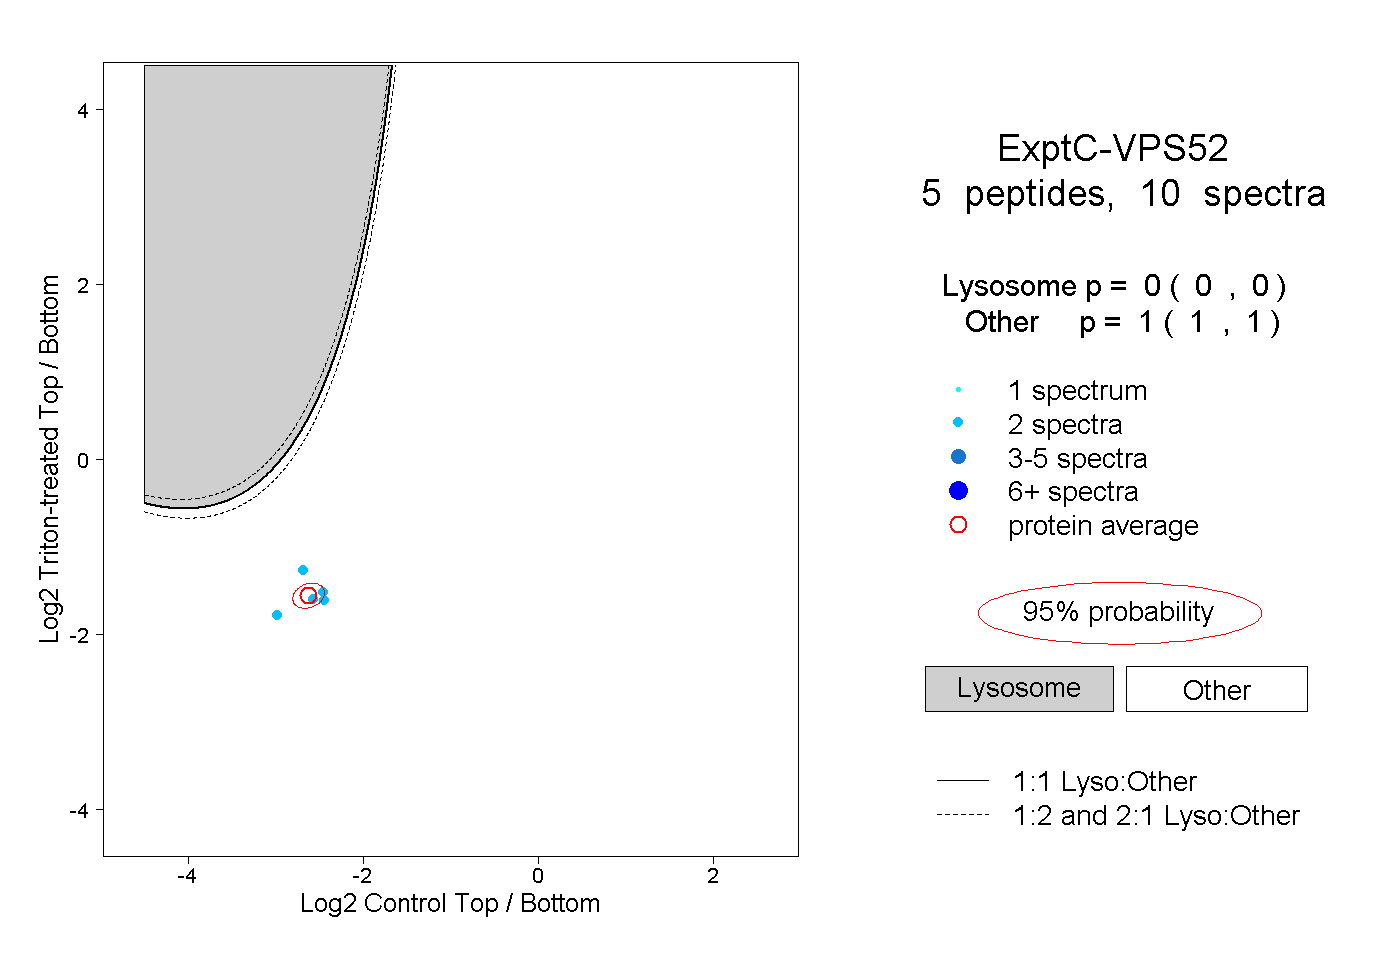
0.000 | 0.000
1.000 | 1.000
3peptides
spectra
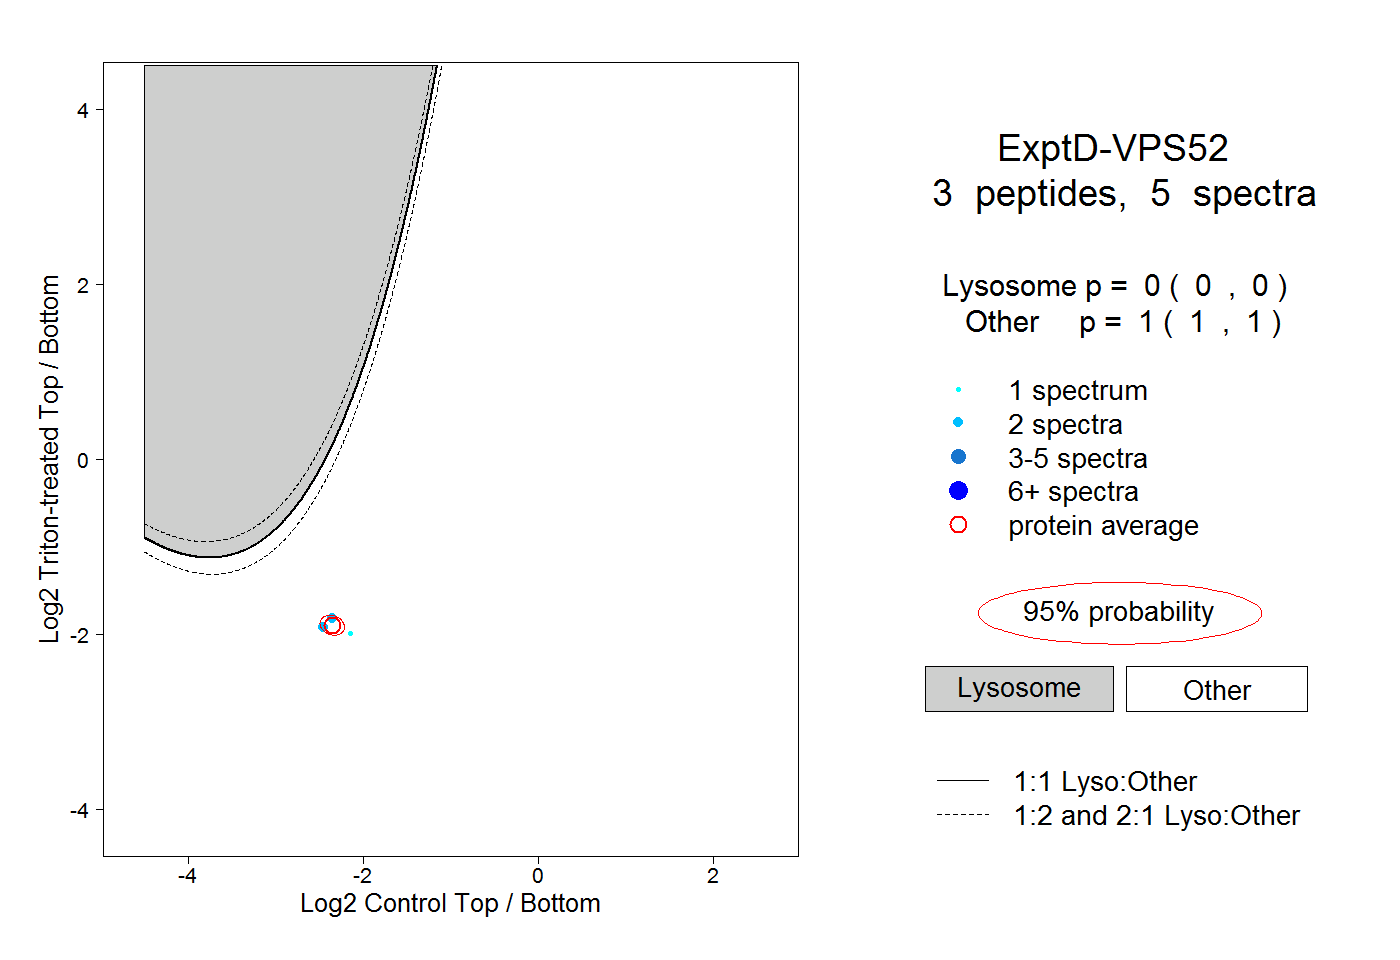
0.000 | 0.000
1.000 | 1.000