 10
10peptides
spectra
0.000 | 0.000
0.000 | 0.000
0.000 | 0.000
0.059 | 0.093
0.224 | 0.259
0.270 | 0.296
0.324 | 0.343
0.054 | 0.065
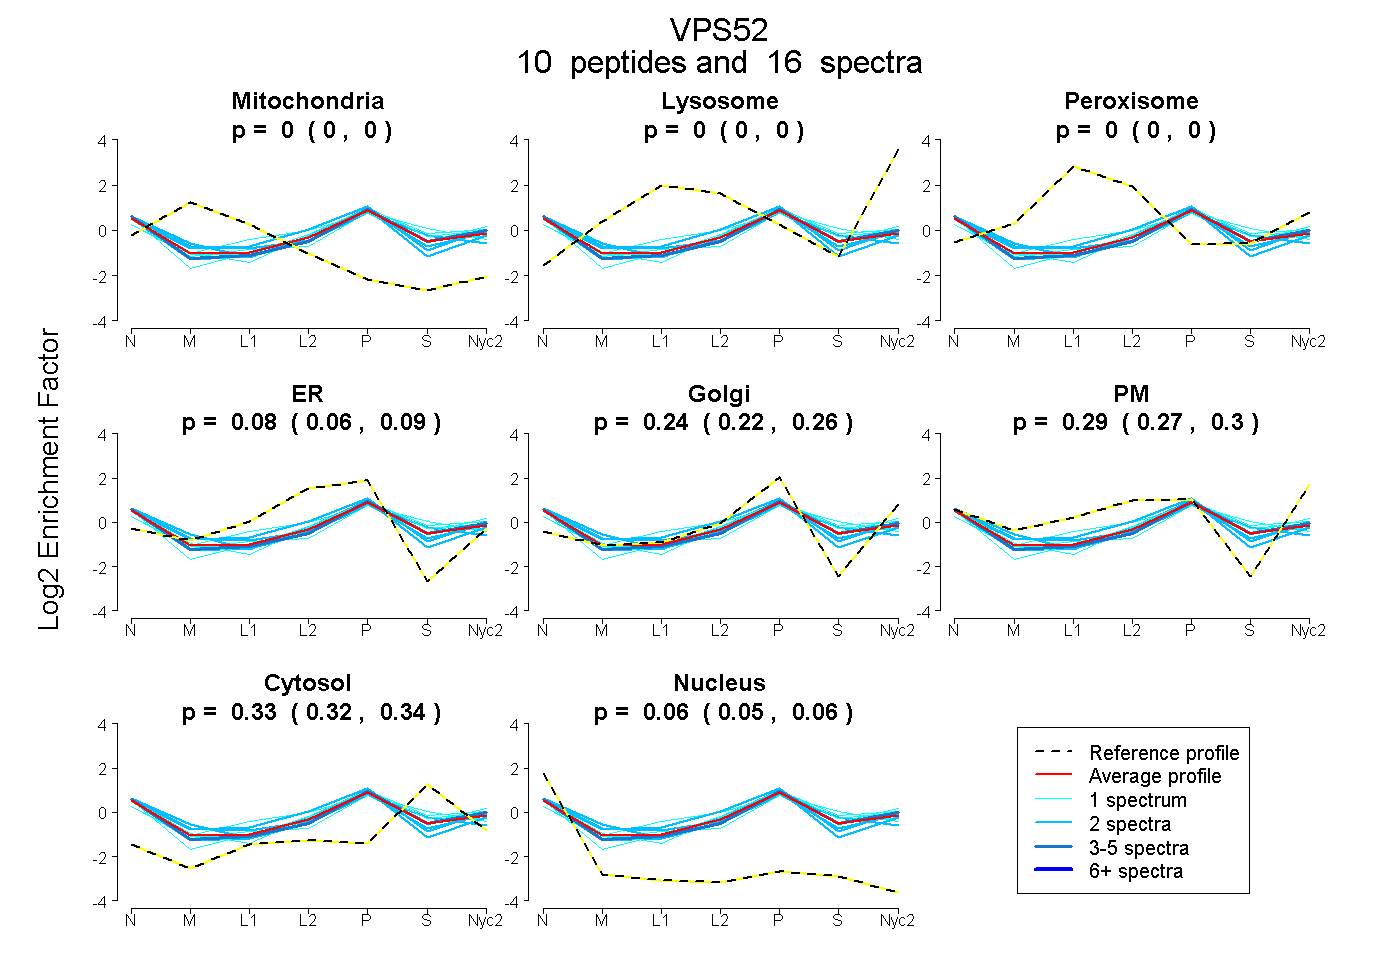
| Plot | Mito | Lyso | Perox | ER | Golgi | PM | Cytosol | Nucleus | |||||
| Expt A |
10 peptides |
16 spectra |
|
0.000 0.000 | 0.000 |
0.000 0.000 | 0.000 |
0.000 0.000 | 0.000 |
0.078 0.059 | 0.093 |
0.243 0.224 | 0.259 |
0.285 0.270 | 0.296 |
0.335 0.324 | 0.343 |
0.060 0.054 | 0.065 |
| 1 spectrum, LGGLDTRPHYITR | 0.000 | 0.000 | 0.023 | 0.221 | 0.000 | 0.366 | 0.337 | 0.053 | ||
| 2 spectra, EAEALIER | 0.000 | 0.000 | 0.000 | 0.153 | 0.225 | 0.143 | 0.389 | 0.089 | ||
| 1 spectrum, GFFSKPSLR | 0.000 | 0.000 | 0.000 | 0.051 | 0.301 | 0.228 | 0.383 | 0.037 | ||
| 1 spectrum, VTQLIR | 0.000 | 0.000 | 0.000 | 0.000 | 0.311 | 0.305 | 0.328 | 0.056 | ||
| 2 spectra, SFTNFR | 0.031 | 0.000 | 0.000 | 0.020 | 0.257 | 0.347 | 0.279 | 0.066 | ||
| 2 spectra, NTIFTLGTR | 0.033 | 0.000 | 0.000 | 0.082 | 0.339 | 0.258 | 0.176 | 0.112 | ||
| 3 spectra, YPFEALFR | 0.000 | 0.000 | 0.000 | 0.000 | 0.341 | 0.260 | 0.328 | 0.071 | ||
| 1 spectrum, ASVESLSQDVMR | 0.000 | 0.000 | 0.042 | 0.027 | 0.336 | 0.114 | 0.440 | 0.040 | ||
| 2 spectra, VLSQPQLR | 0.000 | 0.000 | 0.000 | 0.170 | 0.156 | 0.371 | 0.259 | 0.044 | ||
| 1 spectrum, TLQEQSGAMNIR | 0.000 | 0.000 | 0.000 | 0.045 | 0.298 | 0.248 | 0.408 | 0.000 |
| Plot | Mito | Lyso or Perox | ER | Golgi | PM | Cytosol | Nucleus | ||||||
| Expt B |
3 peptides |
4 spectra |
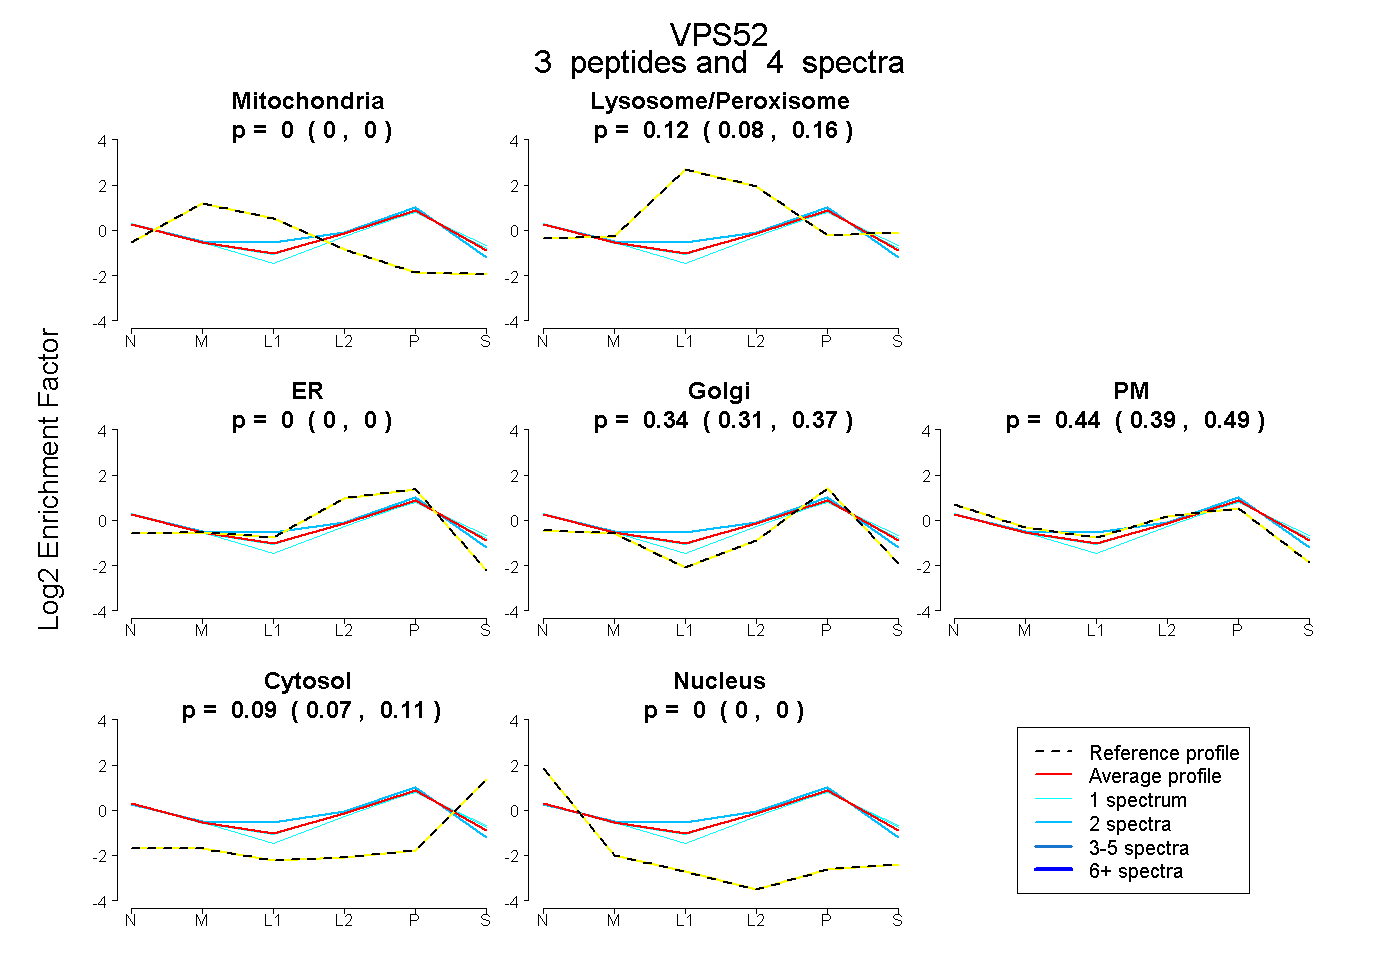 |
0.000 0.000 | 0.000 |
0.122 0.075 | 0.163 |
0.000 0.000 | 0.000 |
0.340 0.309 | 0.367 |
0.444 0.393 | 0.488 |
0.094 0.068 | 0.114 |
0.000 0.000 | 0.000 |
|||
| Plot | Lyso | Other | |||||||||||
| Expt C |
5 peptides |
10 spectra |
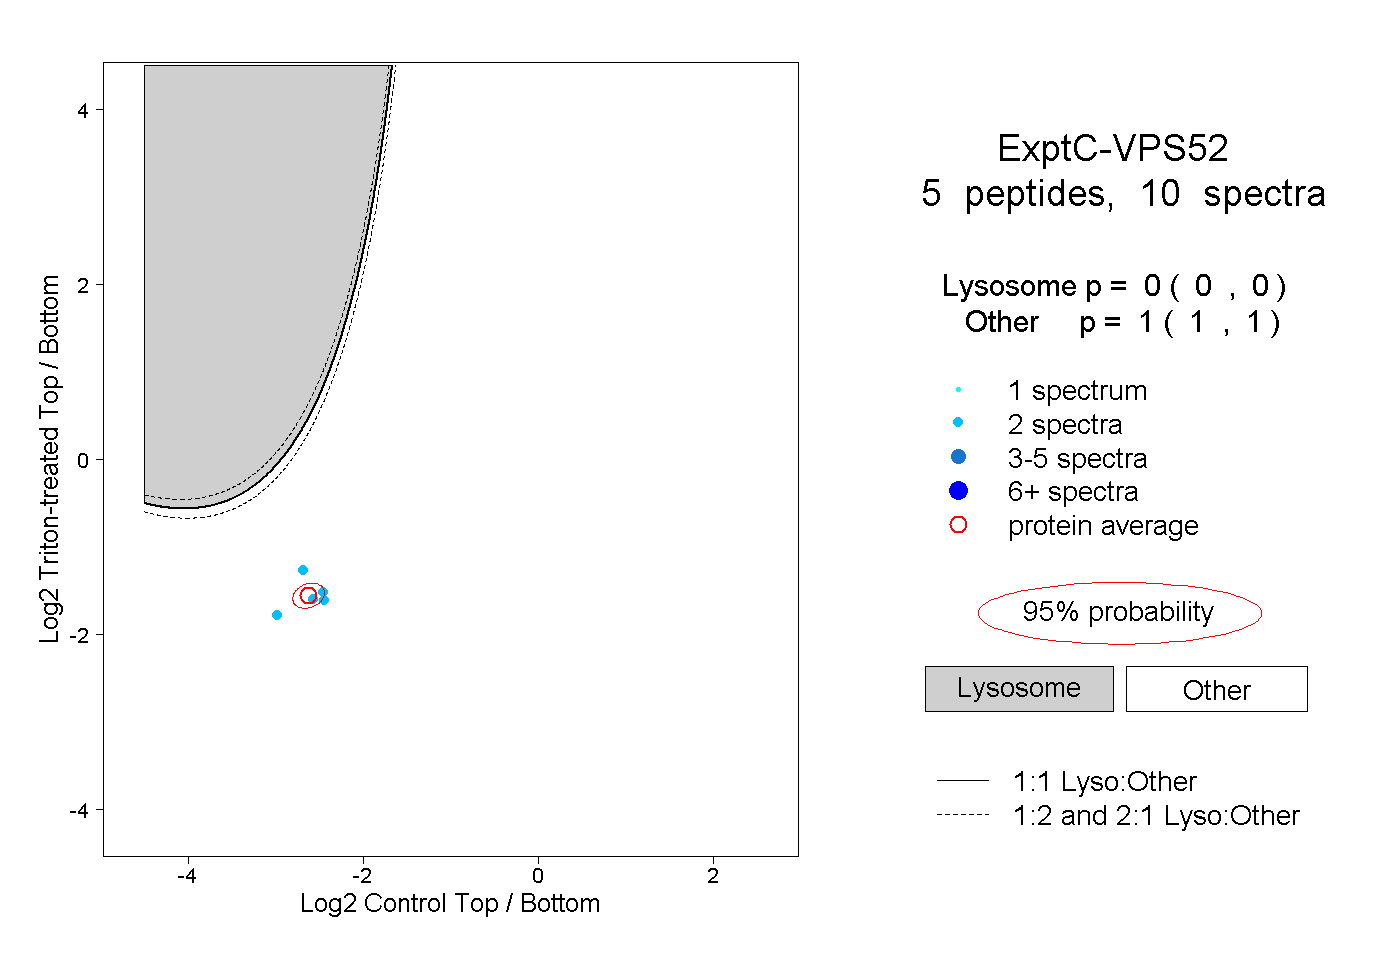 |
0.000 0.000 | 0.000 |
1.000 1.000 | 1.000 |
||||||||
| Plot | Lyso | Other | |||||||||||
| Expt D |
3 peptides |
5 spectra |
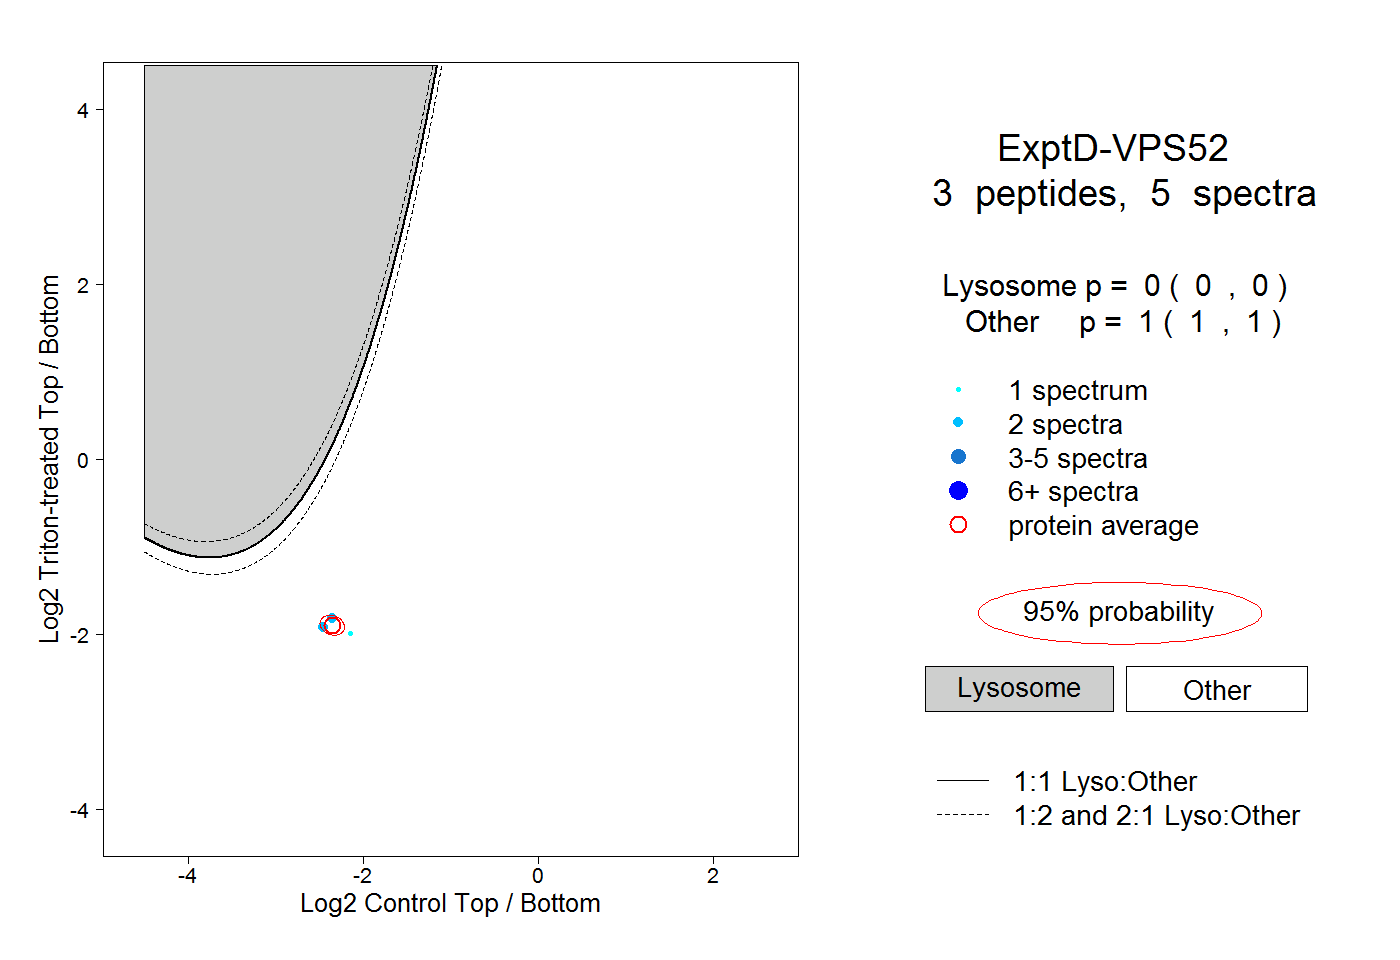 |
0.000 0.000 | 0.000 |
1.000 1.000 | 1.000 |