VPS52
[ENSRNOP00000000549]
Main page
| | | Plot |
Mito |
Lyso |
|
Perox |
ER |
Golgi |
PM |
Cytosol |
Nucleus |
|
| Expt A |
 10
10
peptides |
16
spectra |
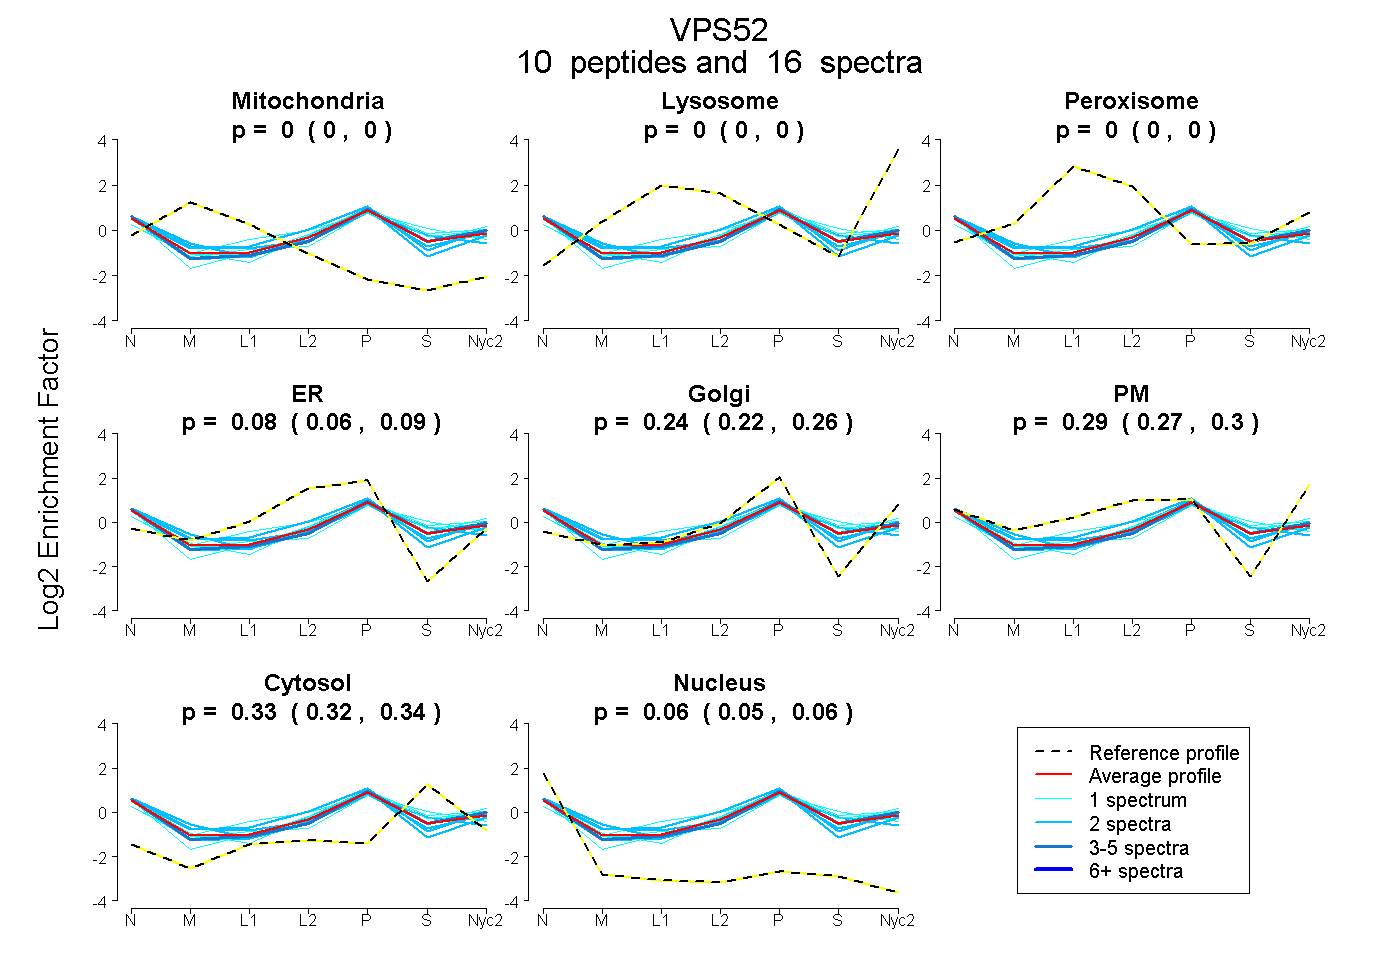 |
0.000
0.000 | 0.000 |
0.000
0.000 | 0.000 |
|
0.000
0.000 | 0.000 |
0.078
0.059 | 0.093 |
0.243
0.224 | 0.259 |
0.285
0.270 | 0.296 |
0.335
0.324 | 0.343 |
0.060
0.054 | 0.065 |
|
| | | Plot |
Mito |
|
Lyso or Perox |
|
ER |
Golgi |
PM |
Cytosol |
Nucleus |
|
| Expt B |
3
peptides |
4
spectra |
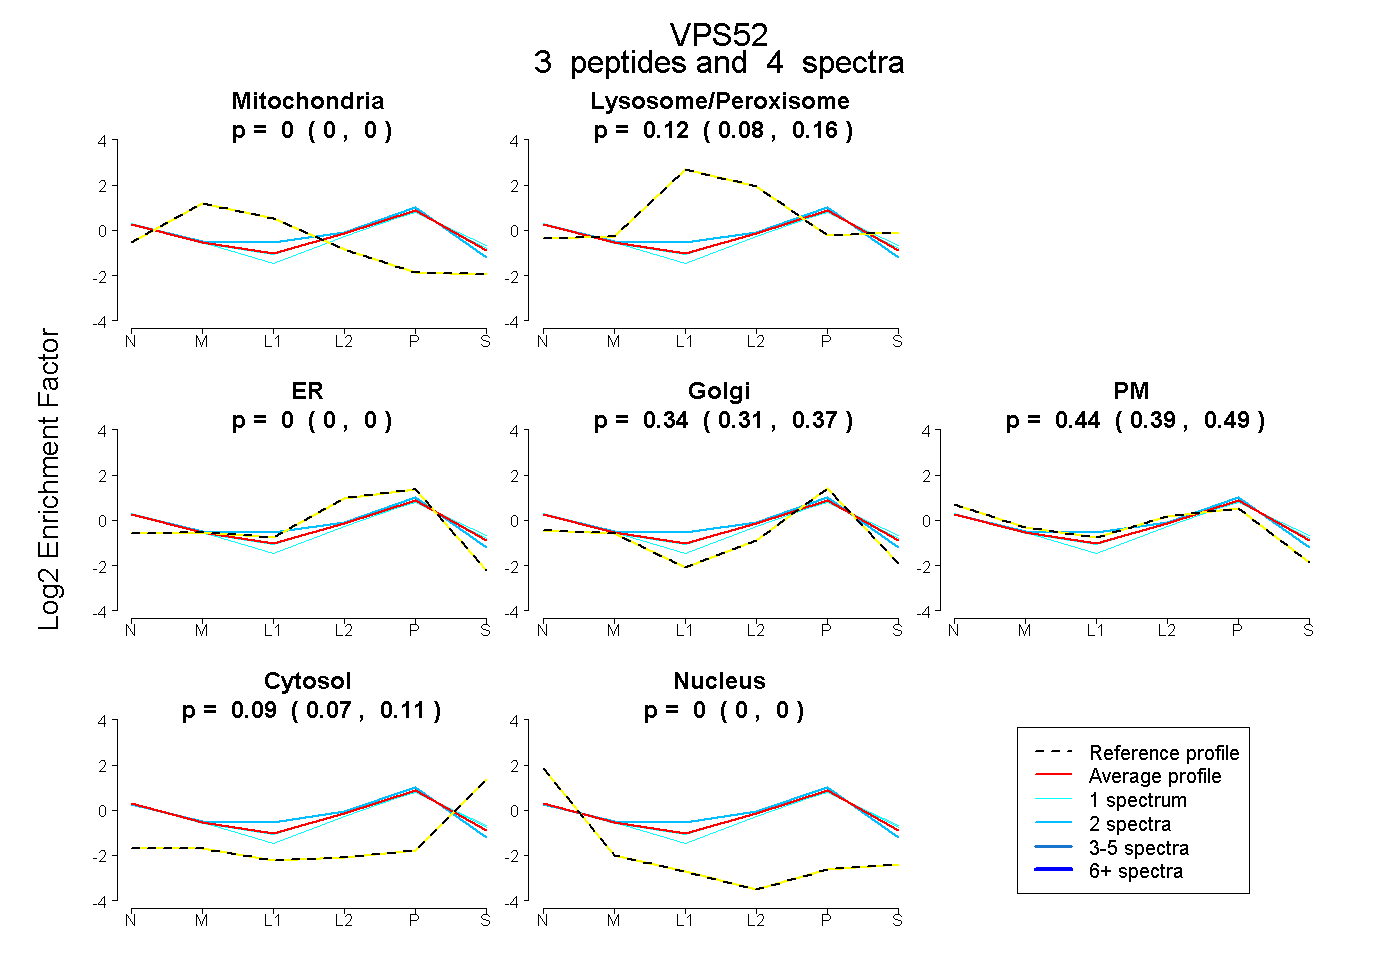 |
0.000
0.000 | 0.000 |
|
0.122
0.075 | 0.163 |
|
0.000
0.000 | 0.000 |
0.340
0.309 | 0.367 |
0.444
0.393 | 0.488 |
0.094
0.068 | 0.114 |
0.000
0.000 | 0.000 |
|
| 2 spectra, VTQLIR |
0.000 |
|
0.209 |
|
0.000 |
0.427 |
0.360 |
0.005 |
0.000 |
|
| 1 spectrum, NTIFTLGTR |
0.000 |
|
0.121 |
|
0.000 |
0.276 |
0.467 |
0.136 |
0.000 |
|
| 1 spectrum, VLSQPQLR |
0.000 |
|
0.036 |
|
0.000 |
0.311 |
0.510 |
0.143 |
0.000 |
|
| | | Plot |
|
Lyso |
|
|
|
|
|
|
|
Other |
| Expt C |
5
peptides |
10
spectra |
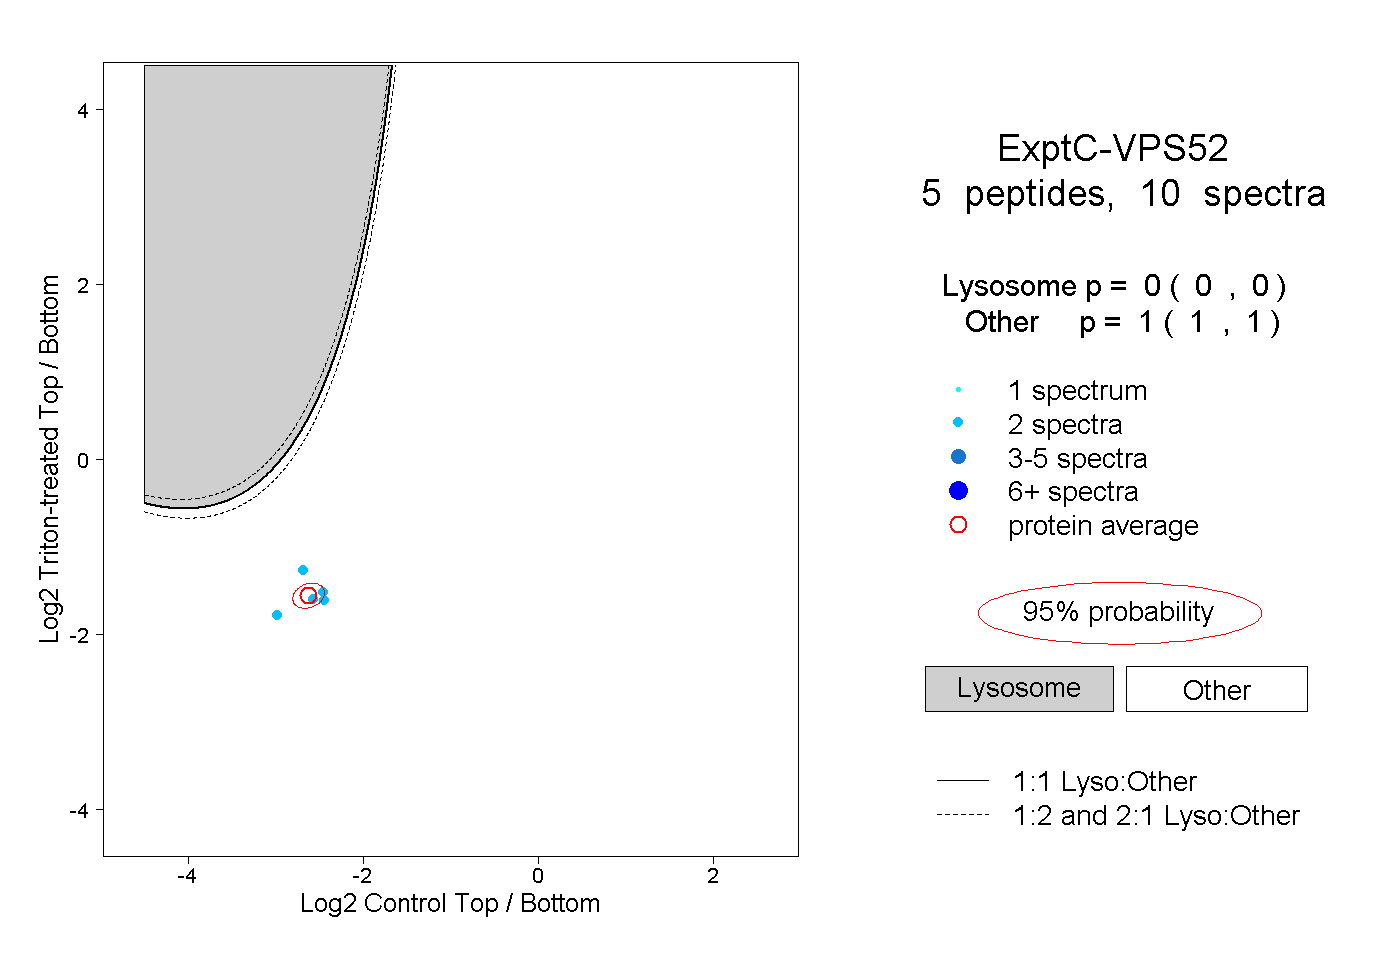 |
|
0.000
0.000 | 0.000 |
|
|
|
|
|
|
|
1.000
1.000 | 1.000 |
| | | Plot |
|
Lyso |
|
|
|
|
|
|
|
Other |
| Expt D |
3
peptides |
5
spectra |
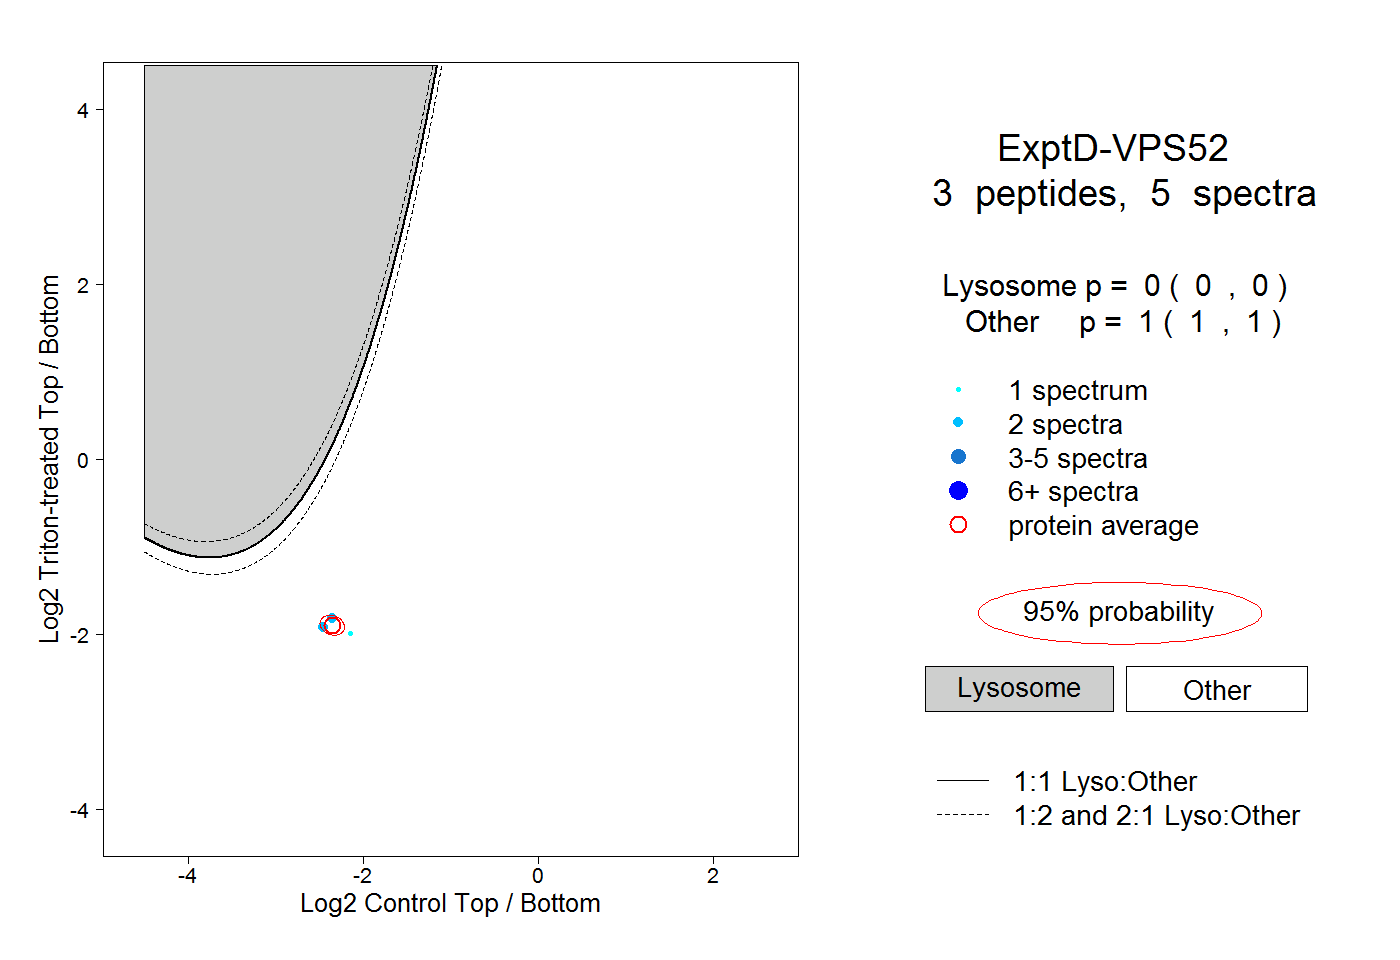 |
|
0.000
0.000 | 0.000 |
|
|
|
|
|
|
|
1.000
1.000 | 1.000 |