 35
35peptides
spectra
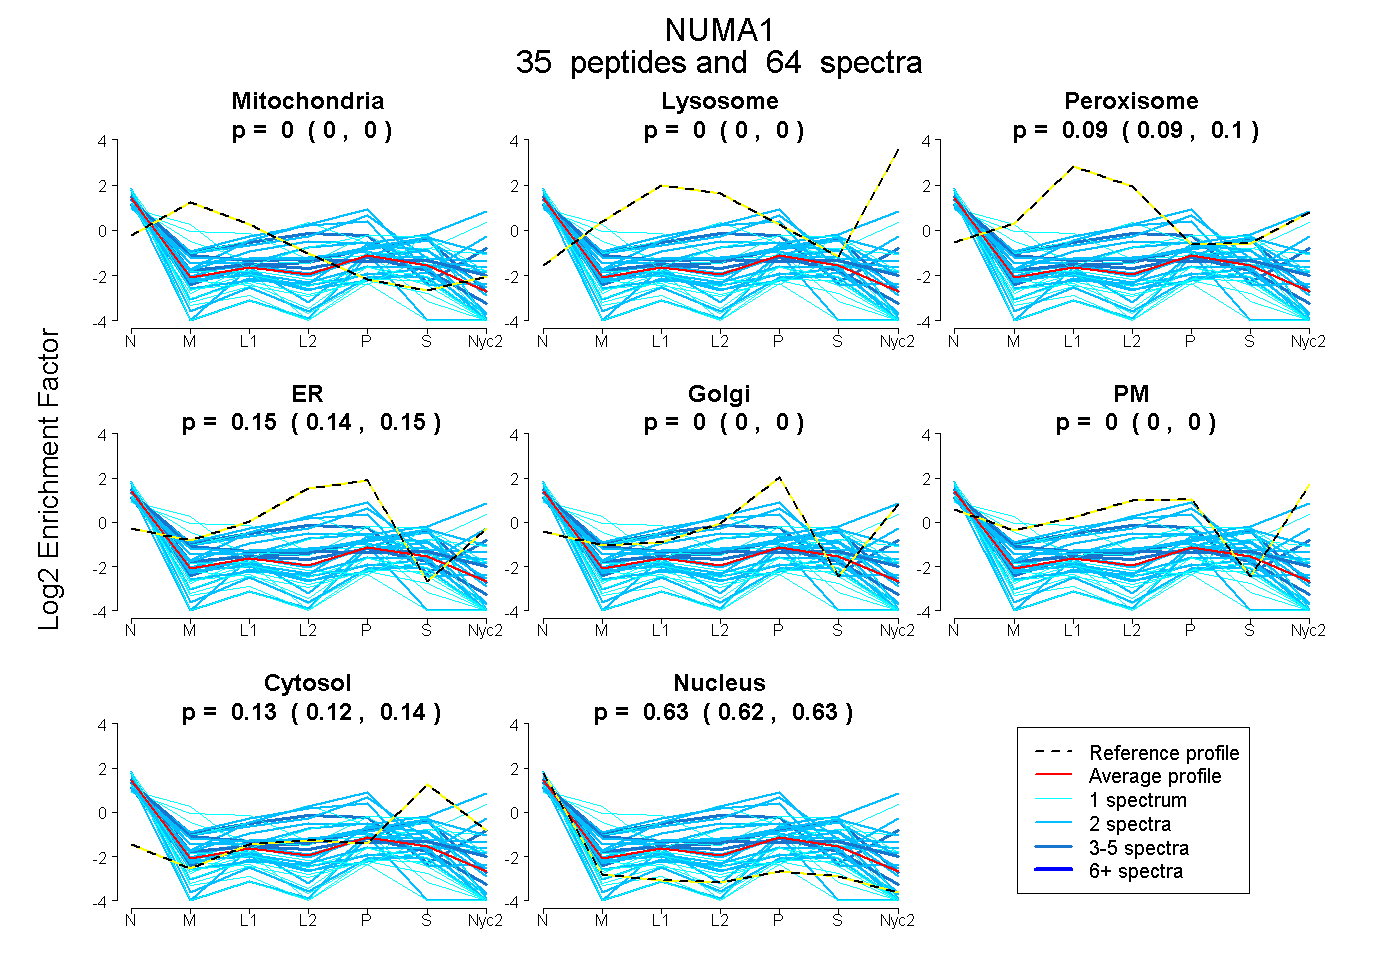
0.000 | 0.000
0.000 | 0.000
0.086 | 0.102
0.137 | 0.155
0.000 | 0.000
0.000 | 0.000
0.122 | 0.139
0.621 | 0.633
2peptides
spectra
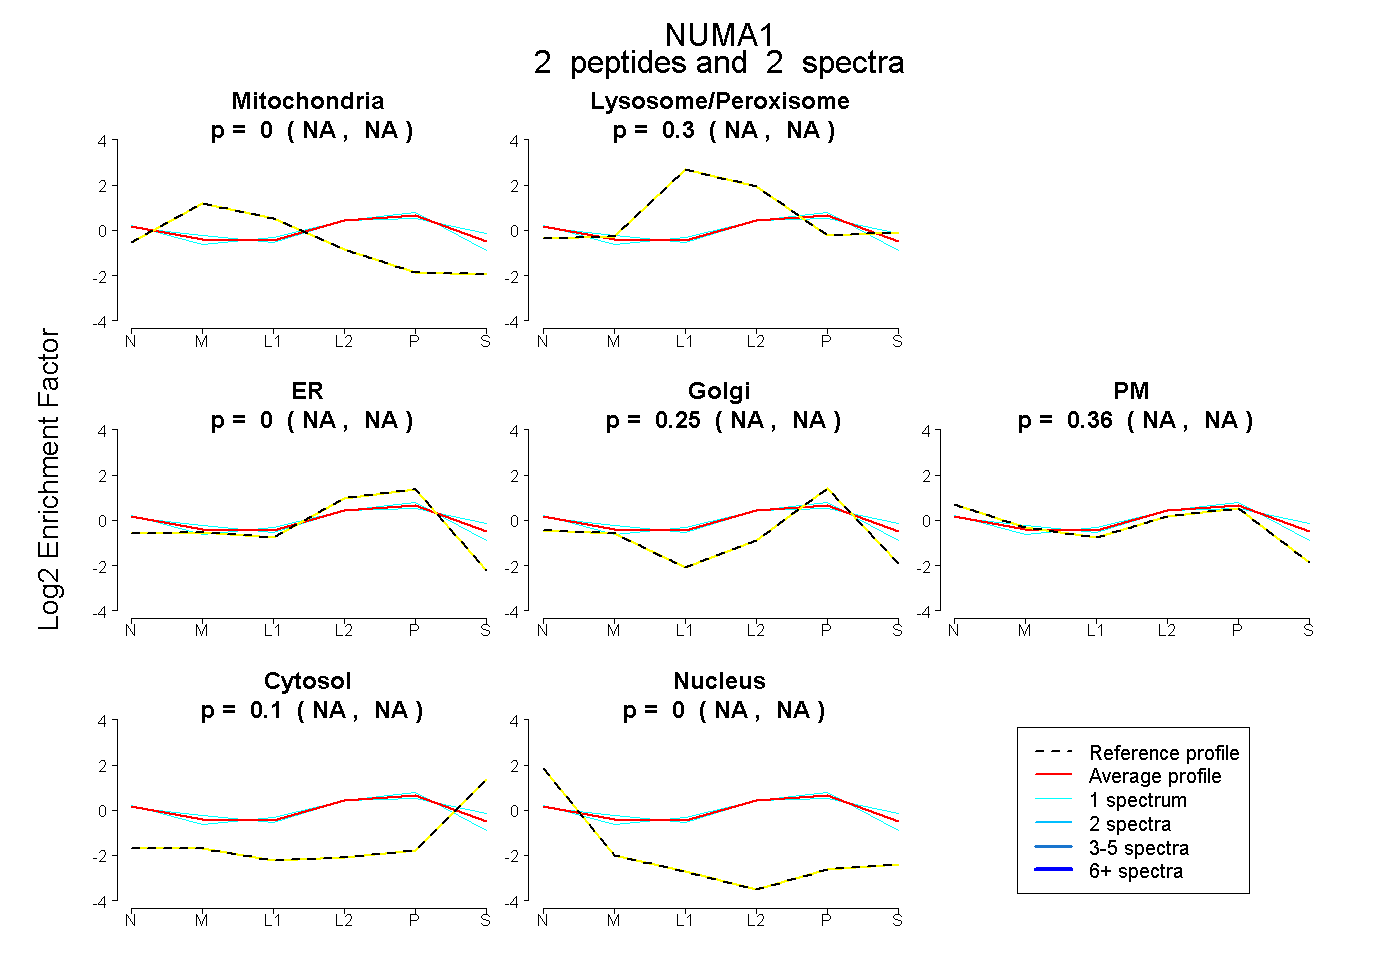
NA | NA
NA | NA
NA | NA
NA | NA
NA | NA
NA | NA
NA | NA
12peptides
spectra
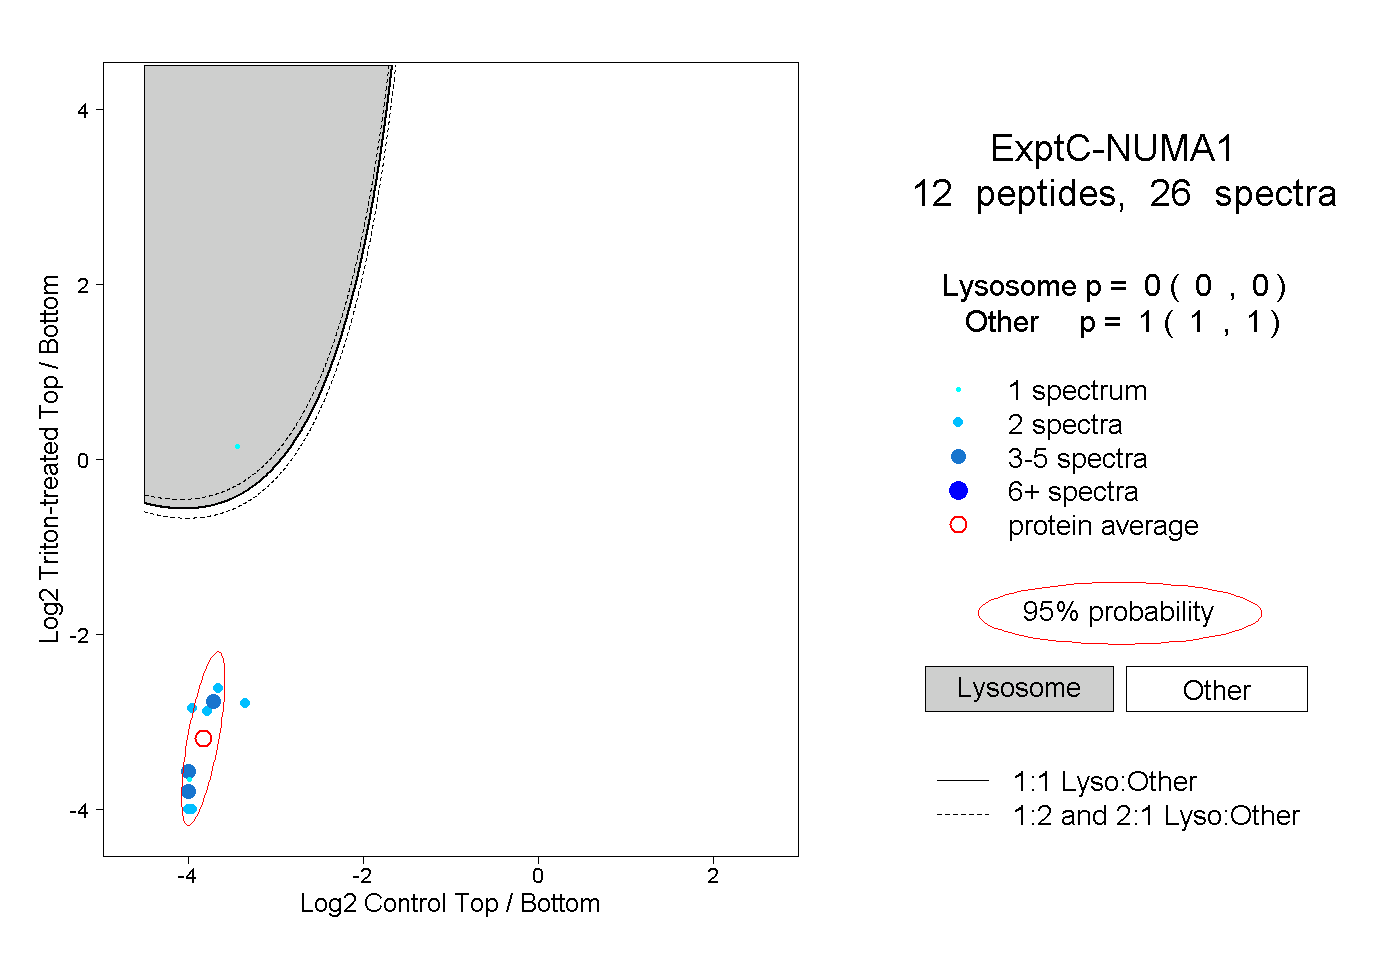
0.000 | 0.000
1.000 | 1.000
1peptide
spectrum
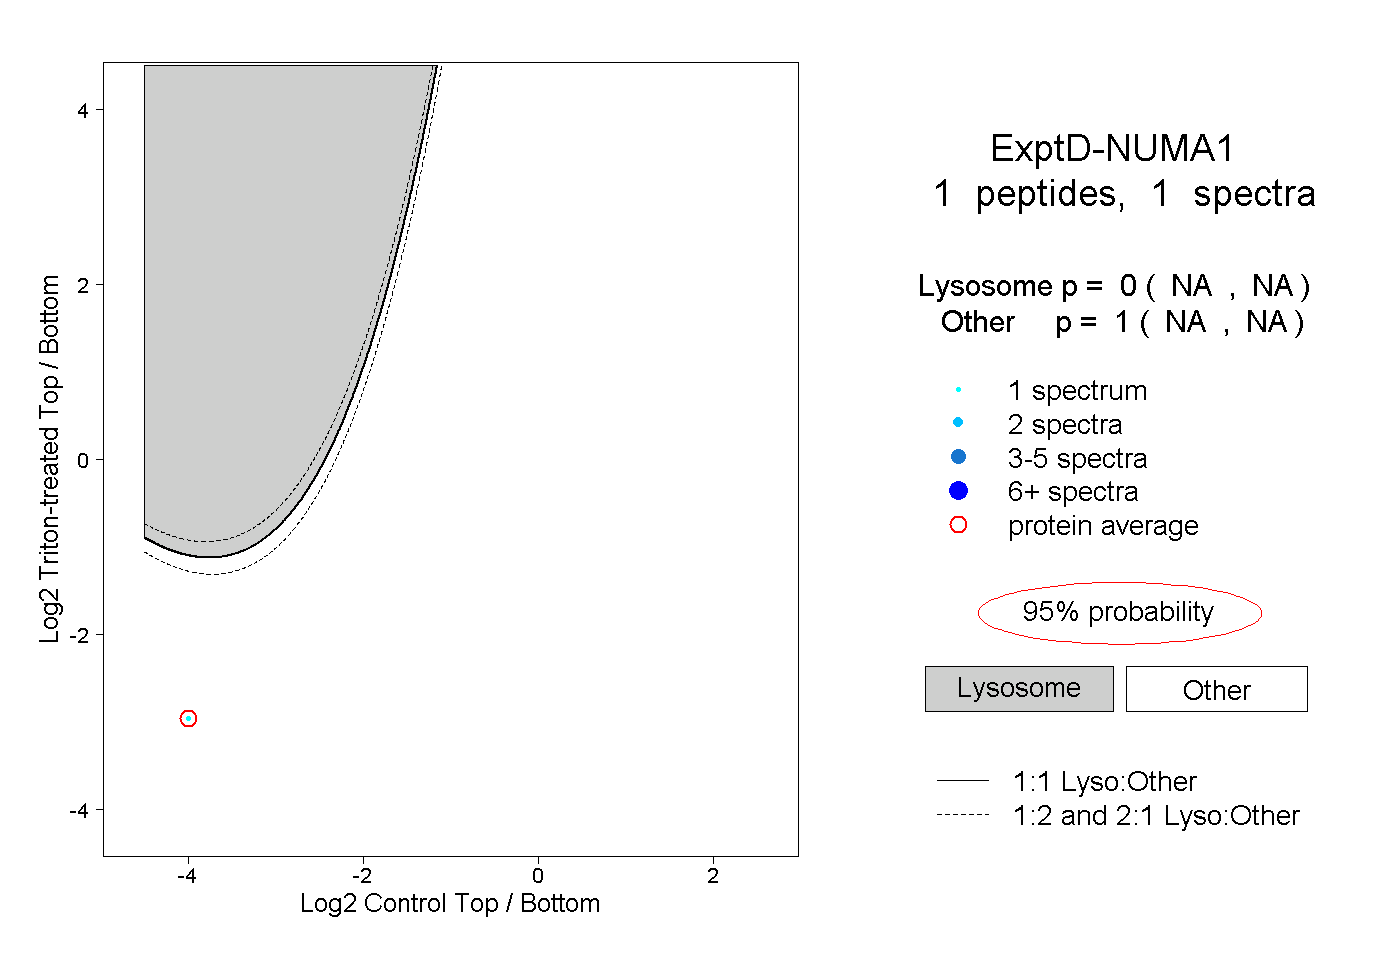
NA | NA
NA | NA