NUMA1
[ENSRNOP00000000474]
Main page
| | | Plot |
Mito |
Lyso |
|
Perox |
ER |
Golgi |
PM |
Cytosol |
Nucleus |
|
| Expt A |
 35
35
peptides |
64
spectra |
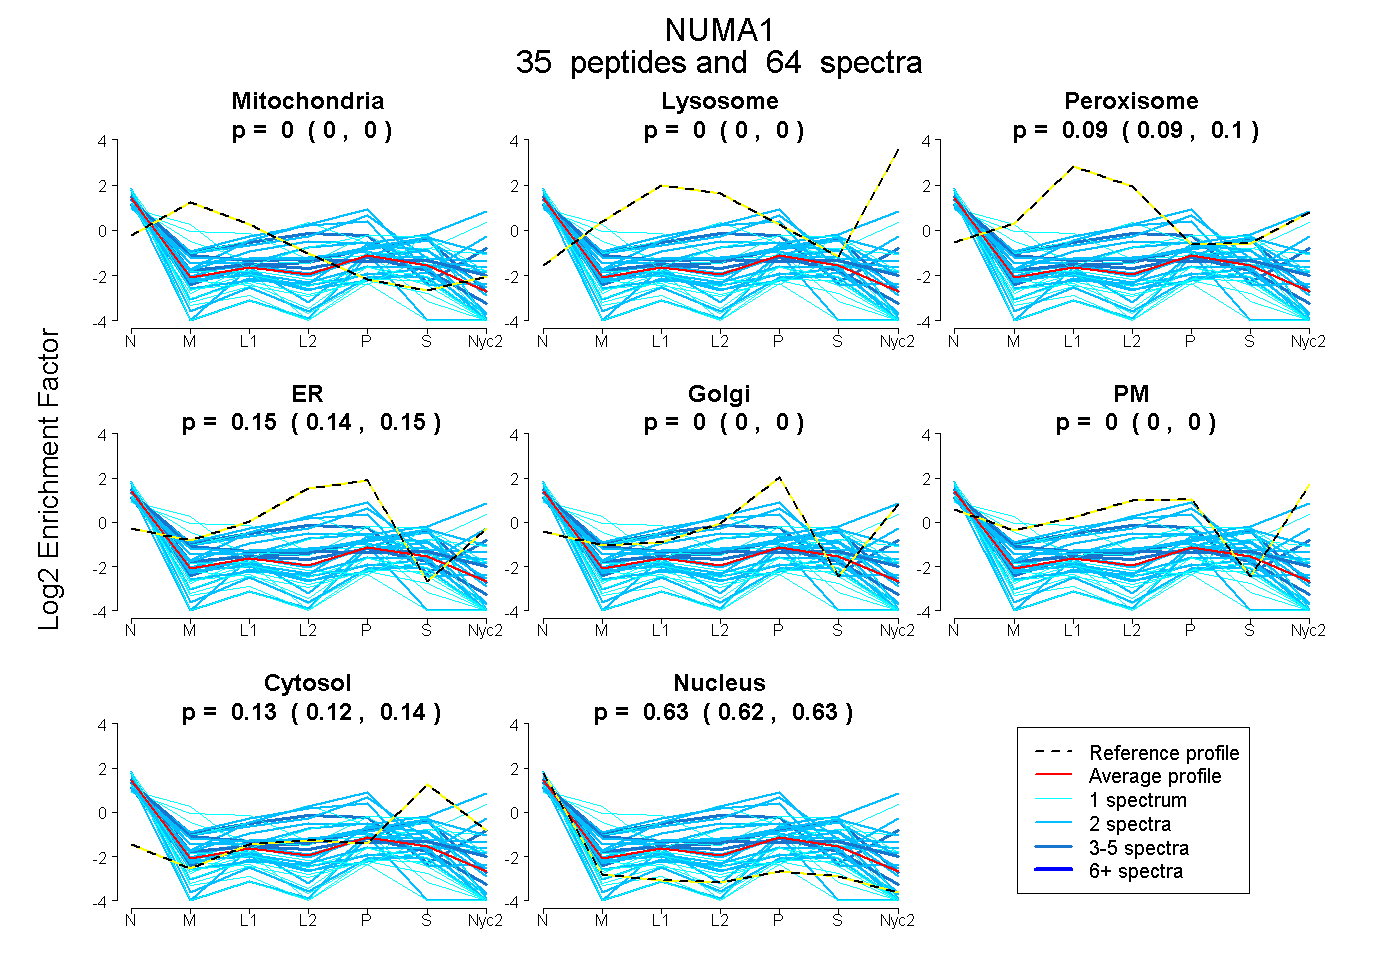 |
0.000
0.000 | 0.000 |
0.000
0.000 | 0.000 |
|
0.095
0.086 | 0.102 |
0.147
0.137 | 0.155 |
0.000
0.000 | 0.000 |
0.000
0.000 | 0.000 |
0.131
0.122 | 0.139 |
0.627
0.621 | 0.633 |
|
| | | Plot |
Mito |
|
Lyso or Perox |
|
ER |
Golgi |
PM |
Cytosol |
Nucleus |
|
| Expt B |
2
peptides |
2
spectra |
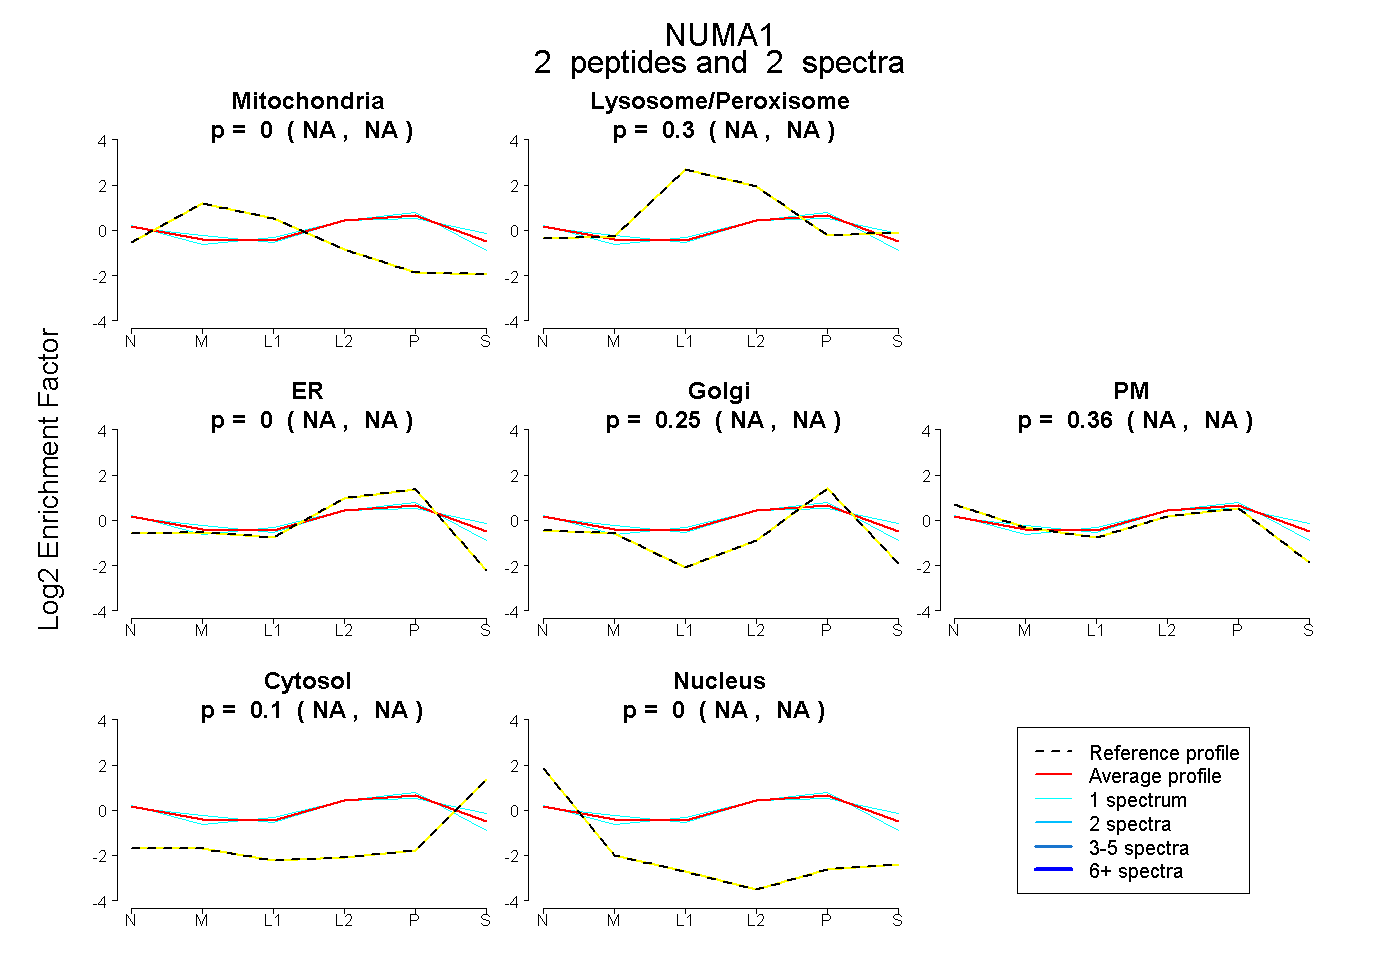 |
0.000
NA | NA |
|
0.295
NA | NA |
|
0.000
NA | NA |
0.247
NA | NA |
0.361
NA | NA |
0.097
NA | NA |
0.000
NA | NA |
|
| | | Plot |
|
Lyso |
|
|
|
|
|
|
|
Other |
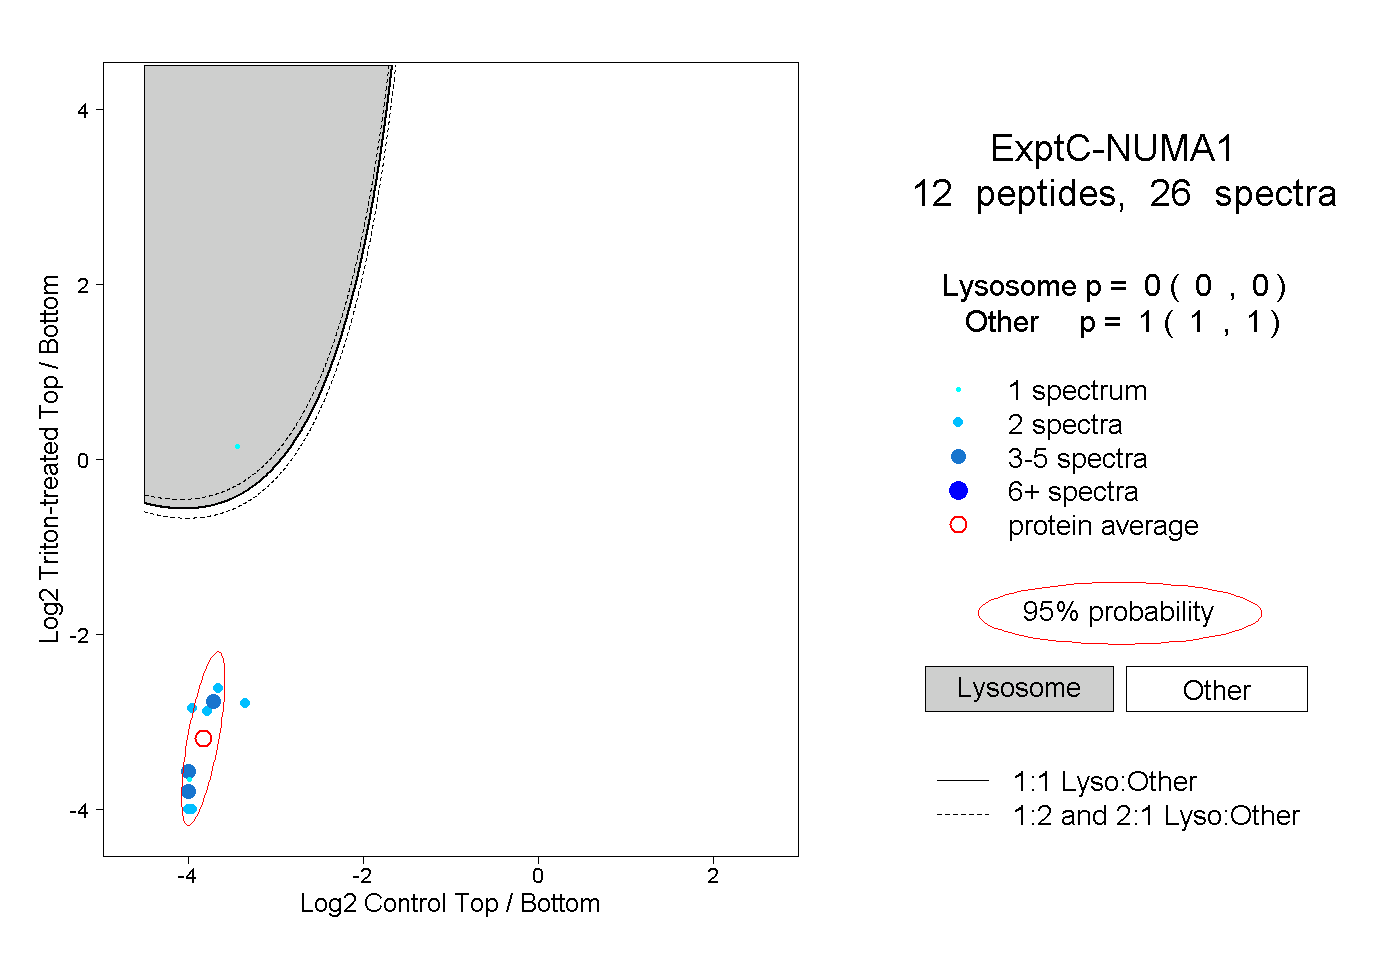
| Expt C |
12
peptides |
26
spectra |
 |
|
0.000
0.000 | 0.000 |
|
|
|
|
|
|
|
1.000
1.000 | 1.000 |
| 3 spectra, LLDDLSALR |
|
0.000 |
|
|
|
|
|
|
|
1.000 |
| 1 spectrum, AAPVLK |
|
0.998 |
|
|
|
|
|
|
|
0.002 |
| 1 spectrum, QELASQAER |
|
0.000 |
|
|
|
|
|
|
|
1.000 |
| 2 spectra, IDHLALLNEK |
|
0.000 |
|
|
|
|
|
|
|
1.000 |
| 2 spectra, DTAQTSVTQAQR |
|
0.000 |
|
|
|
|
|
|
|
1.000 |
| 3 spectra, AEESGQELK |
|
0.000 |
|
|
|
|
|
|
|
1.000 |
| 2 spectra, LATDNTELQAR |
|
0.000 |
|
|
|
|
|
|
|
1.000 |
| 4 spectra, LQNTLNEQR |
|
0.000 |
|
|
|
|
|
|
|
1.000 |
| 2 spectra, IGQEEQK |
|
0.000 |
|
|
|
|
|
|
|
1.000 |
| 2 spectra, GSLEEEK |
|
0.000 |
|
|
|
|
|
|
|
1.000 |
| 2 spectra, TEAPGPEVEALR |
|
0.000 |
|
|
|
|
|
|
|
1.000 |
| 2 spectra, ISQLEDR |
|
0.000 |
|
|
|
|
|
|
|
1.000 |
| | | Plot |
|
Lyso |
|
|
|
|
|
|
|
Other |
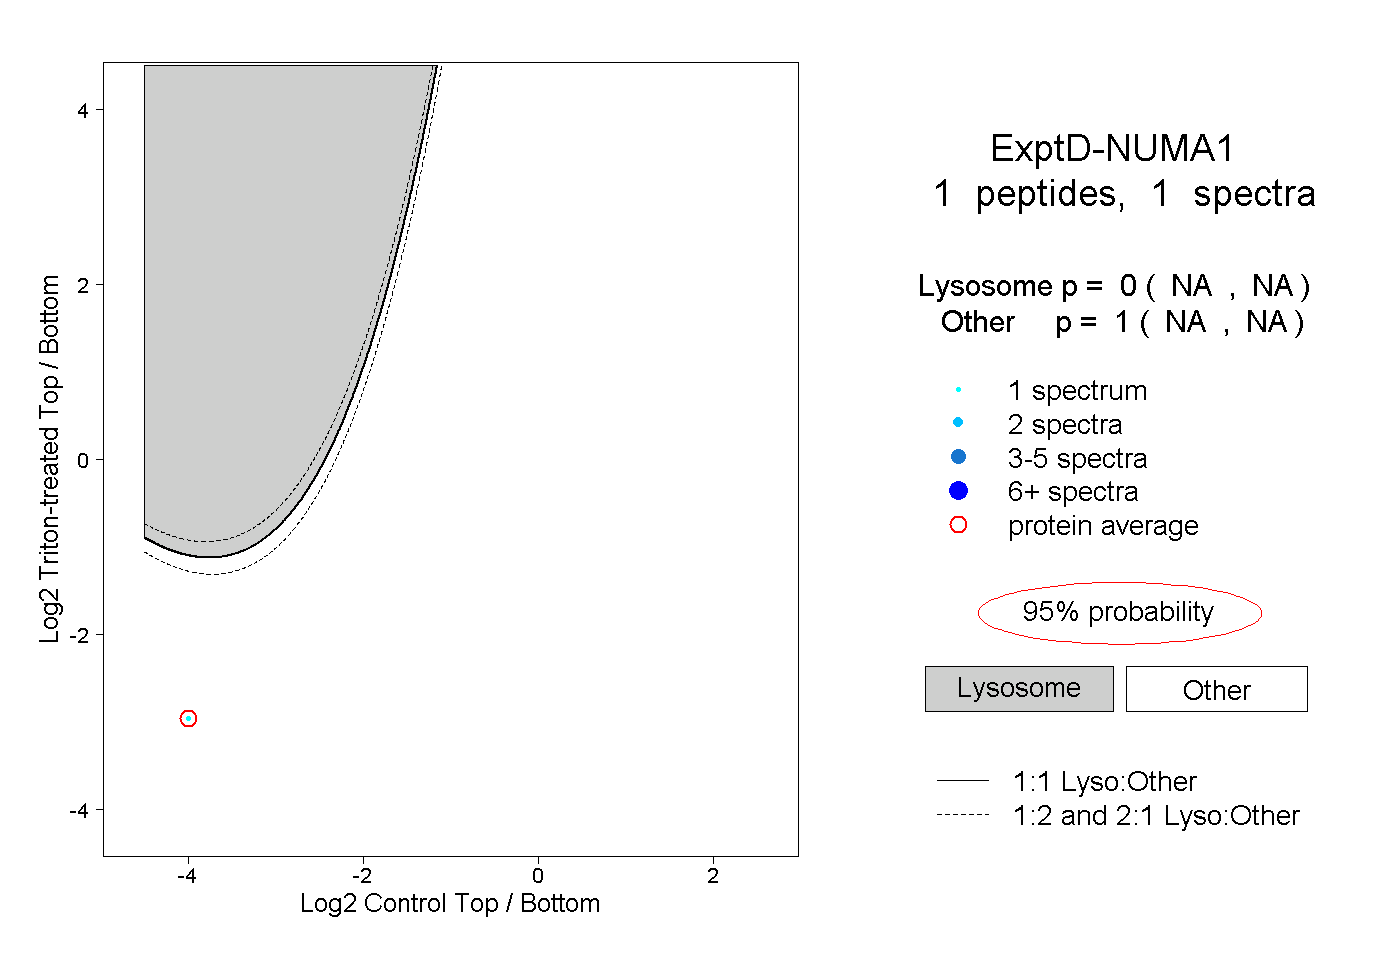
| Expt D |
1
peptide |
1
spectrum |
 |
|
0.000
NA | NA |
|
|
|
|
|
|
|
1.000
NA | NA |