 4
4peptides
spectra
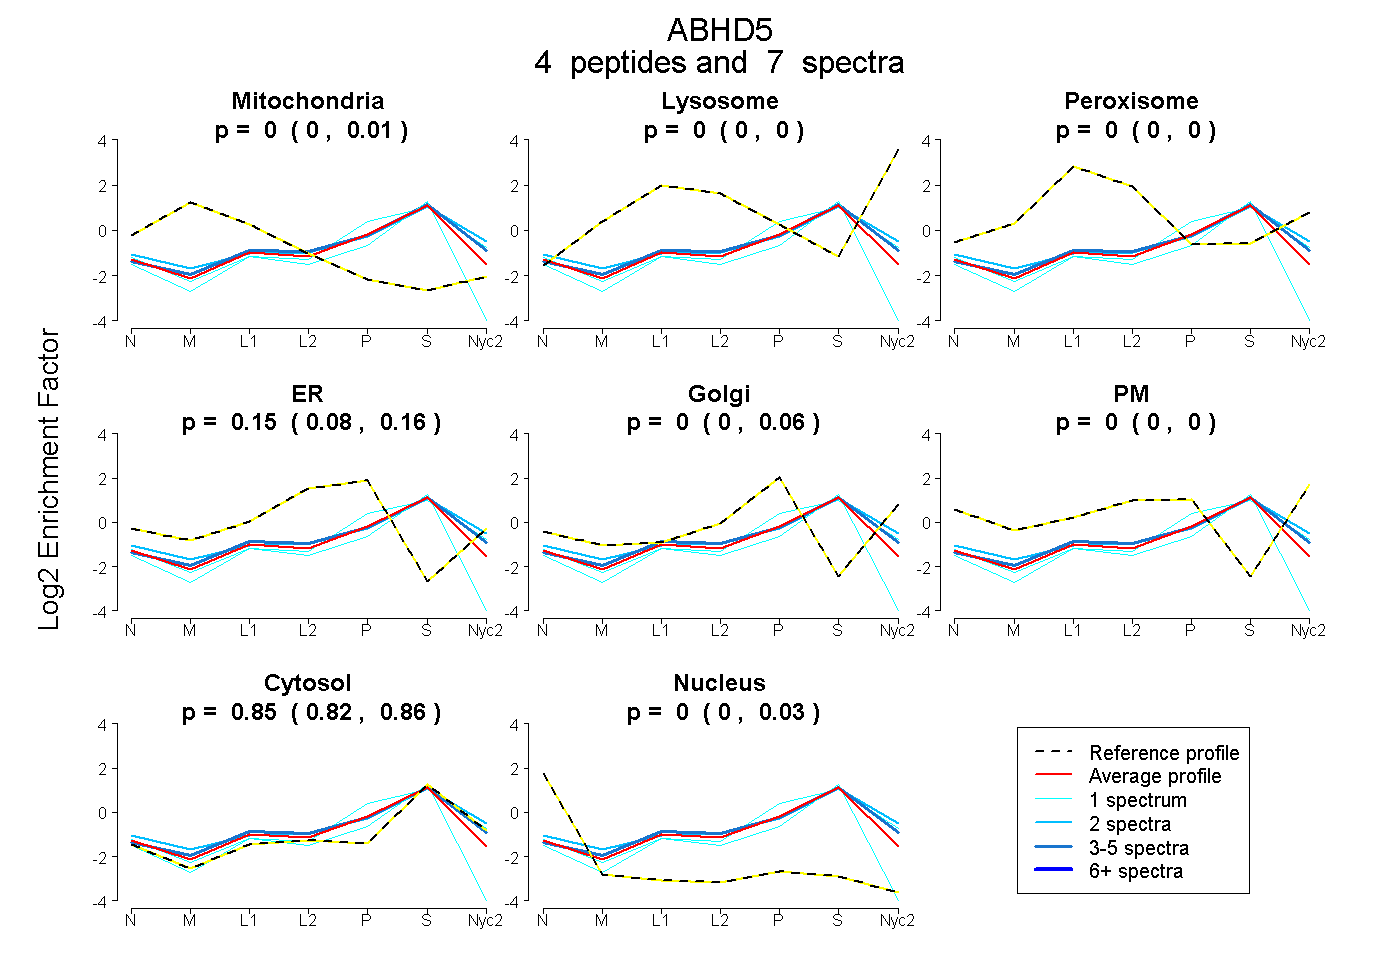
0.000 | 0.011
0.000 | 0.000
0.000 | 0.000
0.085 | 0.160
0.000 | 0.056
0.000 | 0.000
0.821 | 0.864
0.000 | 0.025
2peptides
spectra
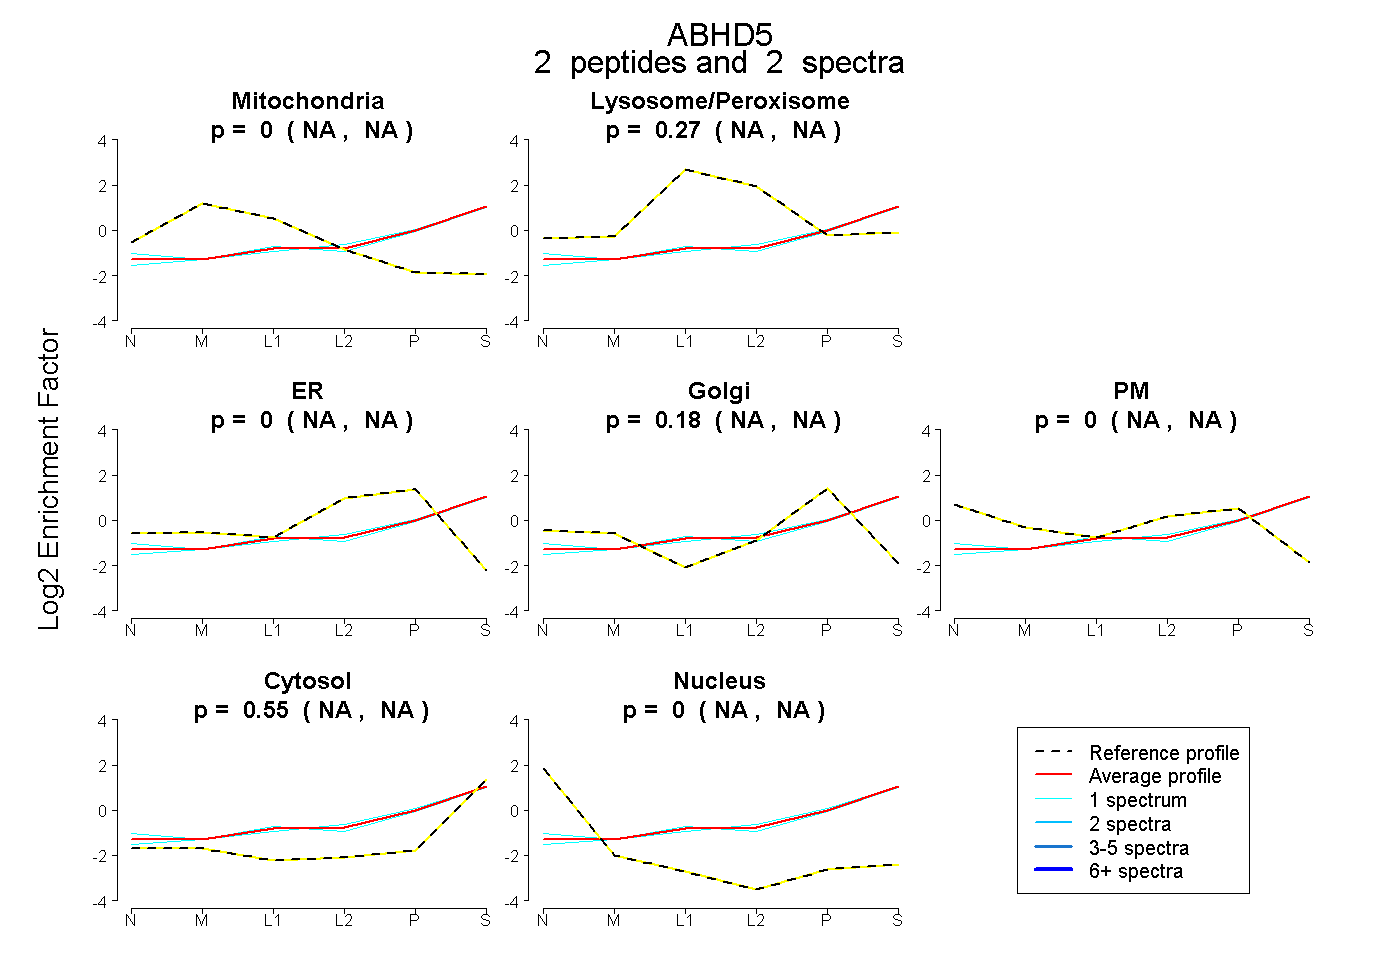
NA | NA
NA | NA
NA | NA
NA | NA
NA | NA
NA | NA
NA | NA
2peptides
spectra
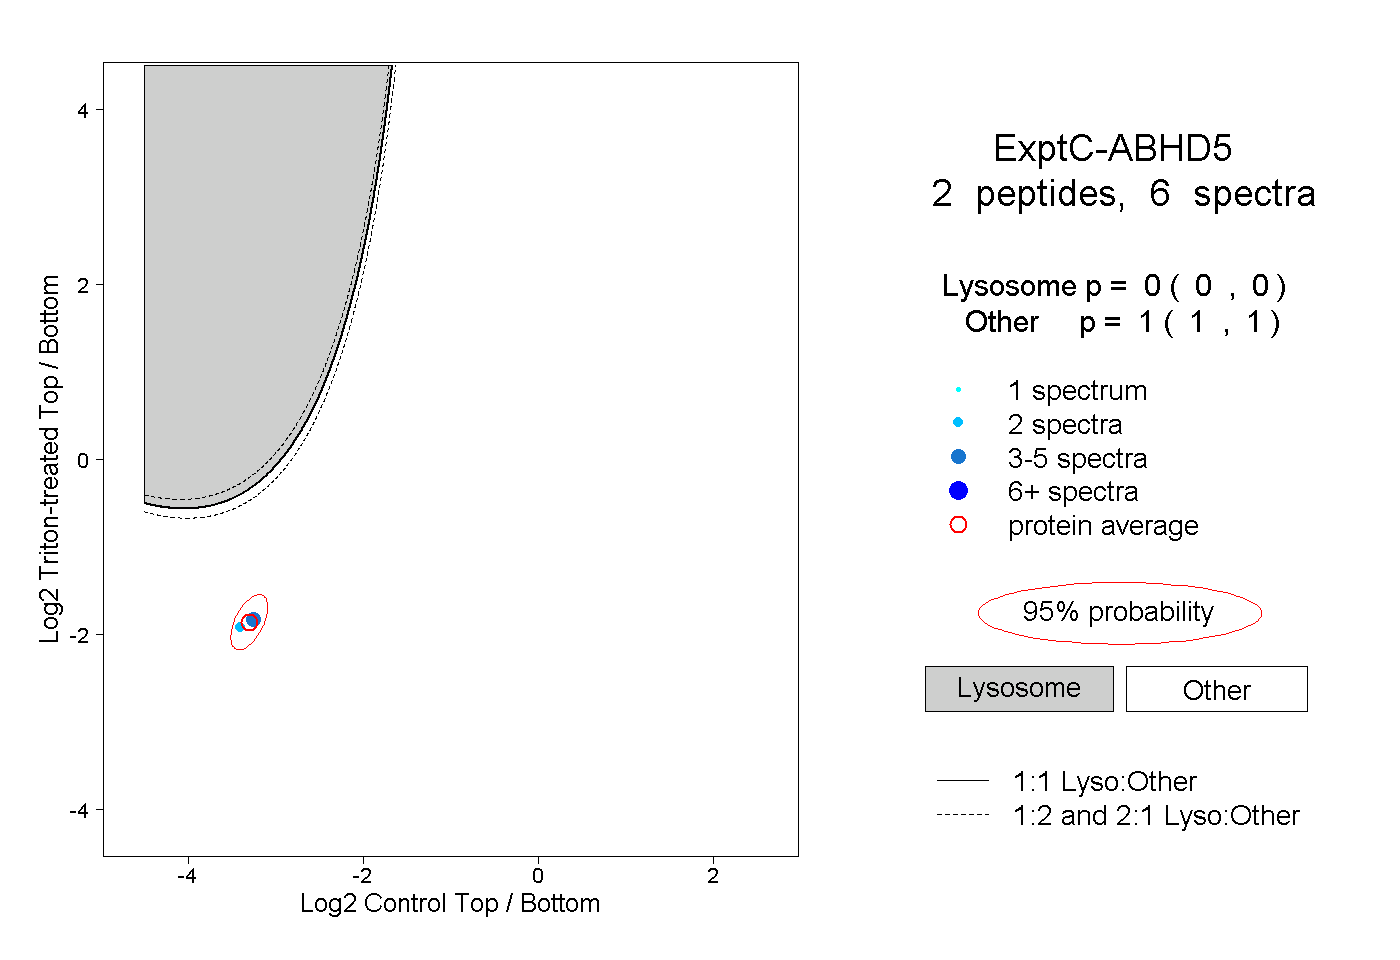
0.000 | 0.000
1.000 | 1.000