 4
4peptides
spectra
0.000 | 0.011
0.000 | 0.000
0.000 | 0.000
0.085 | 0.160
0.000 | 0.056
0.000 | 0.000
0.821 | 0.864
0.000 | 0.025
| Plot | Mito | Lyso | Perox | ER | Golgi | PM | Cytosol | Nucleus | |||||
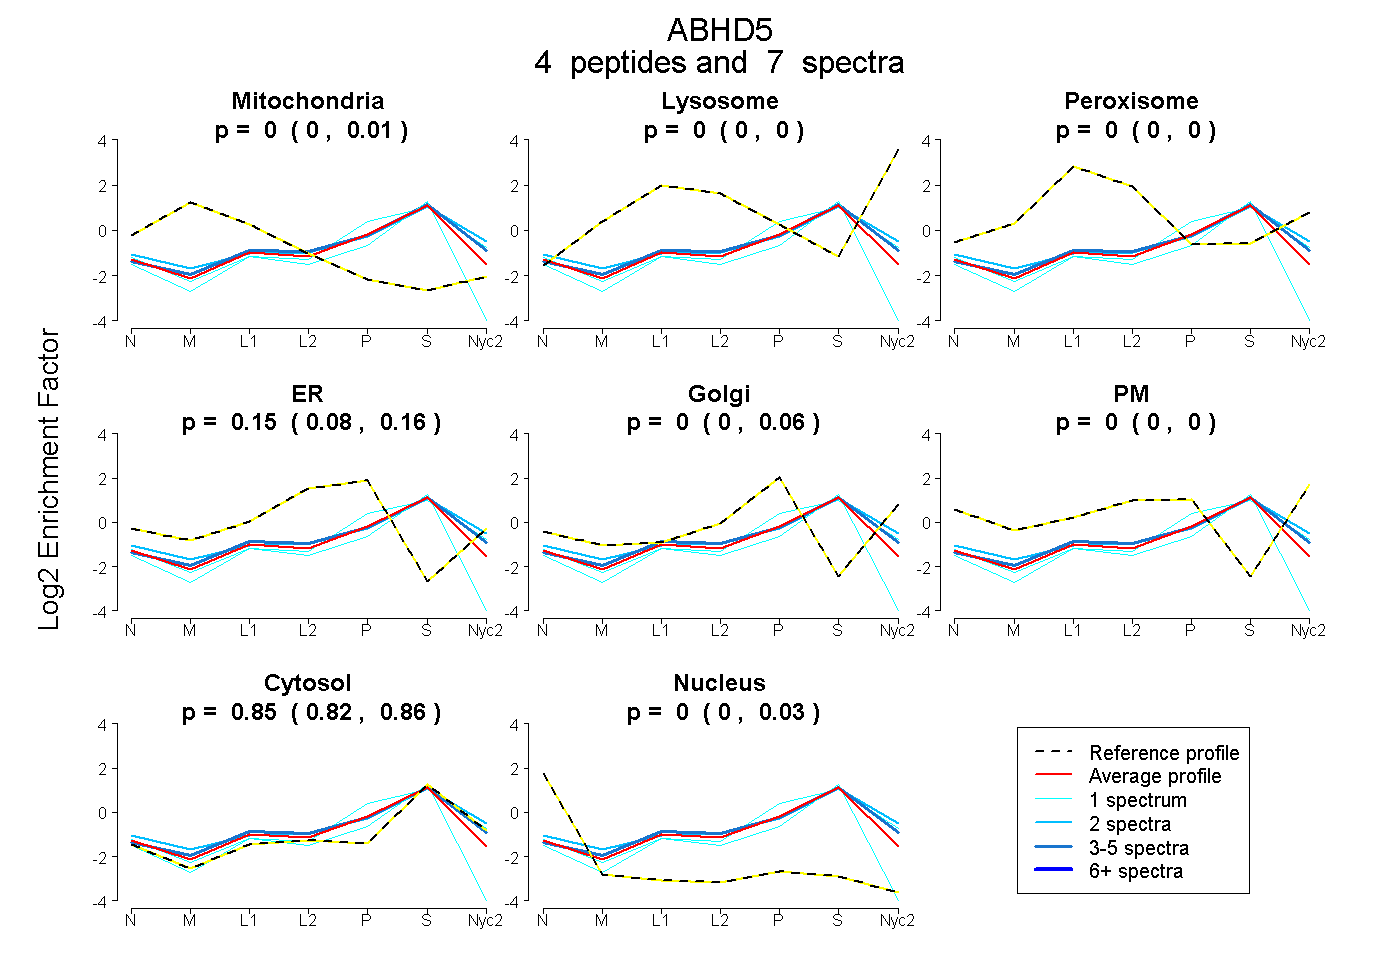
| Expt A |
4 peptides |
7 spectra |
|
0.000 0.000 | 0.011 |
0.000 0.000 | 0.000 |
0.000 0.000 | 0.000 |
0.146 0.085 | 0.160 |
0.000 0.000 | 0.056 |
0.000 0.000 | 0.000 |
0.854 0.821 | 0.864 |
0.000 0.000 | 0.025 |
| 3 spectra, IGGLHPDIPVSVIFGAR | 0.000 | 0.000 | 0.039 | 0.123 | 0.027 | 0.000 | 0.812 | 0.000 | ||
| 1 spectrum, SCIDGNSGTSIQSLRPK | 0.000 | 0.000 | 0.000 | 0.000 | 0.000 | 0.000 | 0.823 | 0.177 | ||
| 1 spectrum, CVPCTYK | 0.000 | 0.000 | 0.000 | 0.000 | 0.239 | 0.000 | 0.761 | 0.000 | ||
| 2 spectra, IAGPFGLSLVQR | 0.000 | 0.000 | 0.077 | 0.000 | 0.165 | 0.000 | 0.757 | 0.000 |
| Plot | Mito | Lyso or Perox | ER | Golgi | PM | Cytosol | Nucleus | ||||||
| Expt B |
2 peptides |
2 spectra |
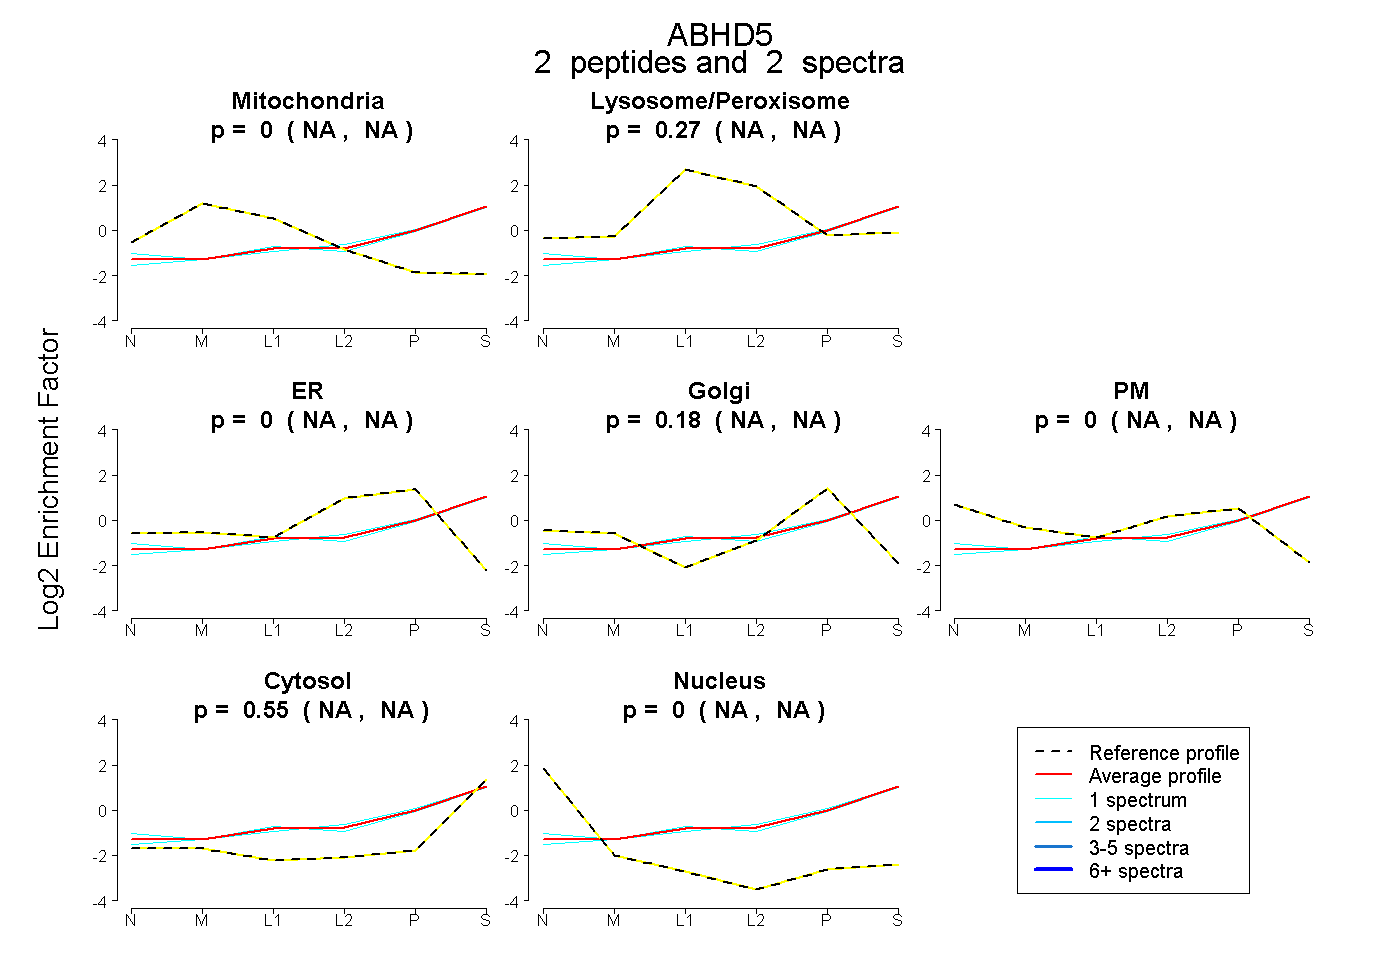 |
0.000 NA | NA |
0.271 NA | NA |
0.000 NA | NA |
0.176 NA | NA |
0.000 NA | NA |
0.553 NA | NA |
0.000 NA | NA |
|||
| Plot | Lyso | Other | |||||||||||
| Expt C |
2 peptides |
6 spectra |
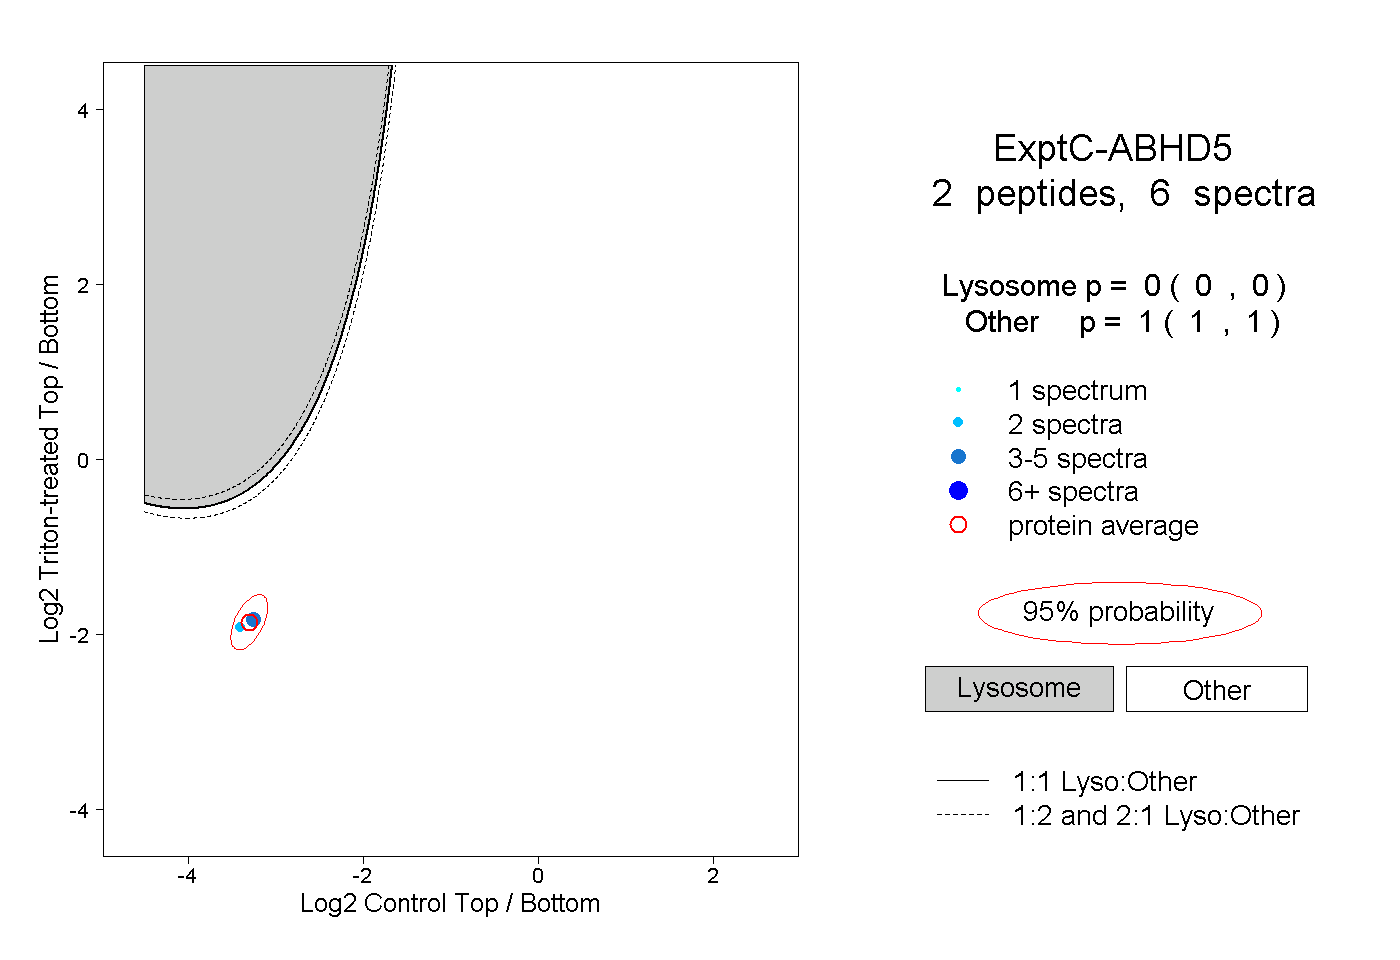 |
0.000 0.000 | 0.000 |
1.000 1.000 | 1.000 |