 4
4peptides
spectra
0.000 | 0.011
0.000 | 0.000
0.000 | 0.000
0.085 | 0.160
0.000 | 0.056
0.000 | 0.000
0.821 | 0.864
0.000 | 0.025
2peptides
spectra
NA | NA
NA | NA
NA | NA
NA | NA
NA | NA
NA | NA
NA | NA
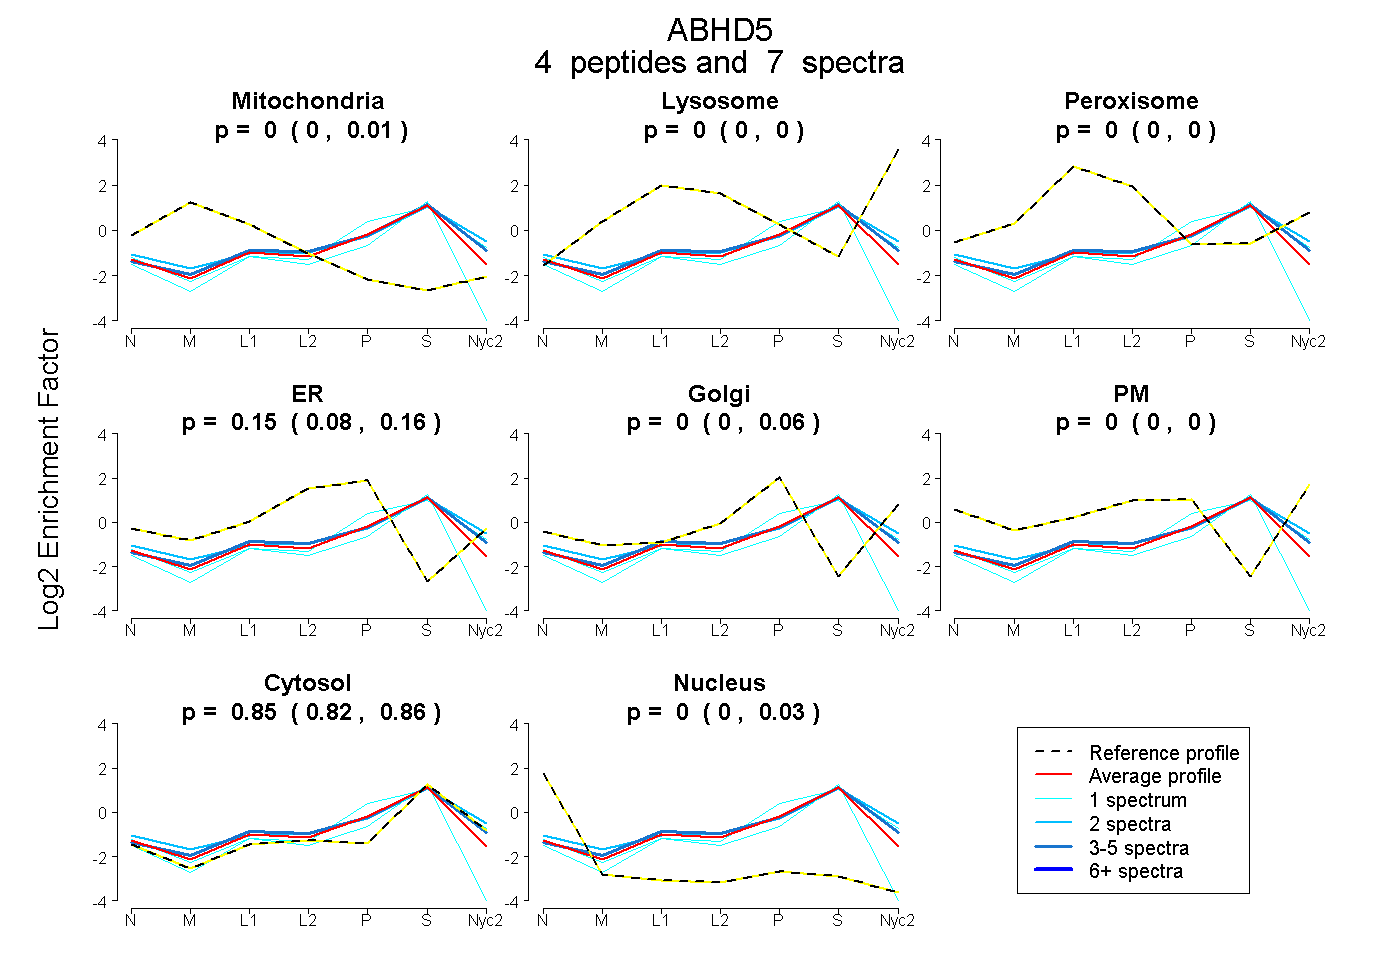
| Plot | Mito | Lyso | Perox | ER | Golgi | PM | Cytosol | Nucleus | |||||
| Expt A |
4 peptides |
7 spectra |
|
0.000 0.000 | 0.011 |
0.000 0.000 | 0.000 |
0.000 0.000 | 0.000 |
0.146 0.085 | 0.160 |
0.000 0.000 | 0.056 |
0.000 0.000 | 0.000 |
0.854 0.821 | 0.864 |
0.000 0.000 | 0.025 |
||
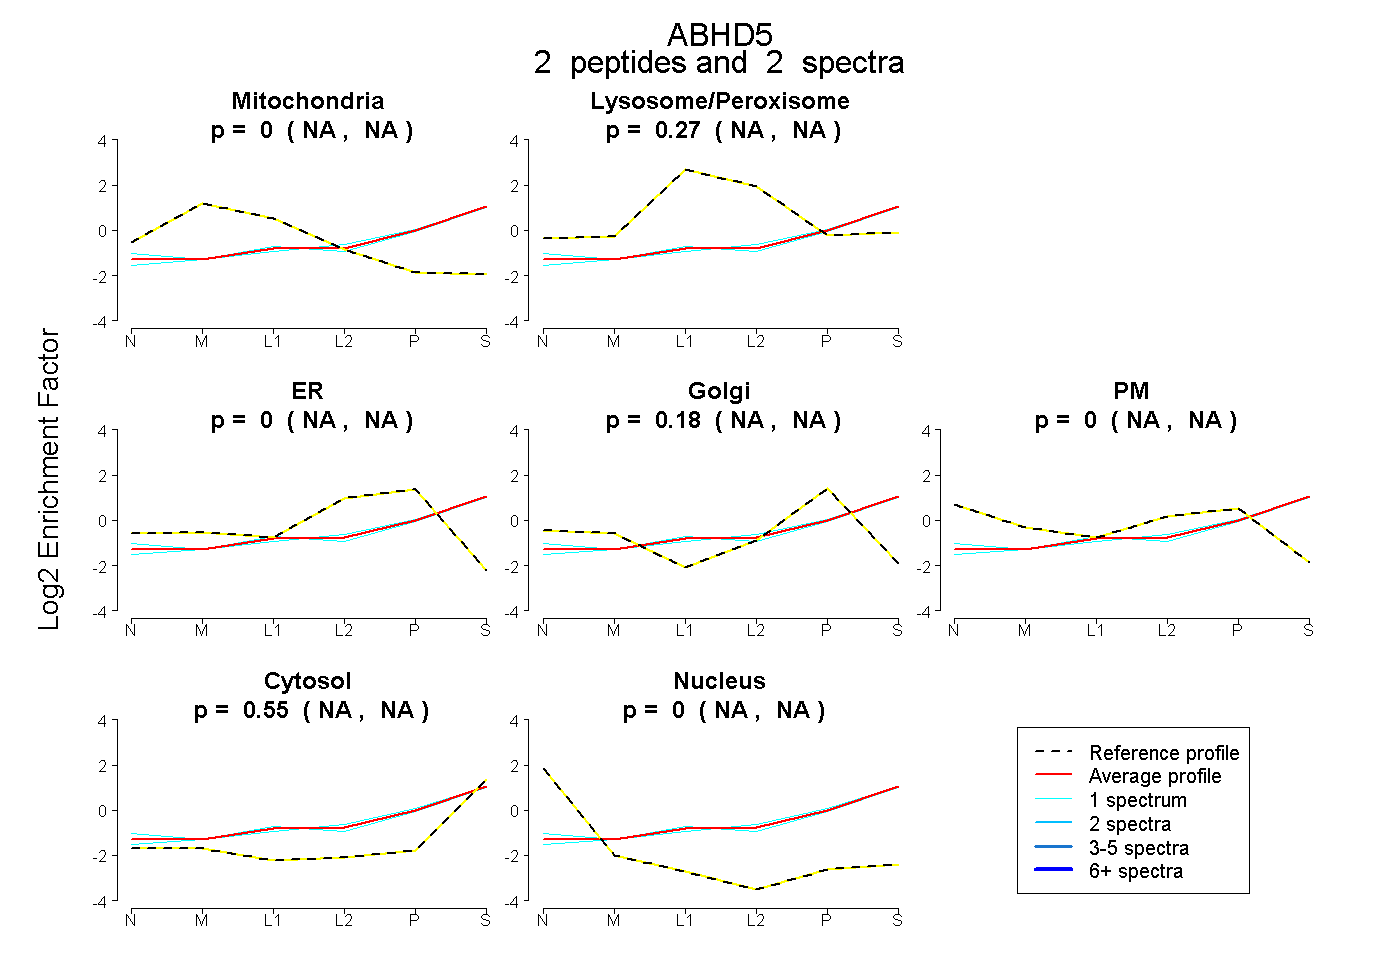
| Plot | Mito | Lyso or Perox | ER | Golgi | PM | Cytosol | Nucleus | ||||||
| Expt B |
2 peptides |
2 spectra |
|
0.000 NA | NA |
0.271 NA | NA |
0.000 NA | NA |
0.176 NA | NA |
0.000 NA | NA |
0.553 NA | NA |
0.000 NA | NA |
| 1 spectrum, IGGLHPDIPVSVIFGAR | 0.000 | 0.241 | 0.078 | 0.107 | 0.000 | 0.573 | 0.000 | |||
| 1 spectrum, LRPDFK | 0.000 | 0.274 | 0.000 | 0.177 | 0.000 | 0.549 | 0.000 |
| Plot | Lyso | Other | |||||||||||
| Expt C |
2 peptides |
6 spectra |
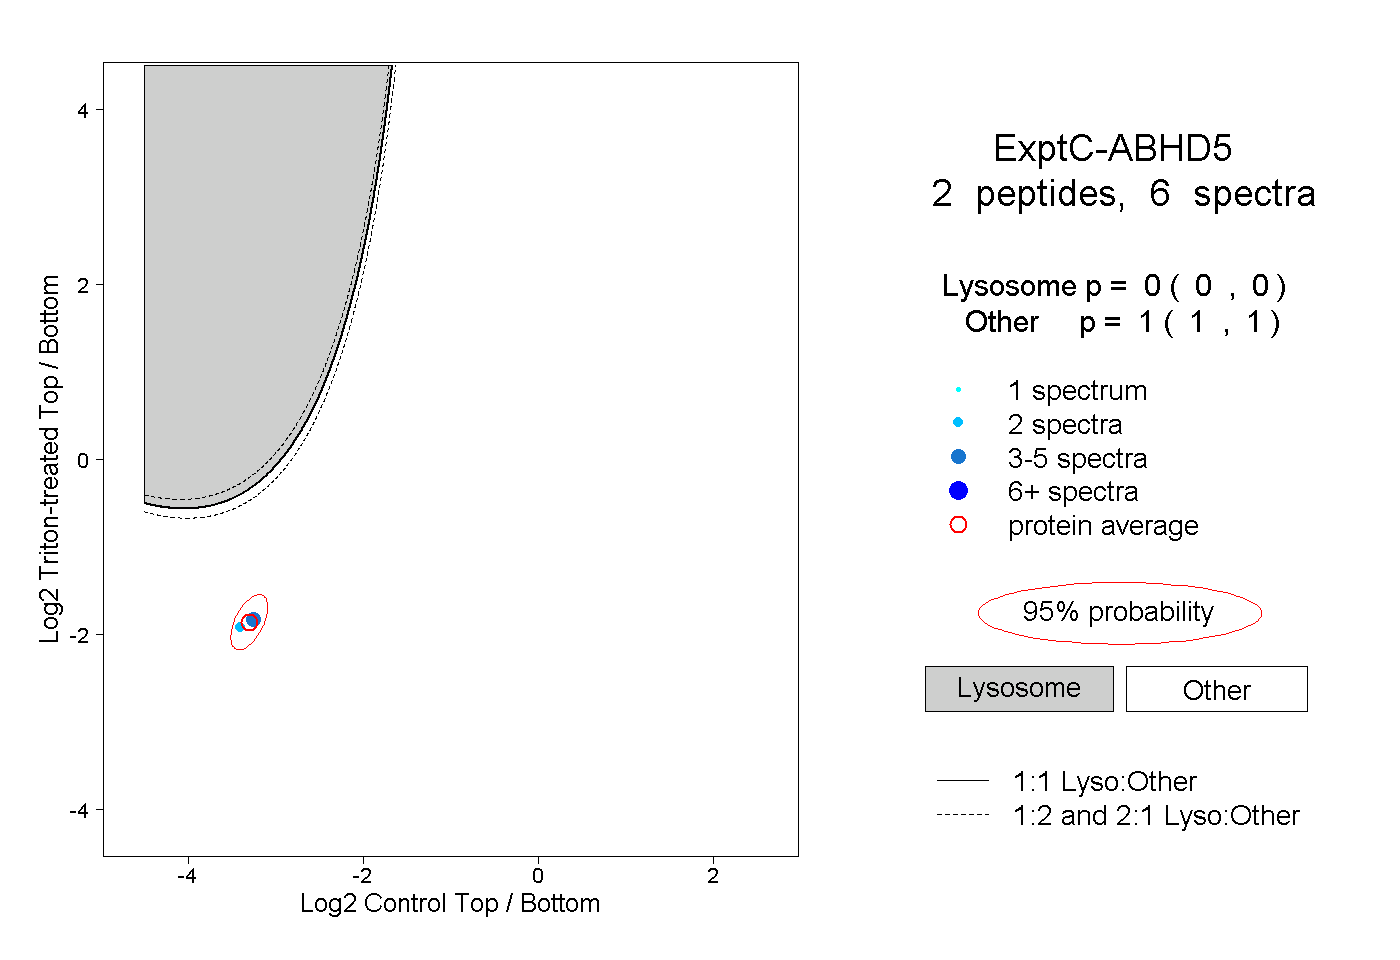 |
0.000 0.000 | 0.000 |
1.000 1.000 | 1.000 |