 25
25peptides
spectra
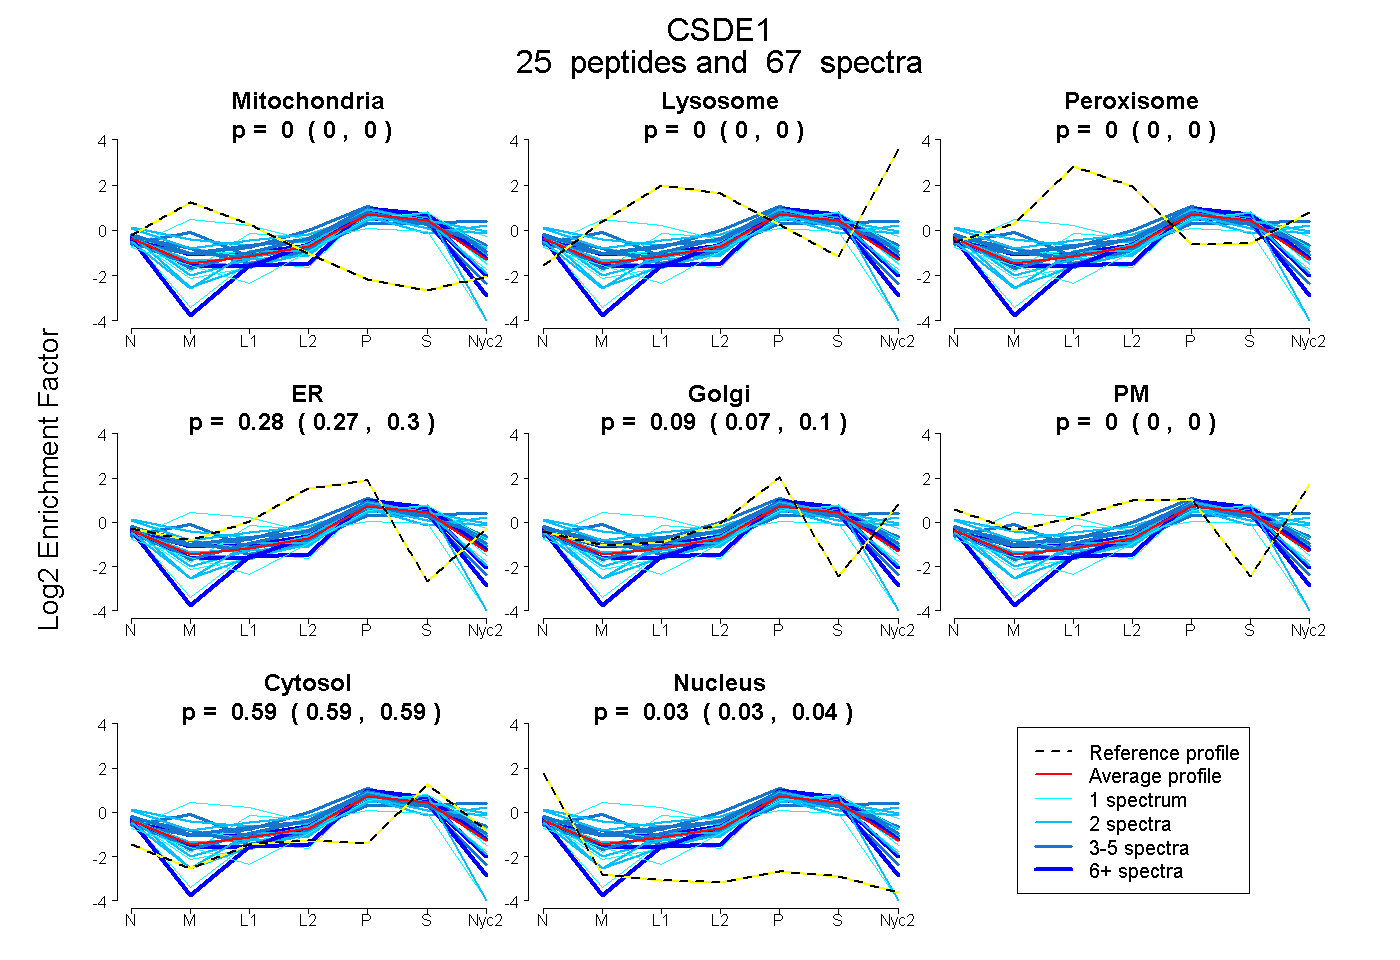
0.000 | 0.000
0.000 | 0.000
0.000 | 0.000
0.269 | 0.296
0.071 | 0.105
0.000 | 0.000
0.590 | 0.595
0.029 | 0.038
13peptides
spectra
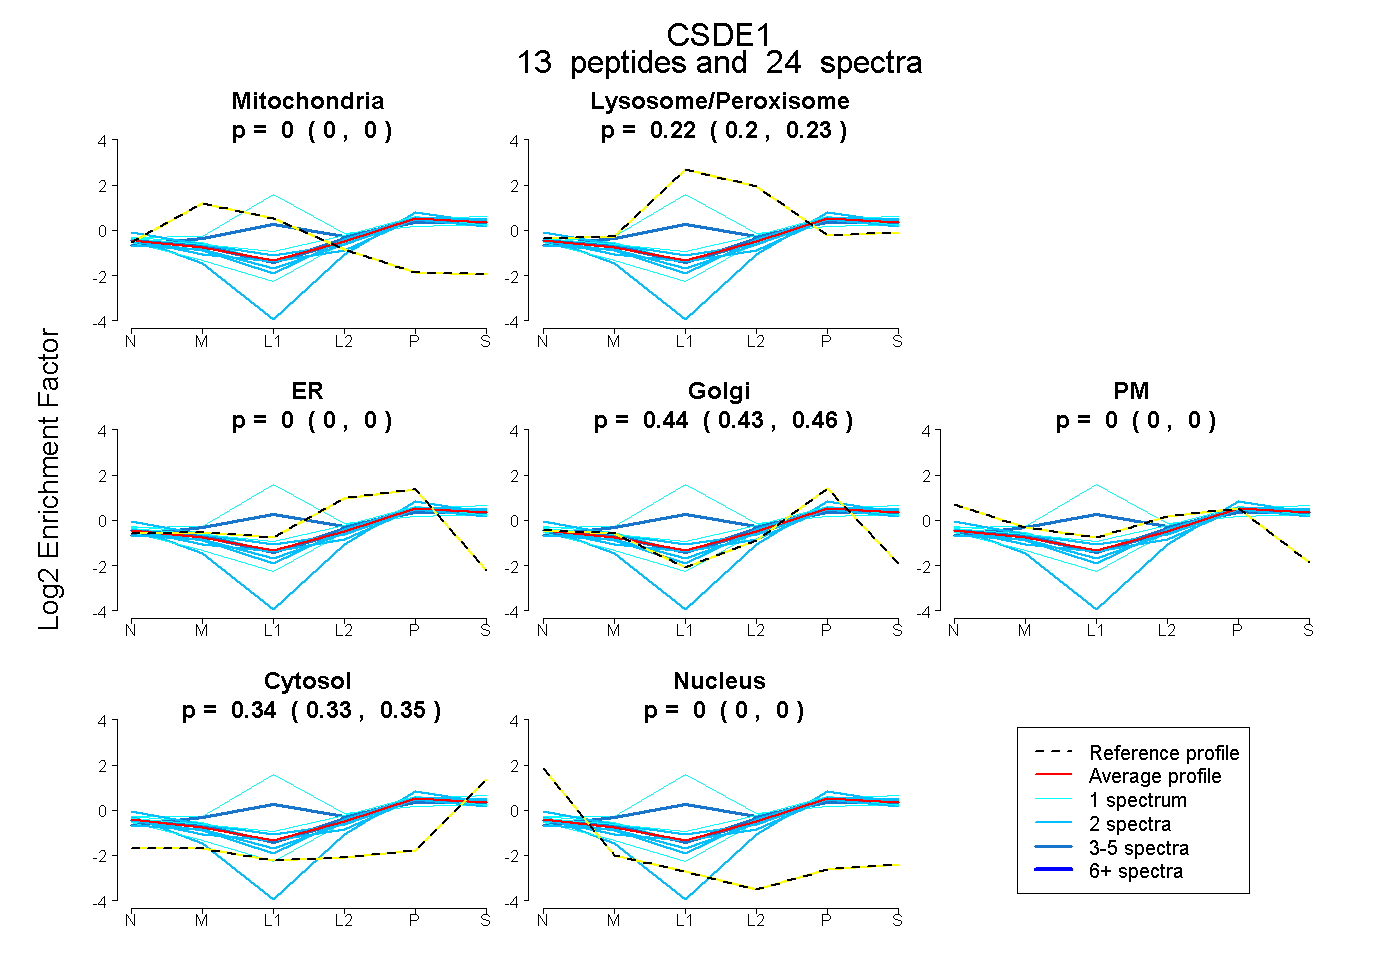
0.000 | 0.000
0.195 | 0.231
0.000 | 0.000
0.430 | 0.456
0.000 | 0.000
0.333 | 0.346
0.000 | 0.000
21peptides
spectra
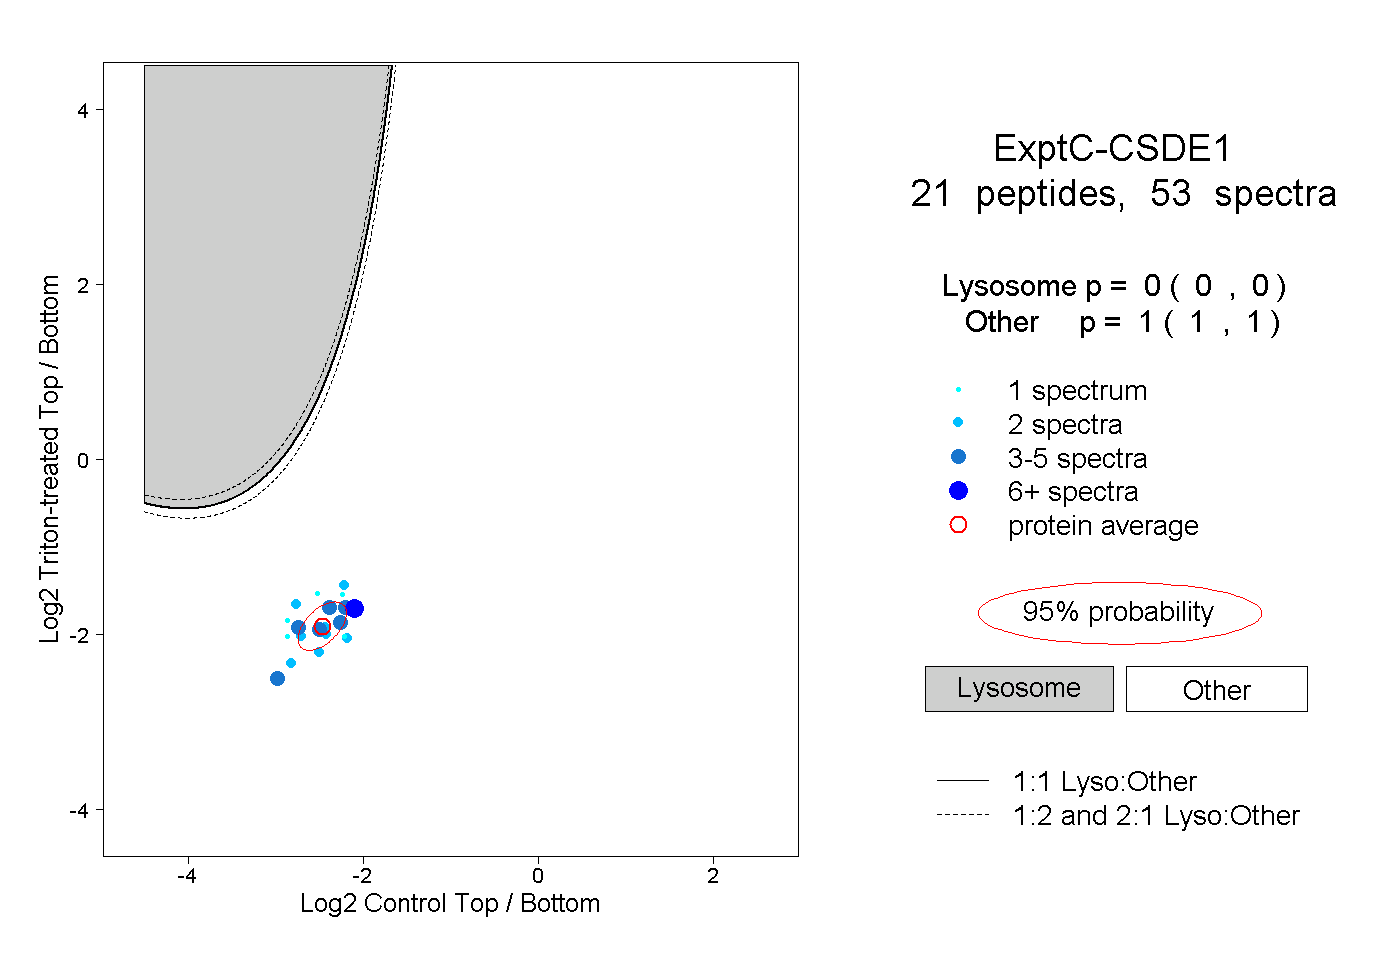
0.000 | 0.000
1.000 | 1.000
2peptides
spectra
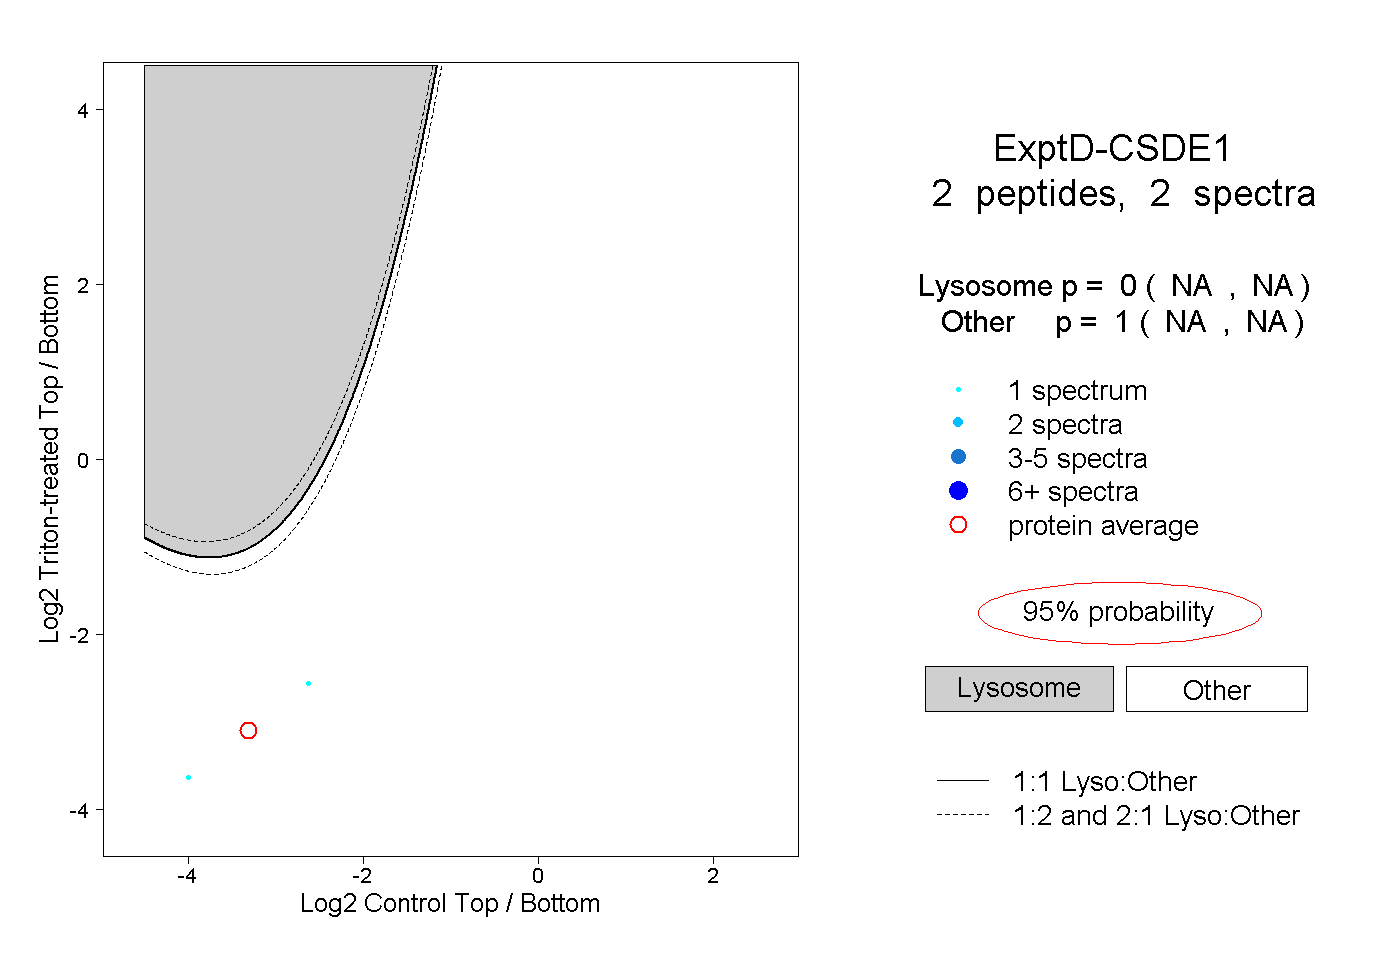
NA | NA
NA | NA