 10
10peptides
spectra
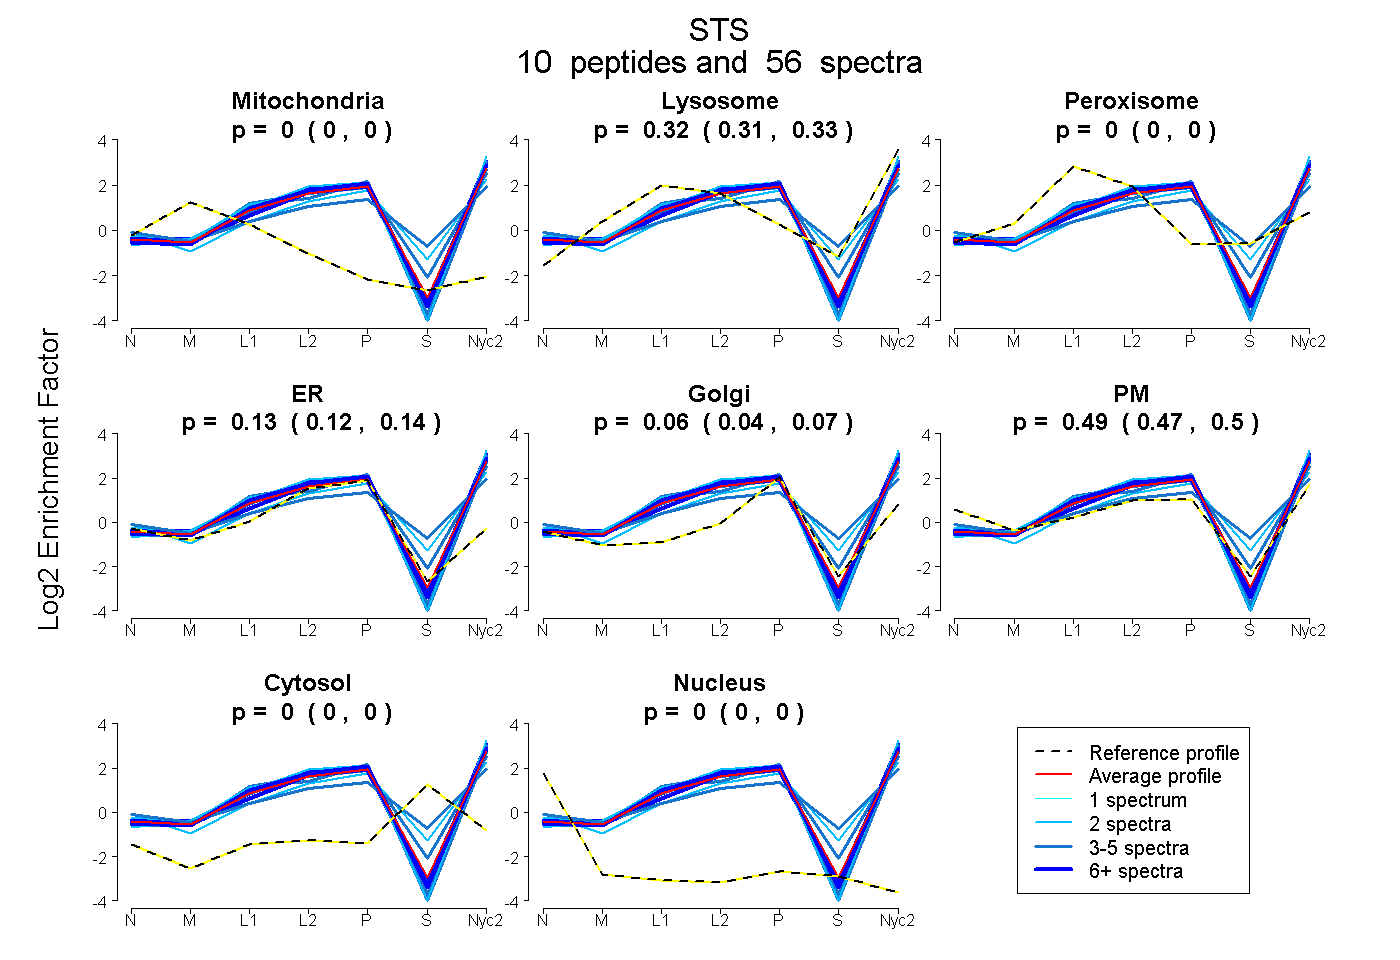
0.000 | 0.000
0.313 | 0.332
0.000 | 0.000
0.117 | 0.142
0.044 | 0.070
0.472 | 0.504
0.000 | 0.000
0.000 | 0.000
7peptides
spectra
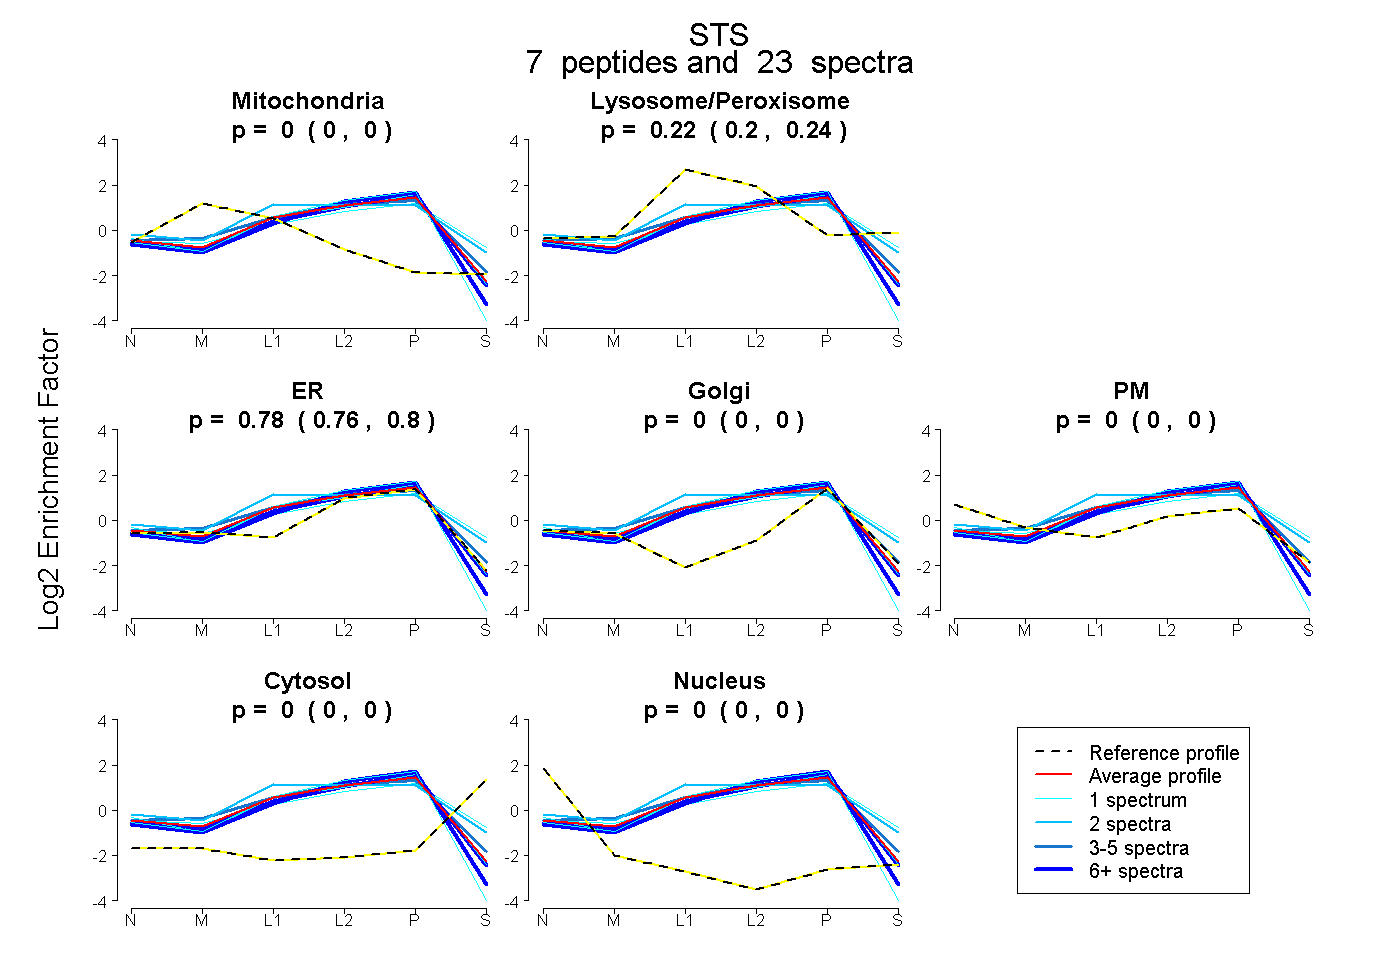
0.000 | 0.000
0.199 | 0.235
0.762 | 0.798
0.000 | 0.000
0.000 | 0.000
0.000 | 0.000
0.000 | 0.000
11peptides
spectra
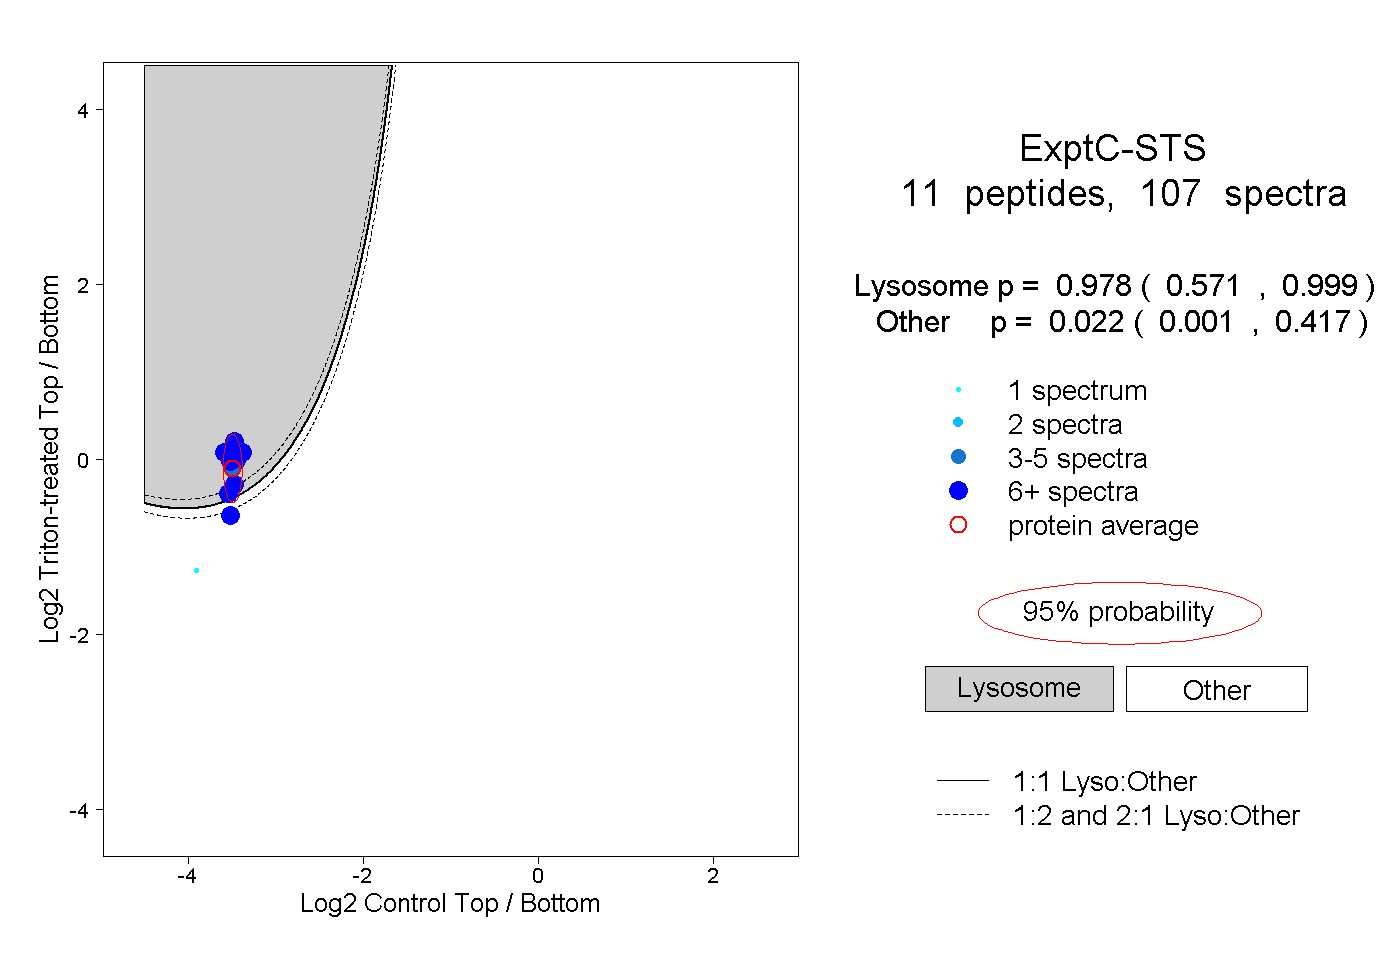
0.571 | 0.999
0.001 | 0.417
7peptides
spectra
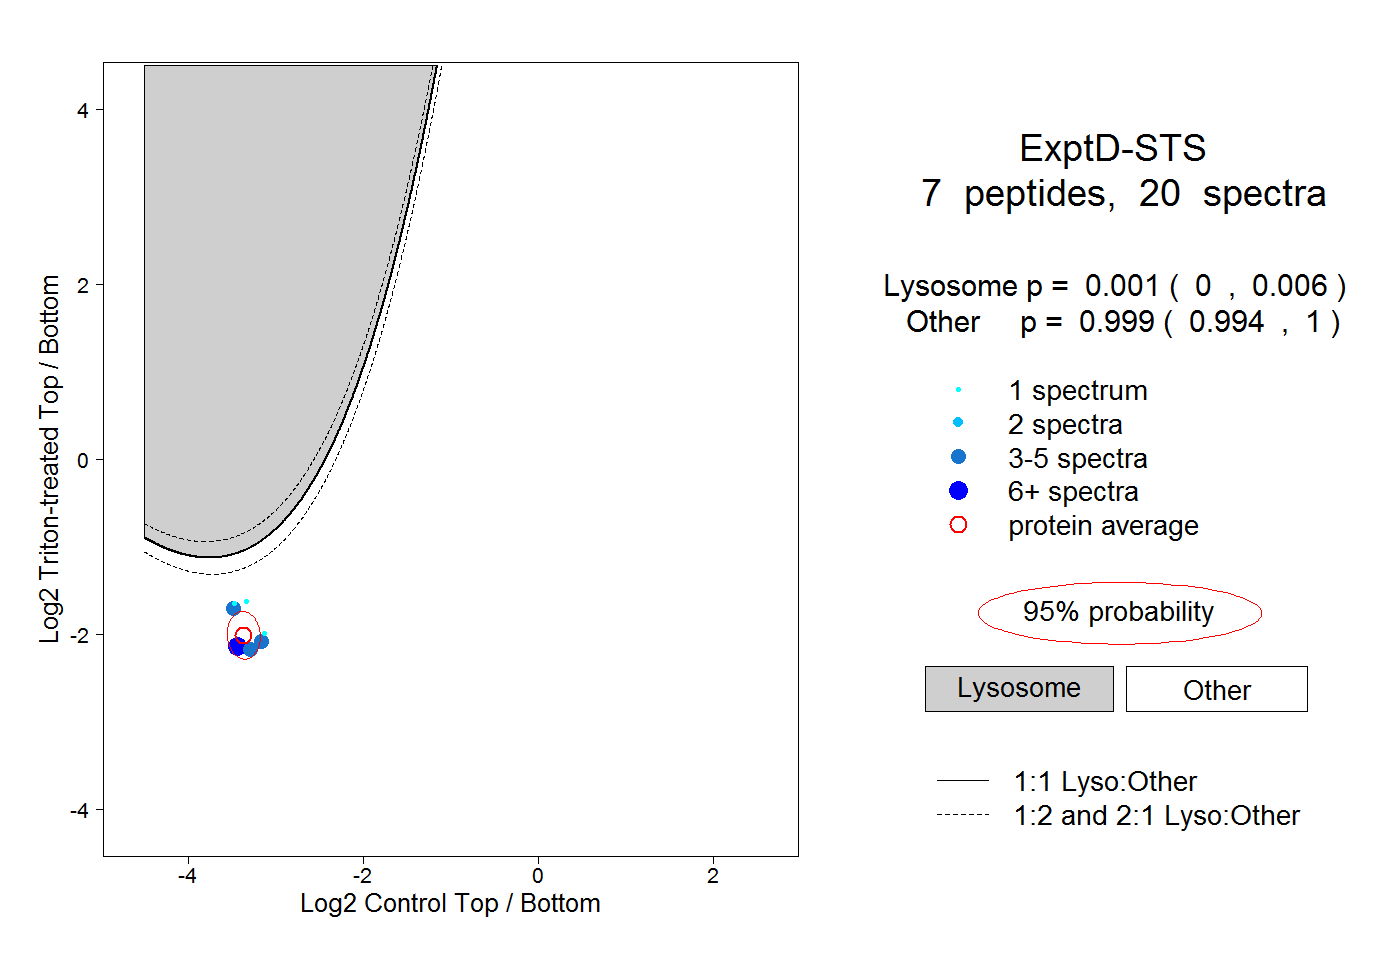
0.000 | 0.006
0.994 | 1.000