STS
[ENSRNOP00000043915]
Main page
| | | Plot |
Mito |
Lyso |
|
Perox |
ER |
Golgi |
PM |
Cytosol |
Nucleus |
|
| Expt A |
 10
10
peptides |
56
spectra |
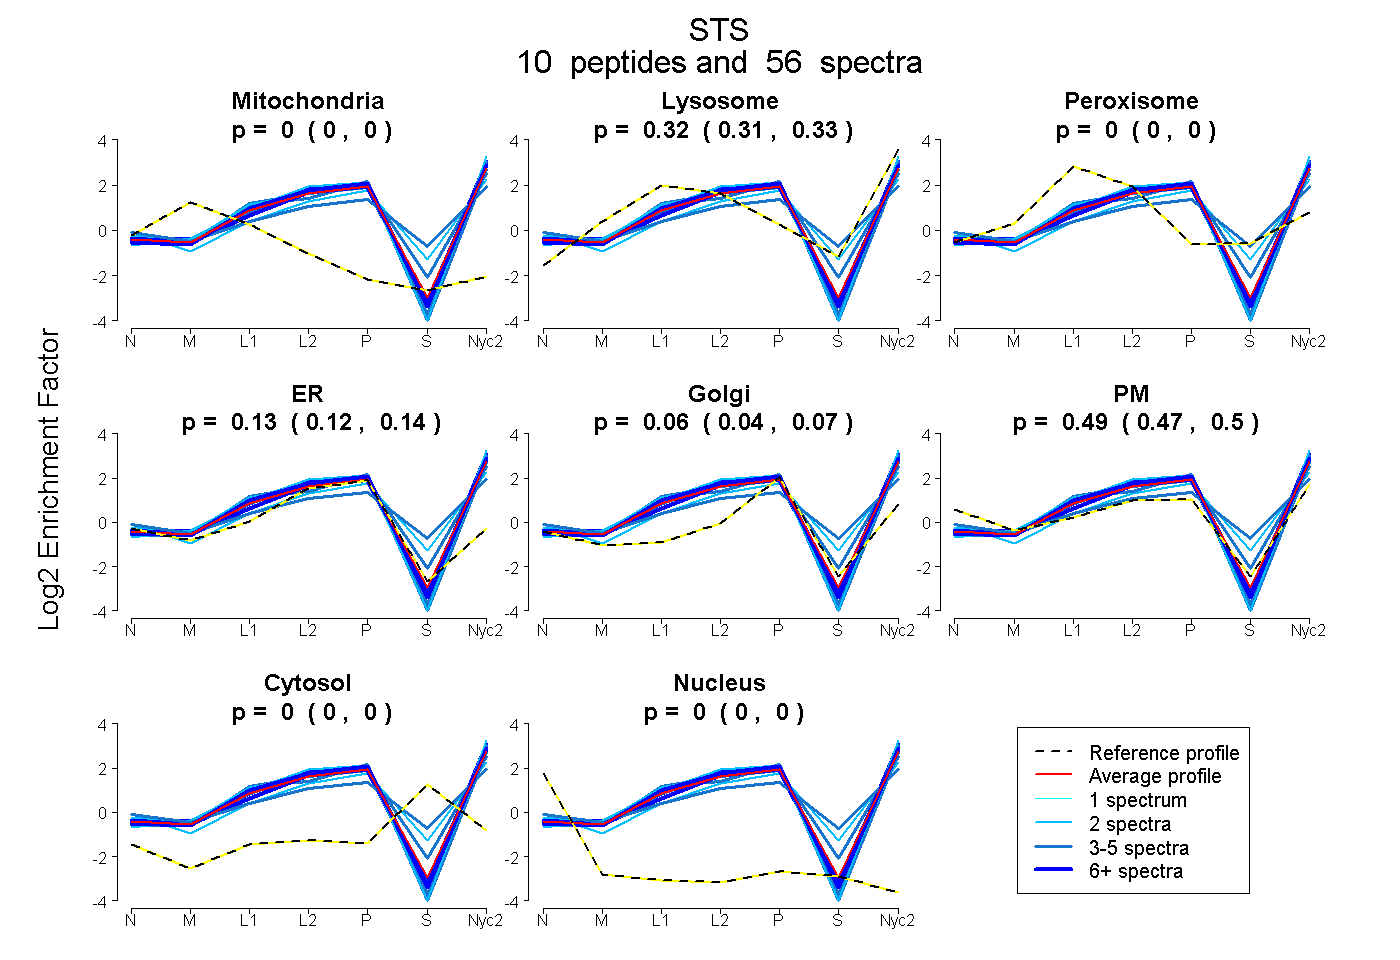 |
0.000
0.000 | 0.000 |
0.324
0.313 | 0.332 |
|
0.000
0.000 | 0.000 |
0.130
0.117 | 0.142 |
0.057
0.044 | 0.070 |
0.489
0.472 | 0.504 |
0.000
0.000 | 0.000 |
0.000
0.000 | 0.000 |
|
| | | Plot |
Mito |
|
Lyso or Perox |
|
ER |
Golgi |
PM |
Cytosol |
Nucleus |
|
| Expt B |
7
peptides |
23
spectra |
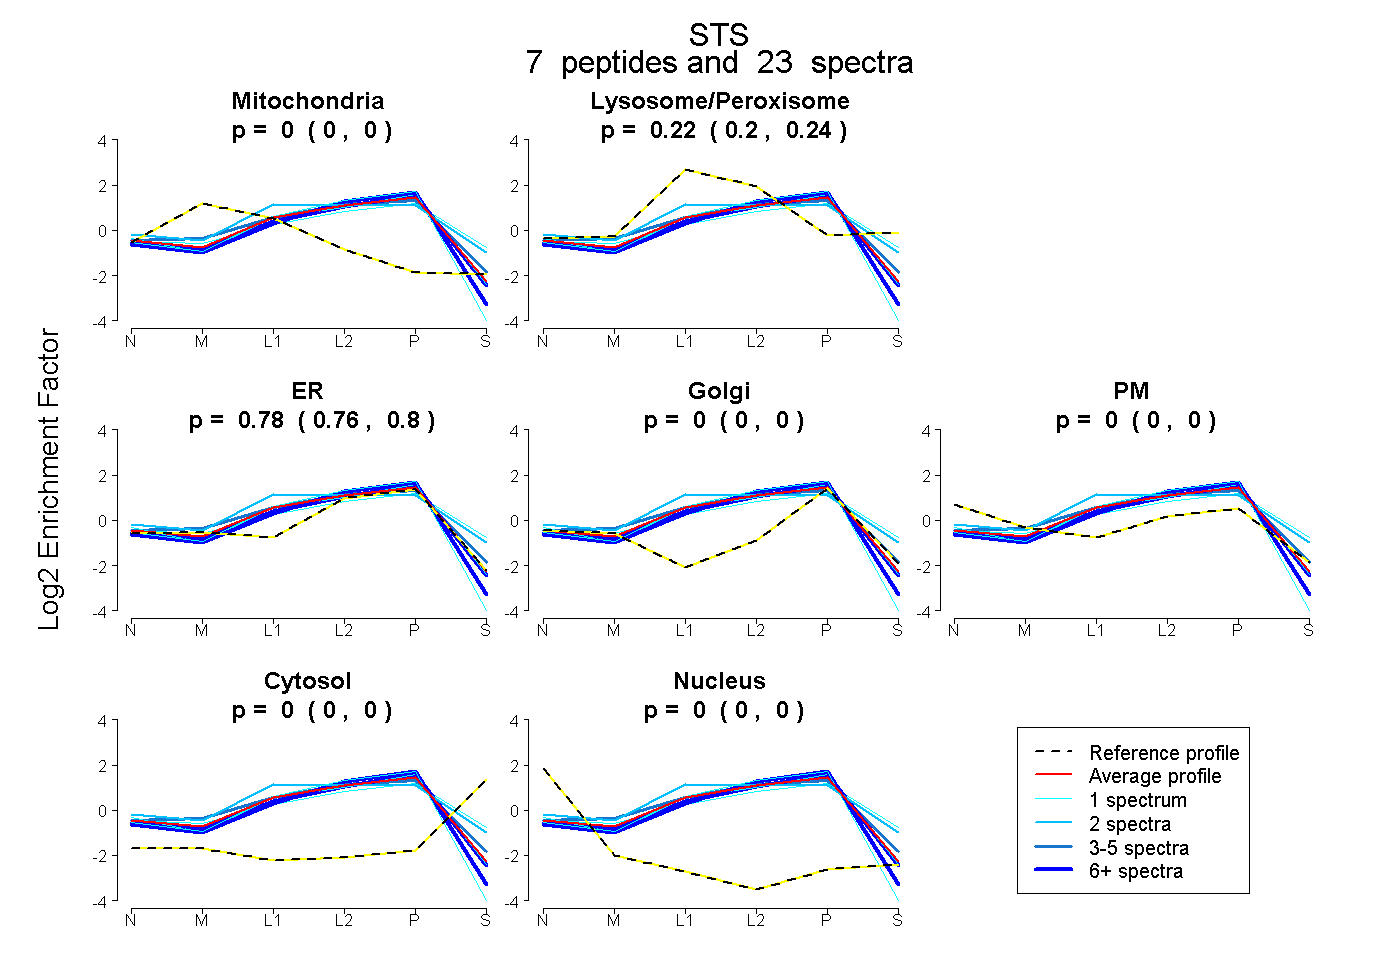 |
0.000
0.000 | 0.000 |
|
0.218
0.199 | 0.235 |
|
0.782
0.762 | 0.798 |
0.000
0.000 | 0.000 |
0.000
0.000 | 0.000 |
0.000
0.000 | 0.000 |
0.000
0.000 | 0.000 |
|
| 1 spectrum, VPGIVR |
0.000 |
|
0.038 |
|
0.962 |
0.000 |
0.000 |
0.000 |
0.000 |
|
| 2 spectra, TPHIDR |
0.000 |
|
0.533 |
|
0.326 |
0.141 |
0.000 |
0.000 |
0.000 |
|
| 8 spectra, LAGAELPTDR |
0.000 |
|
0.161 |
|
0.839 |
0.000 |
0.000 |
0.000 |
0.000 |
|
| 3 spectra, FLGTPTTNLR |
0.000 |
|
0.283 |
|
0.717 |
0.000 |
0.000 |
0.000 |
0.000 |
|
| 7 spectra, LASEAGDFLR |
0.000 |
|
0.051 |
|
0.949 |
0.000 |
0.000 |
0.000 |
0.000 |
|
| 1 spectrum, LALEGVK |
0.000 |
|
0.195 |
|
0.805 |
0.000 |
0.000 |
0.000 |
0.000 |
|
| 1 spectrum, HPLTPETEPR |
0.000 |
|
0.439 |
|
0.196 |
0.365 |
0.000 |
0.000 |
0.000 |
|
| | | Plot |
|
Lyso |
|
|
|
|
|
|
|
Other |
| Expt C |
11
peptides |
107
spectra |
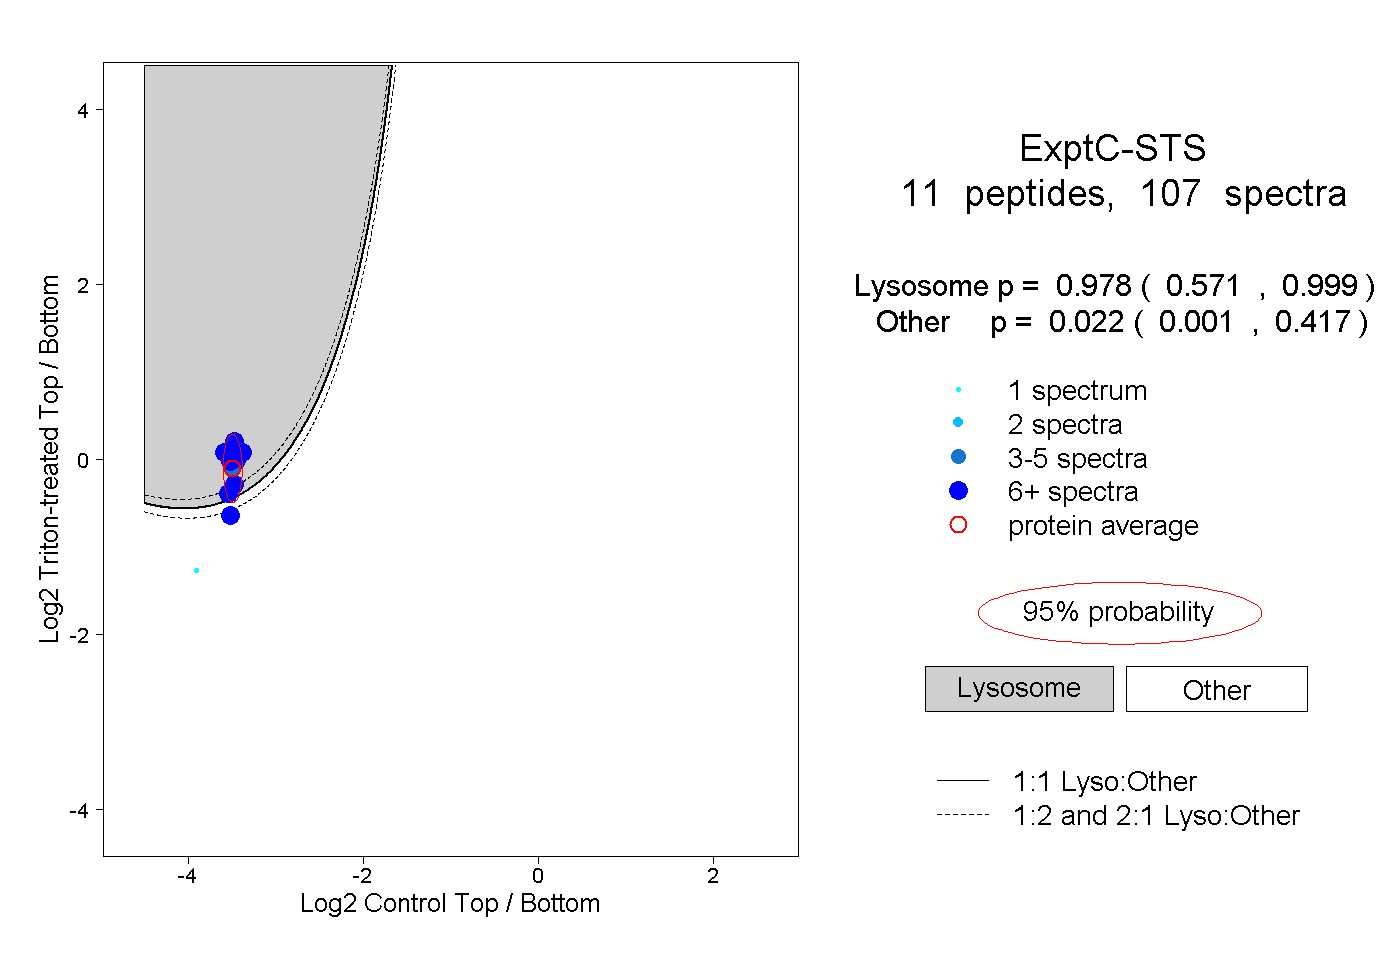 |
|
0.978
0.571 | 0.999 |
|
|
|
|
|
|
|
0.022
0.001 | 0.417 |
| | | Plot |
|
Lyso |
|
|
|
|
|
|
|
Other |
| Expt D |
7
peptides |
20
spectra |
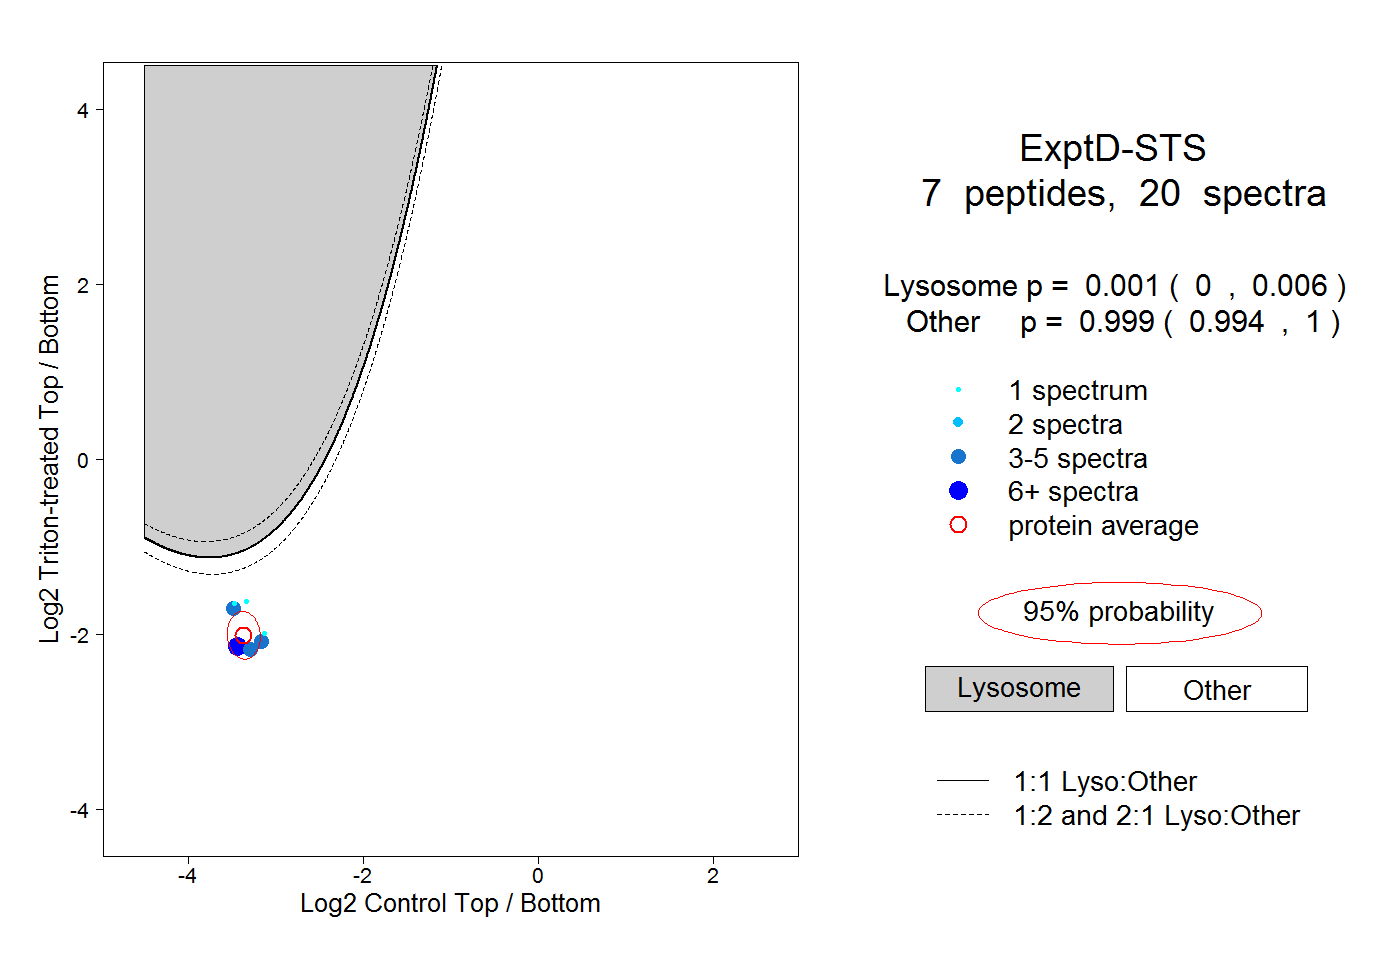 |
|
0.001
0.000 | 0.006 |
|
|
|
|
|
|
|
0.999
0.994 | 1.000 |