 10
10peptides
spectra
0.000 | 0.000
0.313 | 0.332
0.000 | 0.000
0.117 | 0.142
0.044 | 0.070
0.472 | 0.504
0.000 | 0.000
0.000 | 0.000
| Plot | Mito | Lyso | Perox | ER | Golgi | PM | Cytosol | Nucleus | |||||
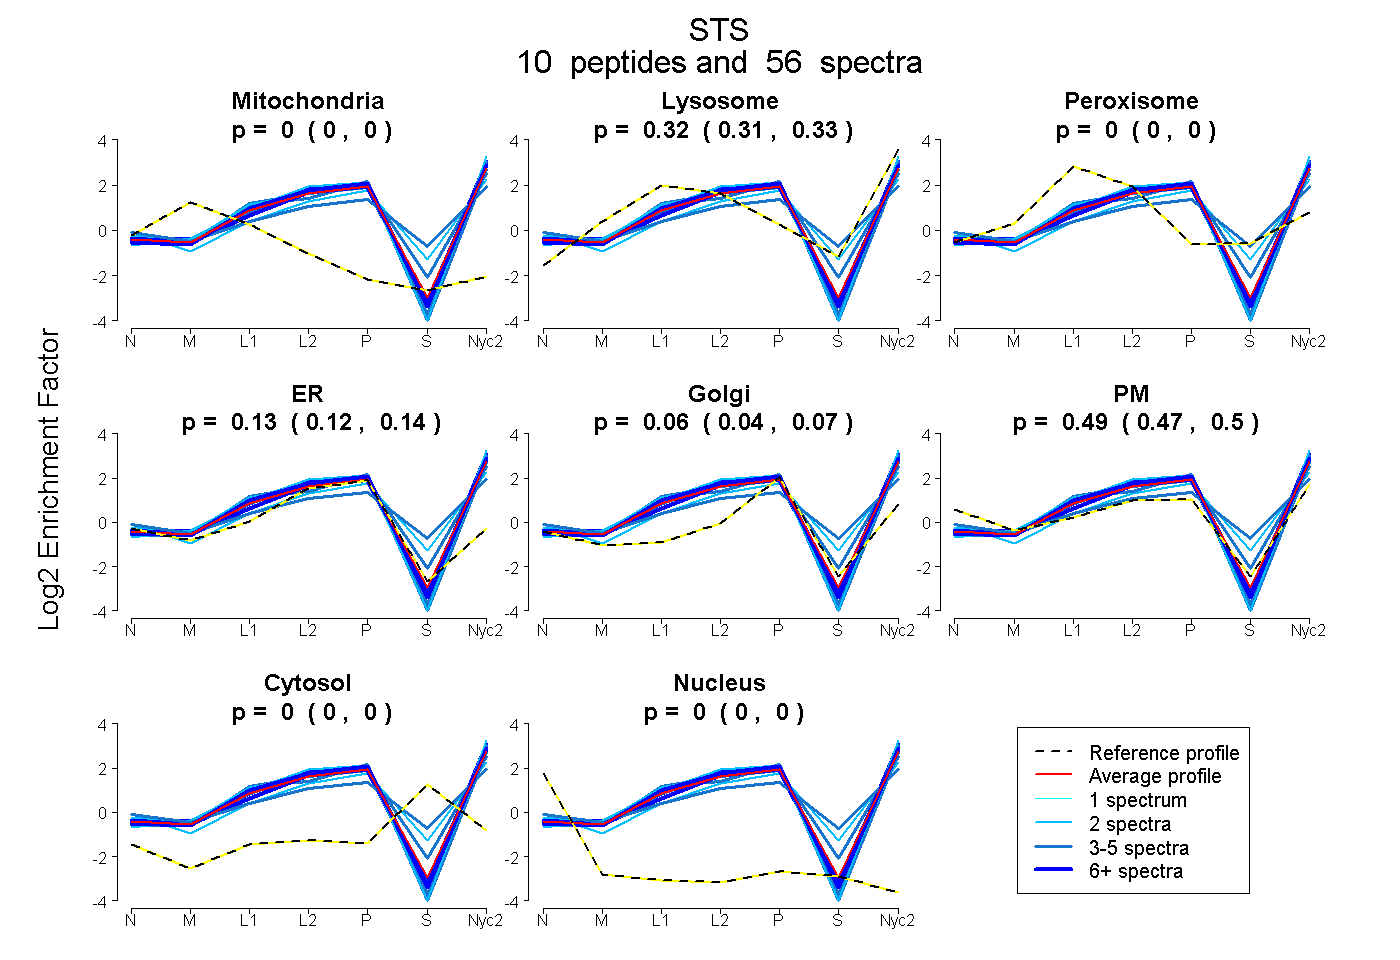
| Expt A |
10 peptides |
56 spectra |
|
0.000 0.000 | 0.000 |
0.324 0.313 | 0.332 |
0.000 0.000 | 0.000 |
0.130 0.117 | 0.142 |
0.057 0.044 | 0.070 |
0.489 0.472 | 0.504 |
0.000 0.000 | 0.000 |
0.000 0.000 | 0.000 |
| 10 spectra, VPGIVR | 0.000 | 0.330 | 0.000 | 0.182 | 0.003 | 0.486 | 0.000 | 0.000 | ||
| 3 spectra, TPHIDR | 0.000 | 0.323 | 0.016 | 0.010 | 0.159 | 0.382 | 0.110 | 0.000 | ||
| 4 spectra, LAGAELPTDR | 0.000 | 0.285 | 0.000 | 0.109 | 0.038 | 0.568 | 0.000 | 0.000 | ||
| 3 spectra, GQGYTTGLVGK | 0.000 | 0.273 | 0.000 | 0.186 | 0.054 | 0.487 | 0.000 | 0.000 | ||
| 14 spectra, FLGTPTTNLR | 0.000 | 0.326 | 0.000 | 0.083 | 0.000 | 0.591 | 0.000 | 0.000 | ||
| 2 spectra, ANTWEGGIR | 0.000 | 0.320 | 0.000 | 0.028 | 0.302 | 0.343 | 0.007 | 0.000 | ||
| 12 spectra, NMDAAAR | 0.000 | 0.286 | 0.000 | 0.079 | 0.073 | 0.562 | 0.000 | 0.000 | ||
| 2 spectra, LASEAGDFLR | 0.000 | 0.348 | 0.000 | 0.118 | 0.000 | 0.535 | 0.000 | 0.000 | ||
| 4 spectra, AAFLTGR | 0.000 | 0.429 | 0.000 | 0.222 | 0.032 | 0.317 | 0.000 | 0.000 | ||
| 2 spectra, HPLTPETEPR | 0.000 | 0.253 | 0.000 | 0.099 | 0.000 | 0.648 | 0.000 | 0.000 |
| Plot | Mito | Lyso or Perox | ER | Golgi | PM | Cytosol | Nucleus | ||||||
| Expt B |
7 peptides |
23 spectra |
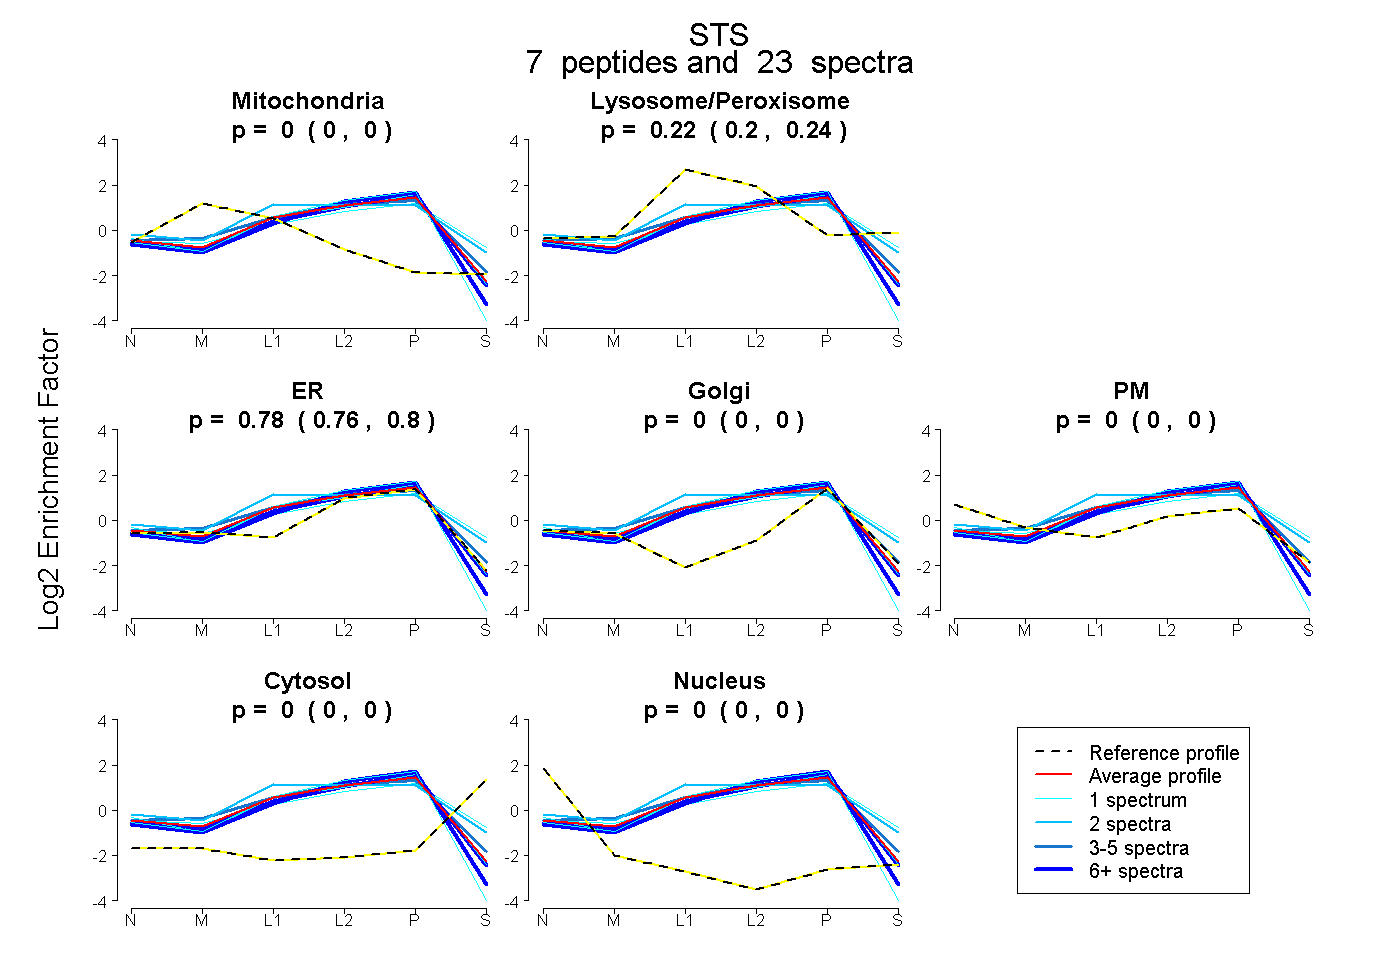 |
0.000 0.000 | 0.000 |
0.218 0.199 | 0.235 |
0.782 0.762 | 0.798 |
0.000 0.000 | 0.000 |
0.000 0.000 | 0.000 |
0.000 0.000 | 0.000 |
0.000 0.000 | 0.000 |
|||
| Plot | Lyso | Other | |||||||||||
| Expt C |
11 peptides |
107 spectra |
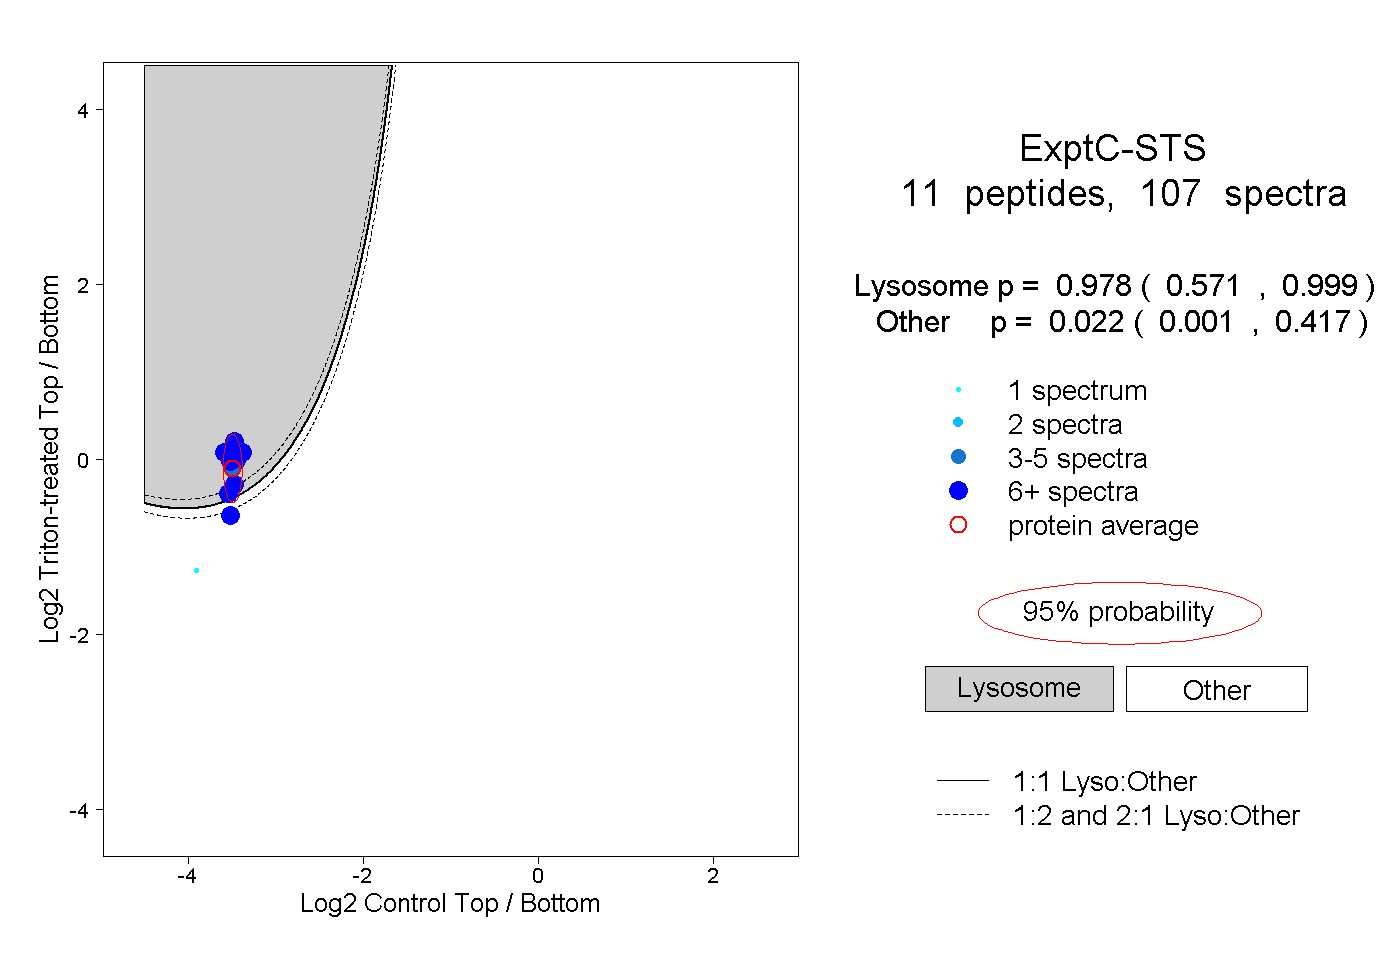 |
0.978 0.571 | 0.999 |
0.022 0.001 | 0.417 |
||||||||
| Plot | Lyso | Other | |||||||||||
| Expt D |
7 peptides |
20 spectra |
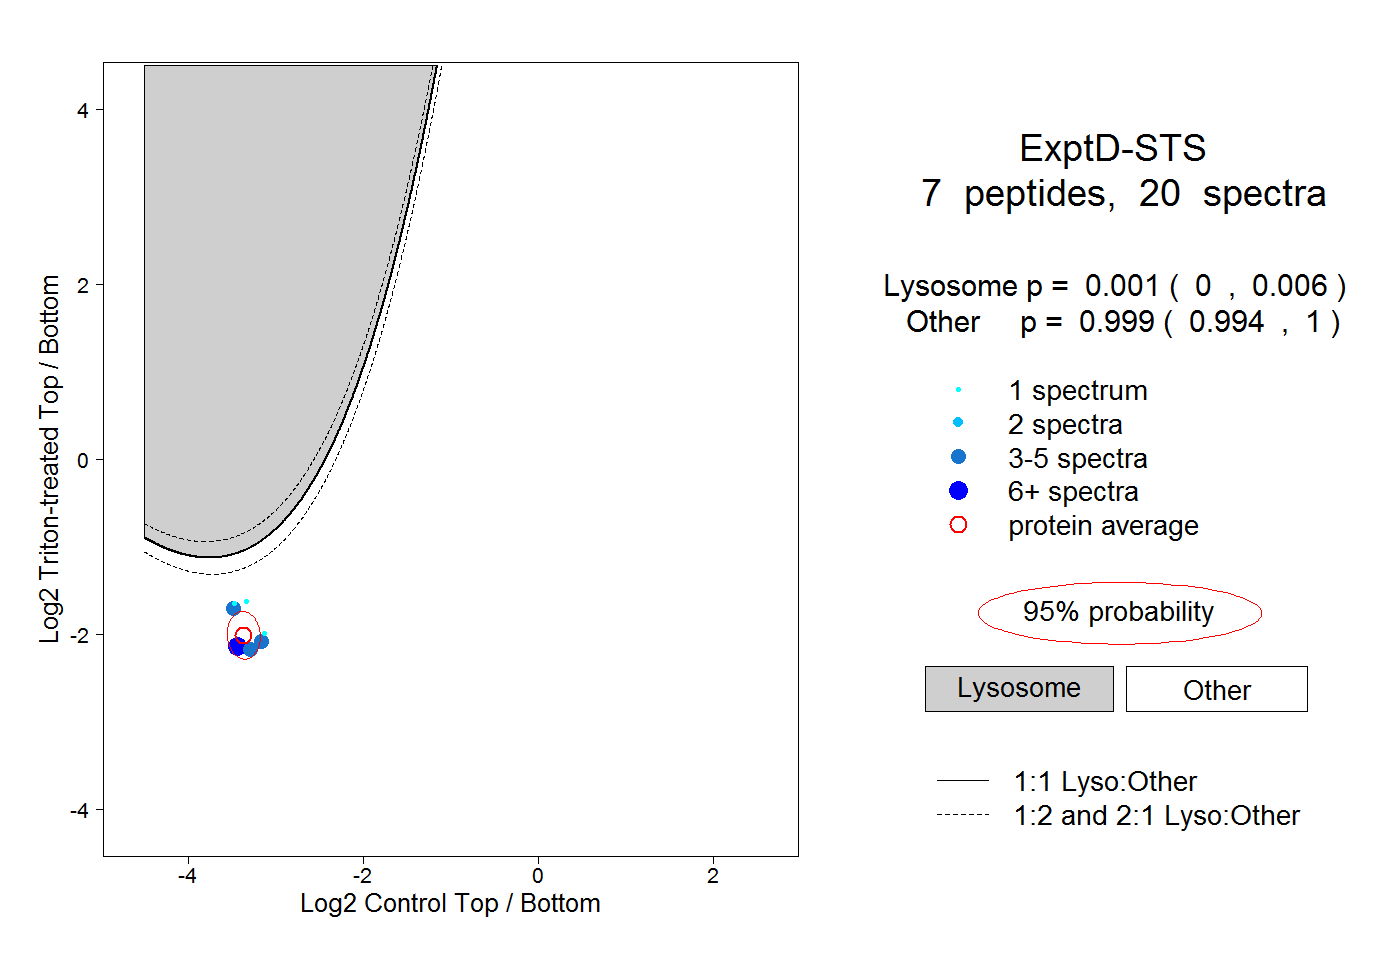 |
0.001 0.000 | 0.006 |
0.999 0.994 | 1.000 |