STS
[ENSRNOP00000043915]
Main page
| | | Plot |
Mito |
Lyso |
|
Perox |
ER |
Golgi |
PM |
Cytosol |
Nucleus |
|
| Expt A |
 10
10
peptides |
56
spectra |
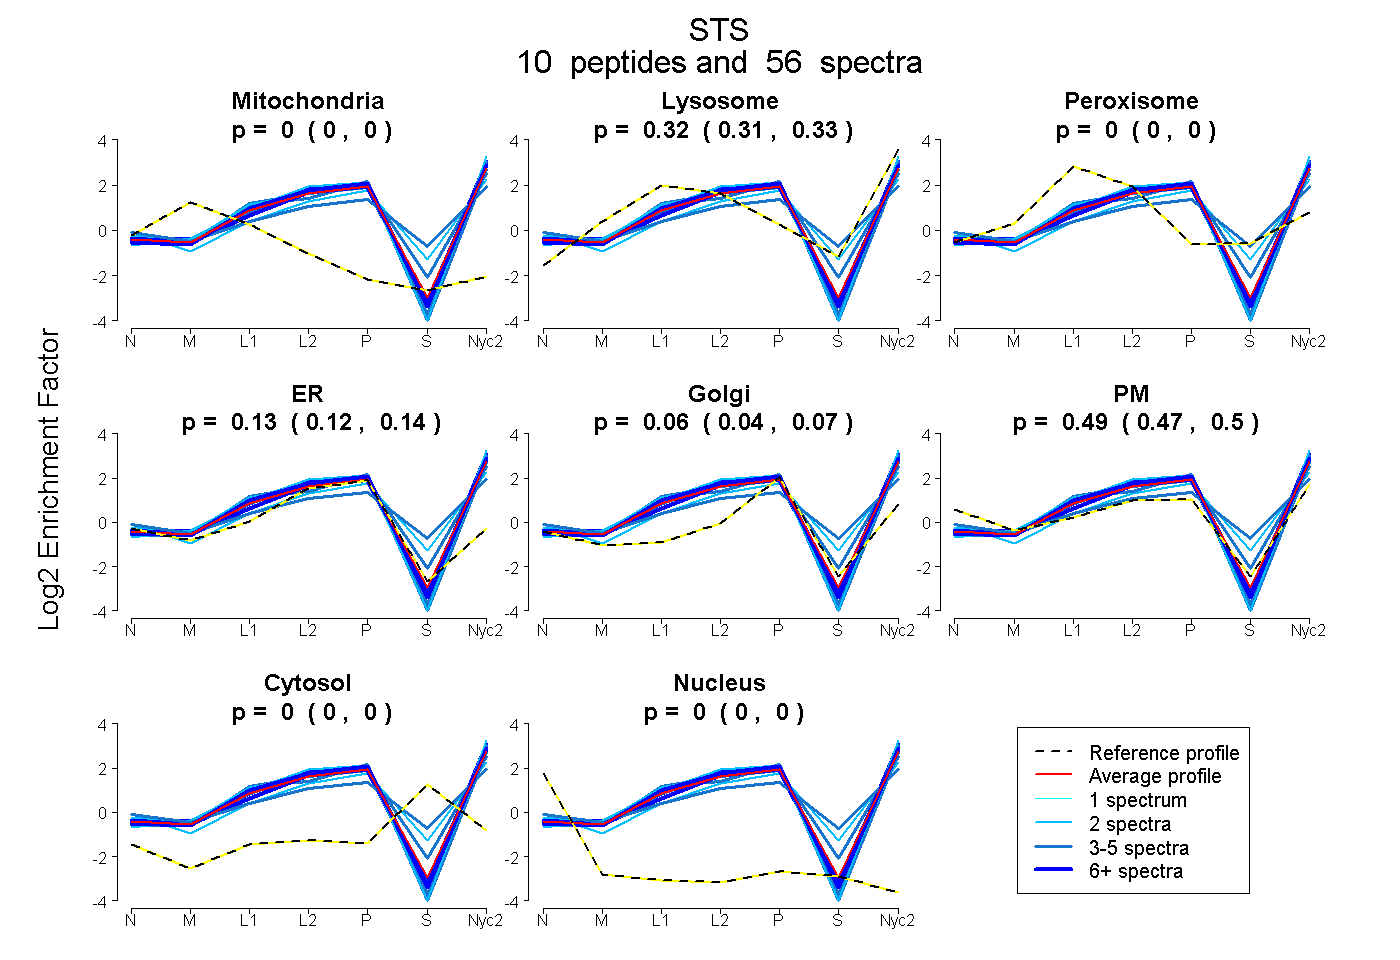 |
0.000
0.000 | 0.000 |
0.324
0.313 | 0.332 |
|
0.000
0.000 | 0.000 |
0.130
0.117 | 0.142 |
0.057
0.044 | 0.070 |
0.489
0.472 | 0.504 |
0.000
0.000 | 0.000 |
0.000
0.000 | 0.000 |
|
| | | Plot |
Mito |
|
Lyso or Perox |
|
ER |
Golgi |
PM |
Cytosol |
Nucleus |
|
| Expt B |
7
peptides |
23
spectra |
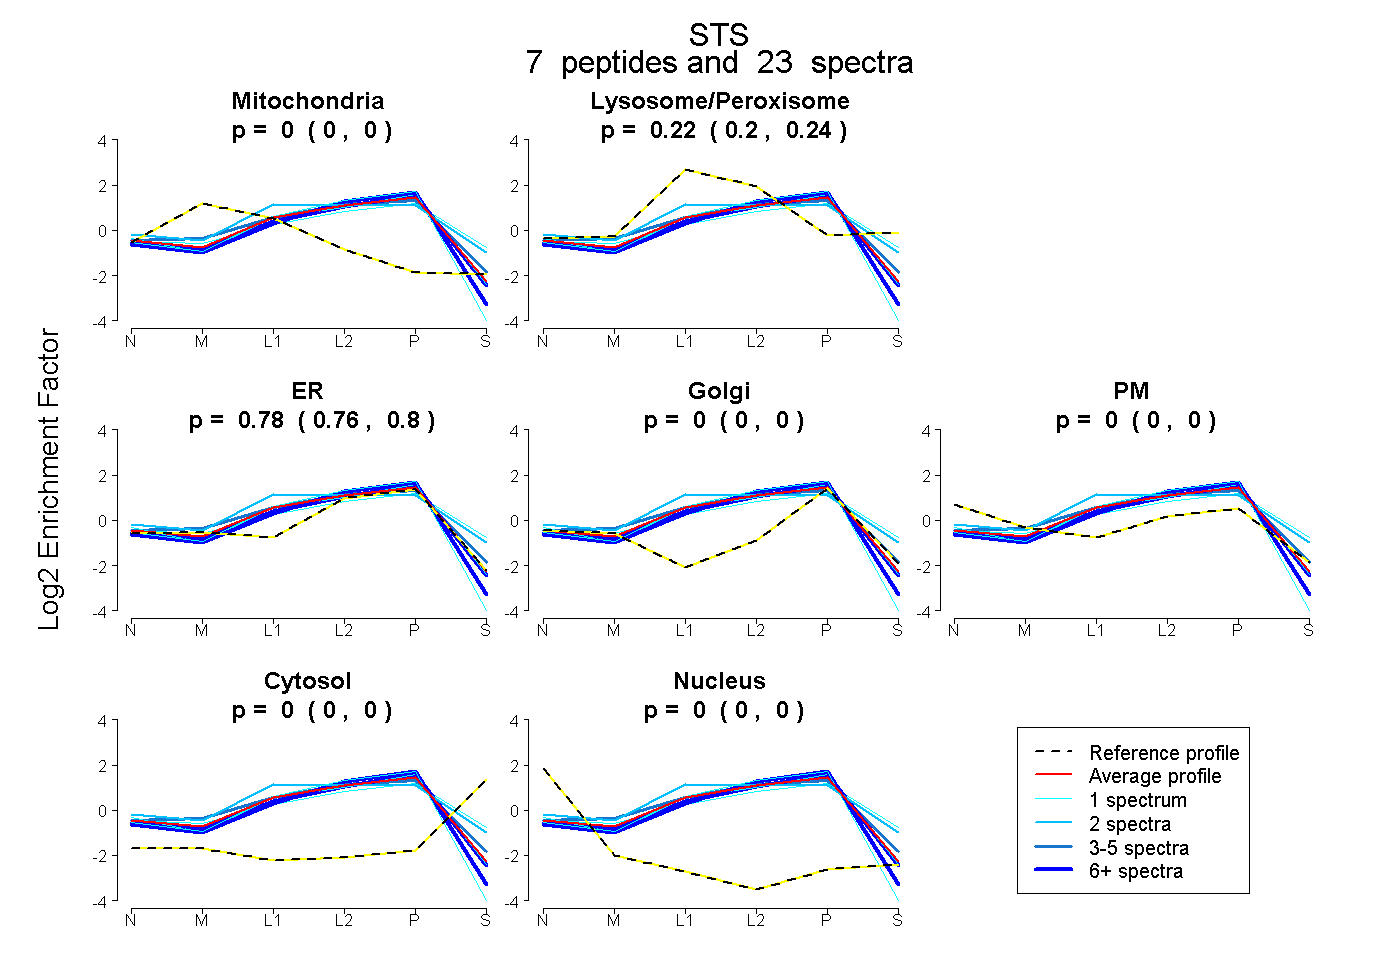 |
0.000
0.000 | 0.000 |
|
0.218
0.199 | 0.235 |
|
0.782
0.762 | 0.798 |
0.000
0.000 | 0.000 |
0.000
0.000 | 0.000 |
0.000
0.000 | 0.000 |
0.000
0.000 | 0.000 |
|
| | | Plot |
|
Lyso |
|
|
|
|
|
|
|
Other |
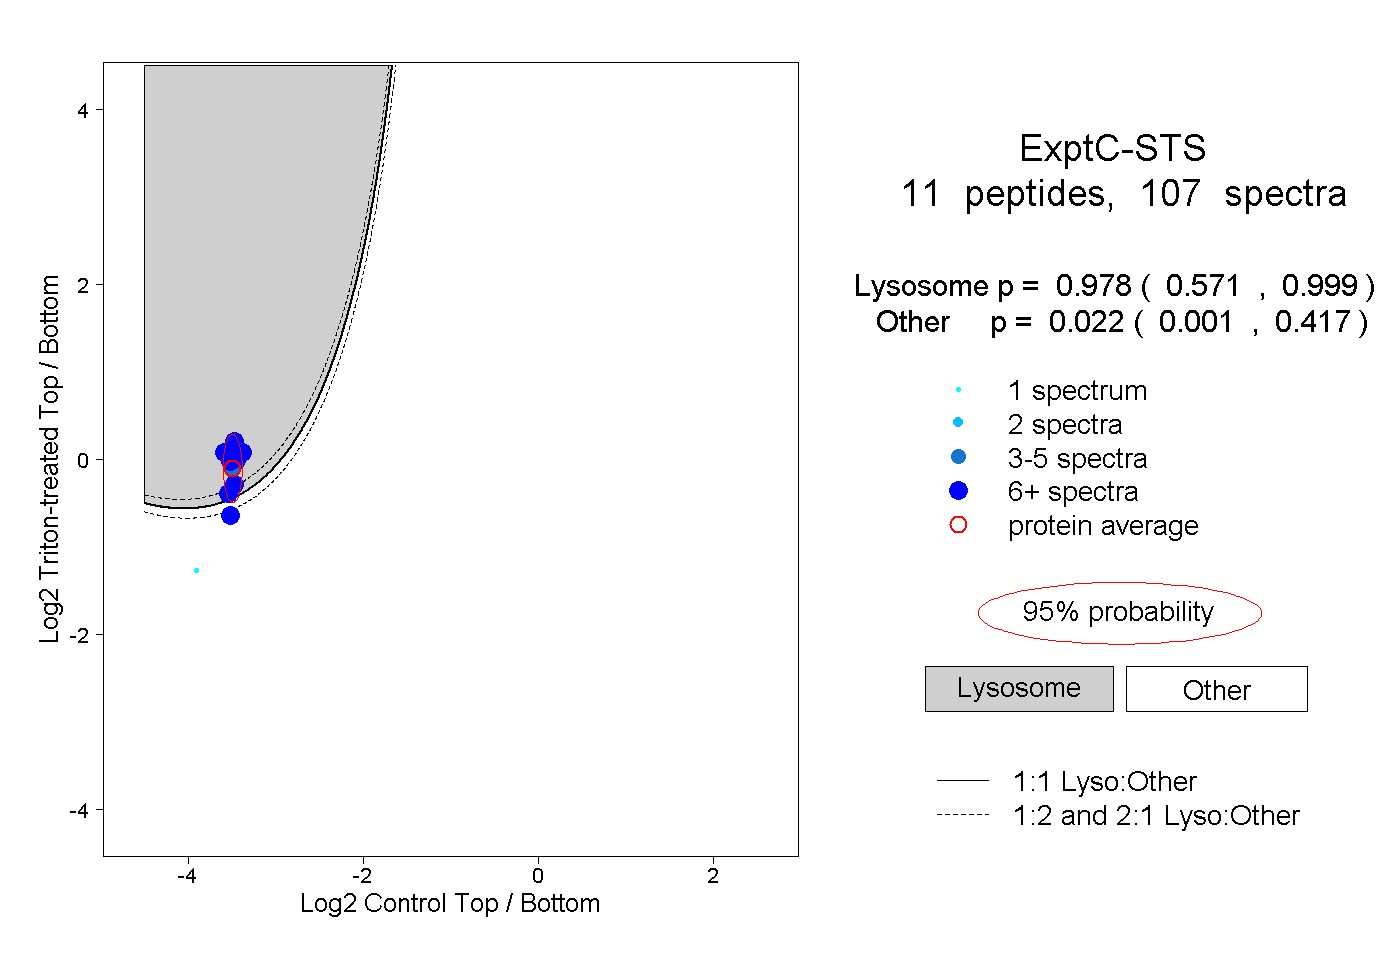
| Expt C |
11
peptides |
107
spectra |
 |
|
0.978
0.571 | 0.999 |
|
|
|
|
|
|
|
0.022
0.001 | 0.417 |
| 13 spectra, VPGIVR |
|
0.992 |
|
|
|
|
|
|
|
0.008 |
| 17 spectra, TPHIDR |
|
0.993 |
|
|
|
|
|
|
|
0.007 |
| 10 spectra, LAGAELPTDR |
|
0.998 |
|
|
|
|
|
|
|
0.002 |
| 1 spectrum, SGMASHGR |
|
0.000 |
|
|
|
|
|
|
|
1.000 |
| 3 spectra, GQGYTTGLVGK |
|
0.975 |
|
|
|
|
|
|
|
0.025 |
| 12 spectra, FLGTPTTNLR |
|
0.986 |
|
|
|
|
|
|
|
0.014 |
| 10 spectra, ANTWEGGIR |
|
0.989 |
|
|
|
|
|
|
|
0.011 |
| 10 spectra, LASEAGDFLR |
|
0.999 |
|
|
|
|
|
|
|
0.001 |
| 14 spectra, AAFLTGR |
|
0.702 |
|
|
|
|
|
|
|
0.298 |
| 11 spectra, LALEGVK |
|
0.848 |
|
|
|
|
|
|
|
0.152 |
| 6 spectra, HPLTPETEPR |
|
0.112 |
|
|
|
|
|
|
|
0.888 |
| | | Plot |
|
Lyso |
|
|
|
|
|
|
|
Other |
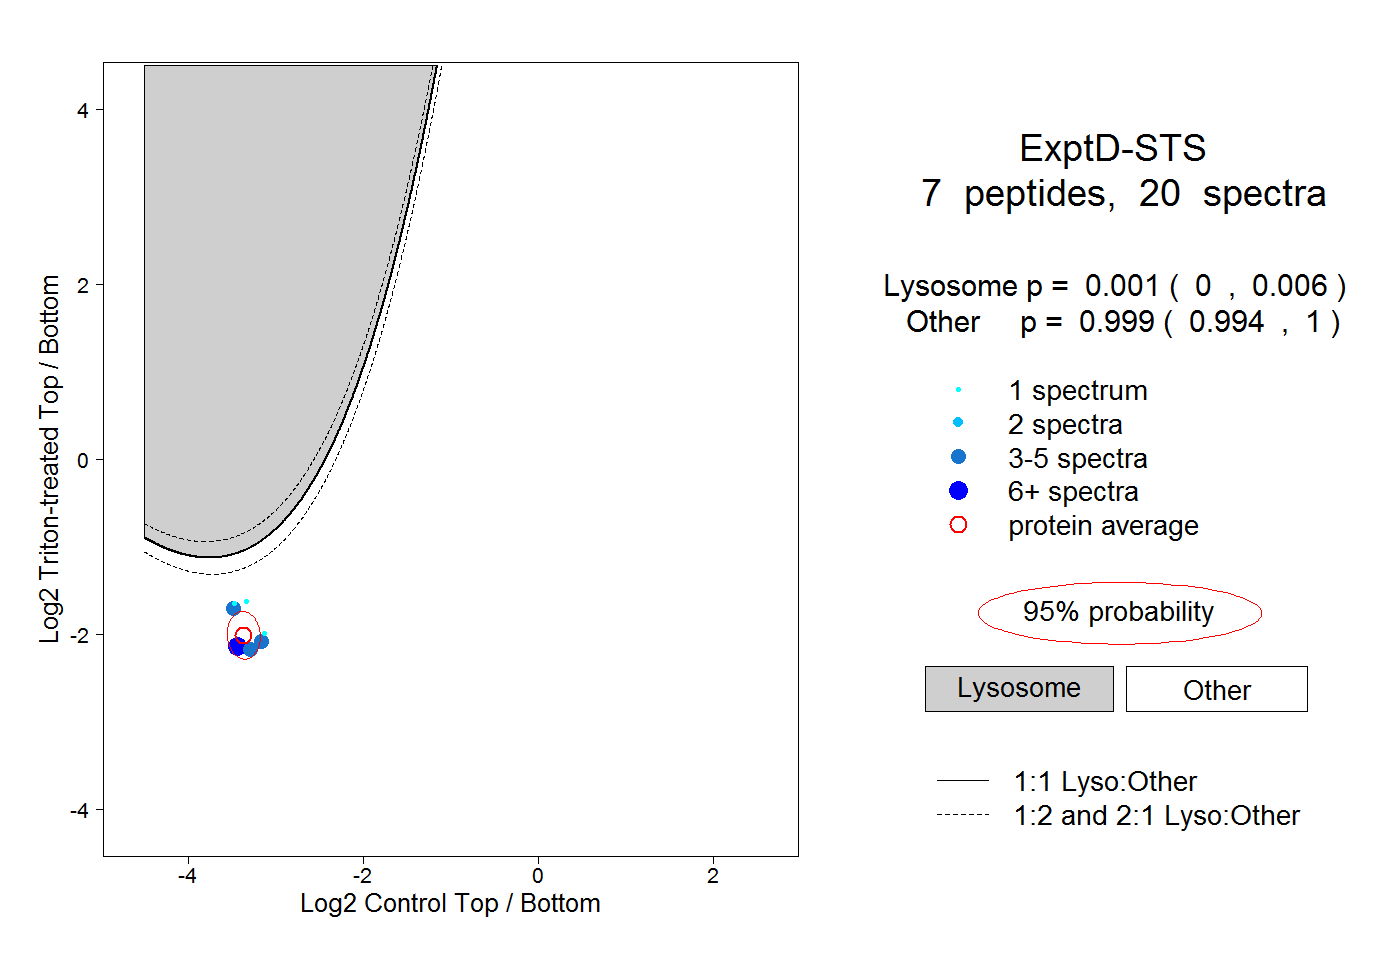
| Expt D |
7
peptides |
20
spectra |
 |
|
0.001
0.000 | 0.006 |
|
|
|
|
|
|
|
0.999
0.994 | 1.000 |