 74
74peptides
spectra
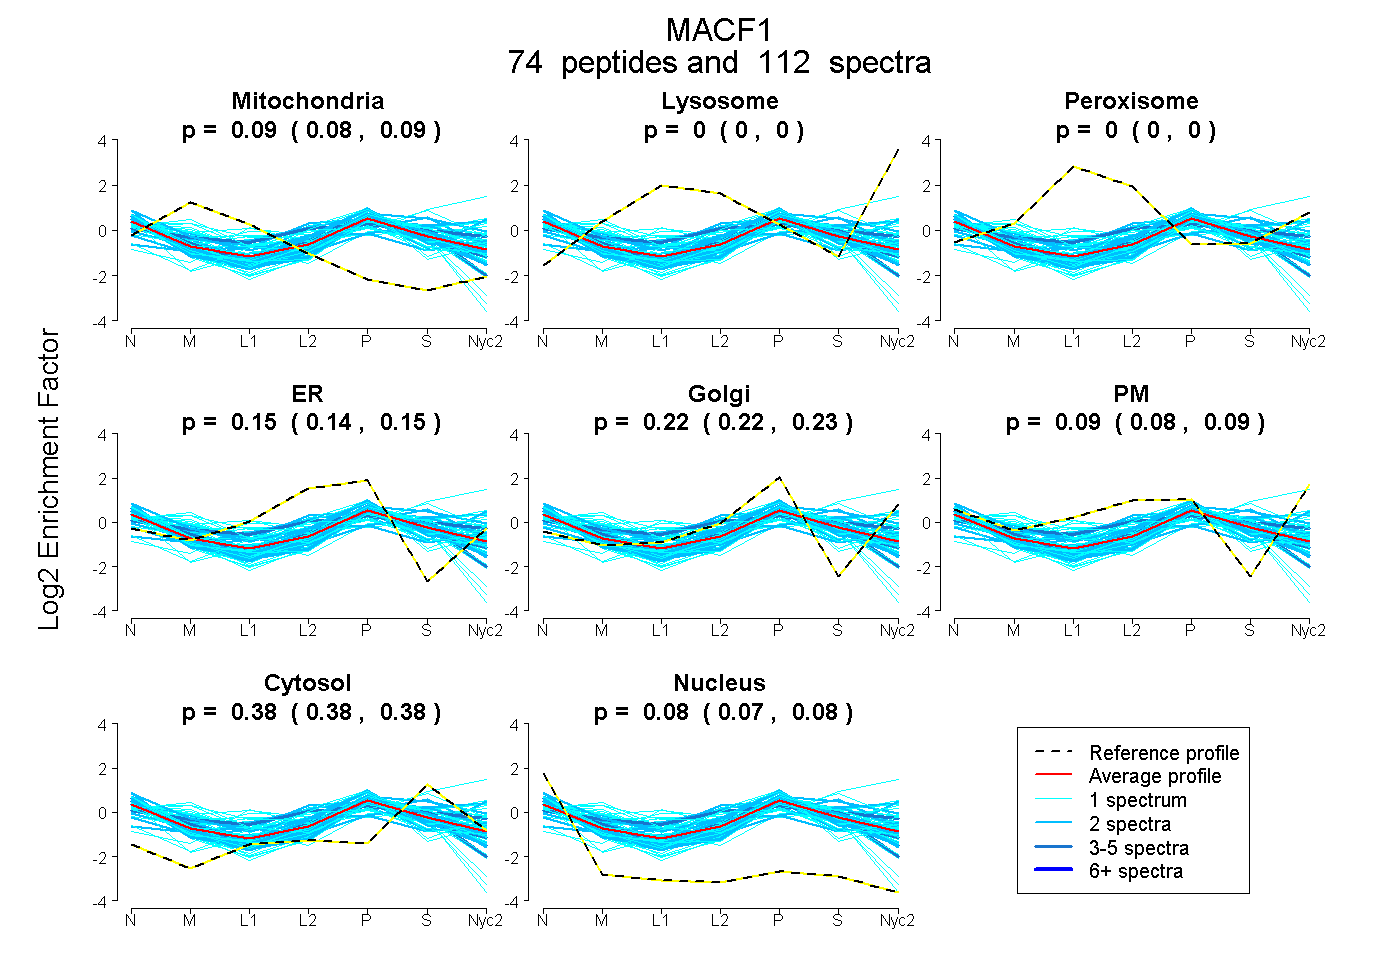
0.084 | 0.089
0.000 | 0.000
0.000 | 0.000
0.140 | 0.152
0.218 | 0.228
0.082 | 0.093
0.378 | 0.382
0.074 | 0.077
7peptides
spectra
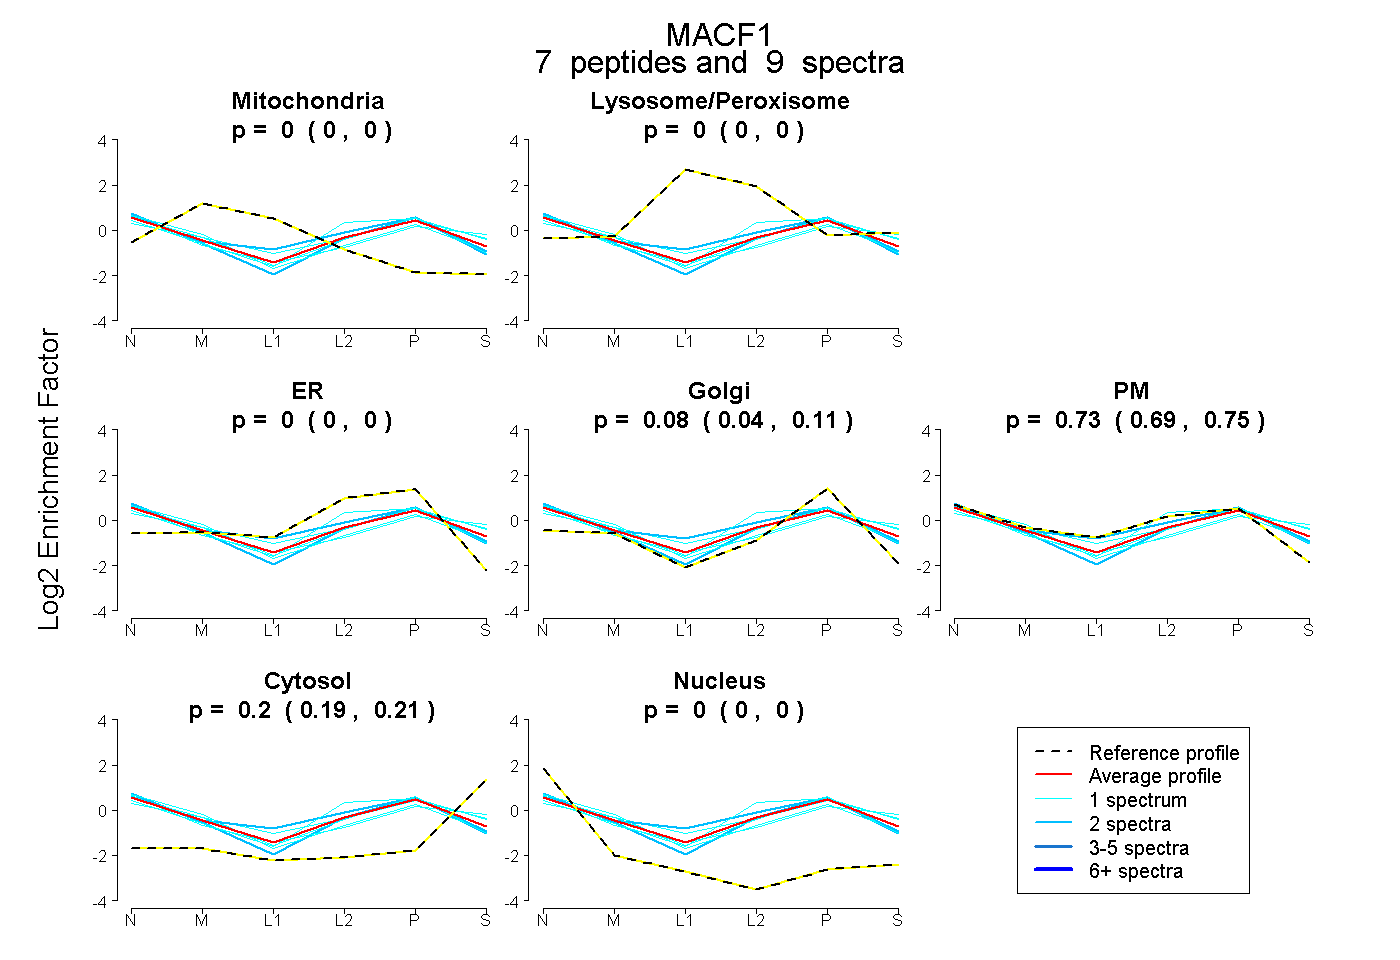
0.000 | 0.000
0.000 | 0.000
0.000 | 0.000
0.040 | 0.106
0.691 | 0.753
0.185 | 0.210
0.000 | 0.000
46peptides
spectra
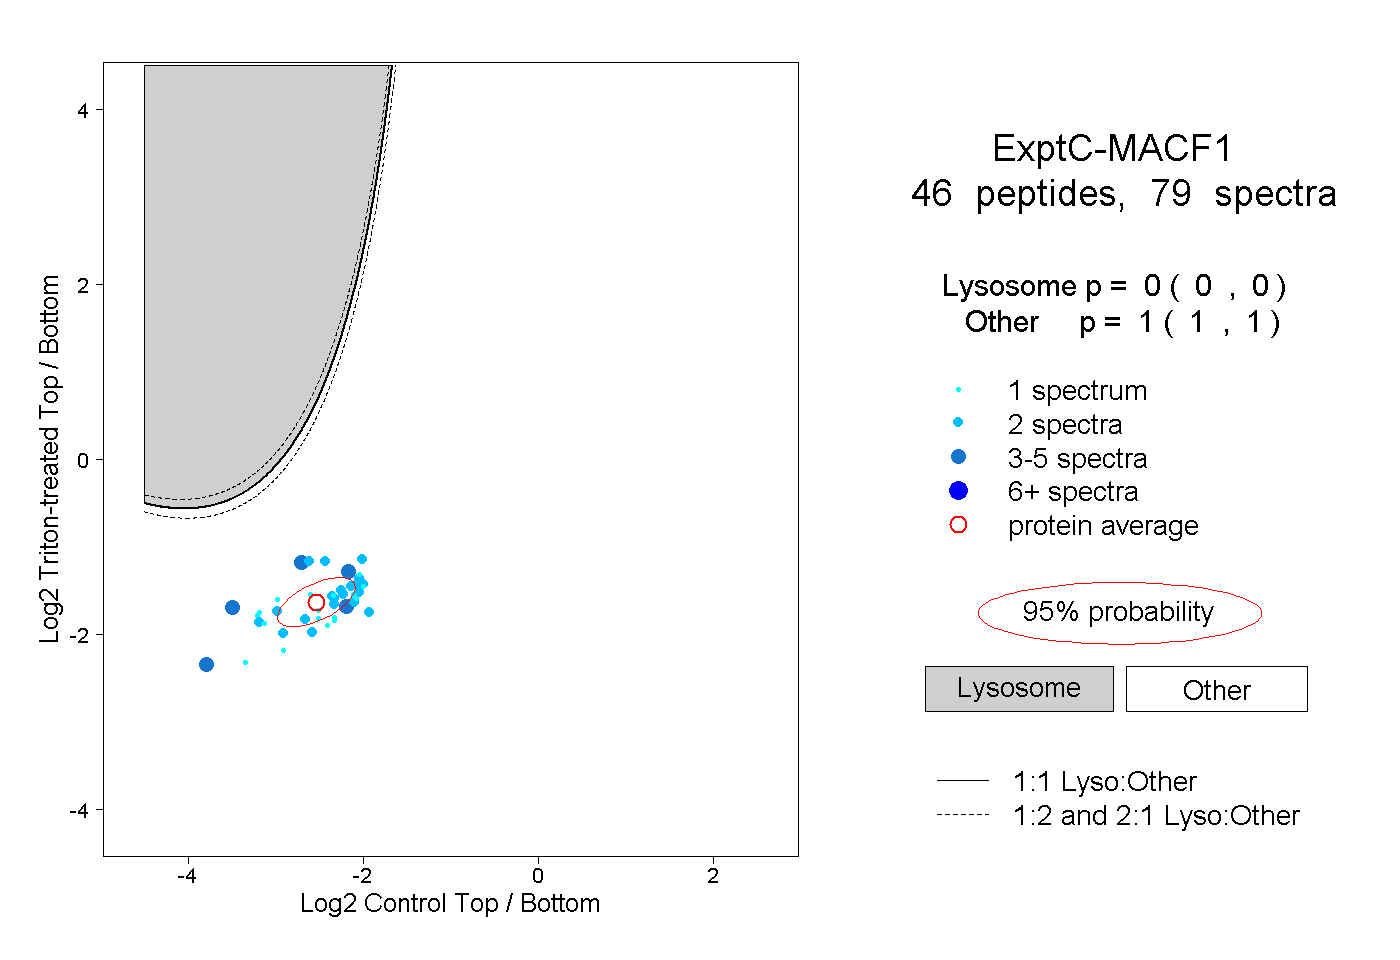
0.000 | 0.000
1.000 | 1.000
7peptides
spectra
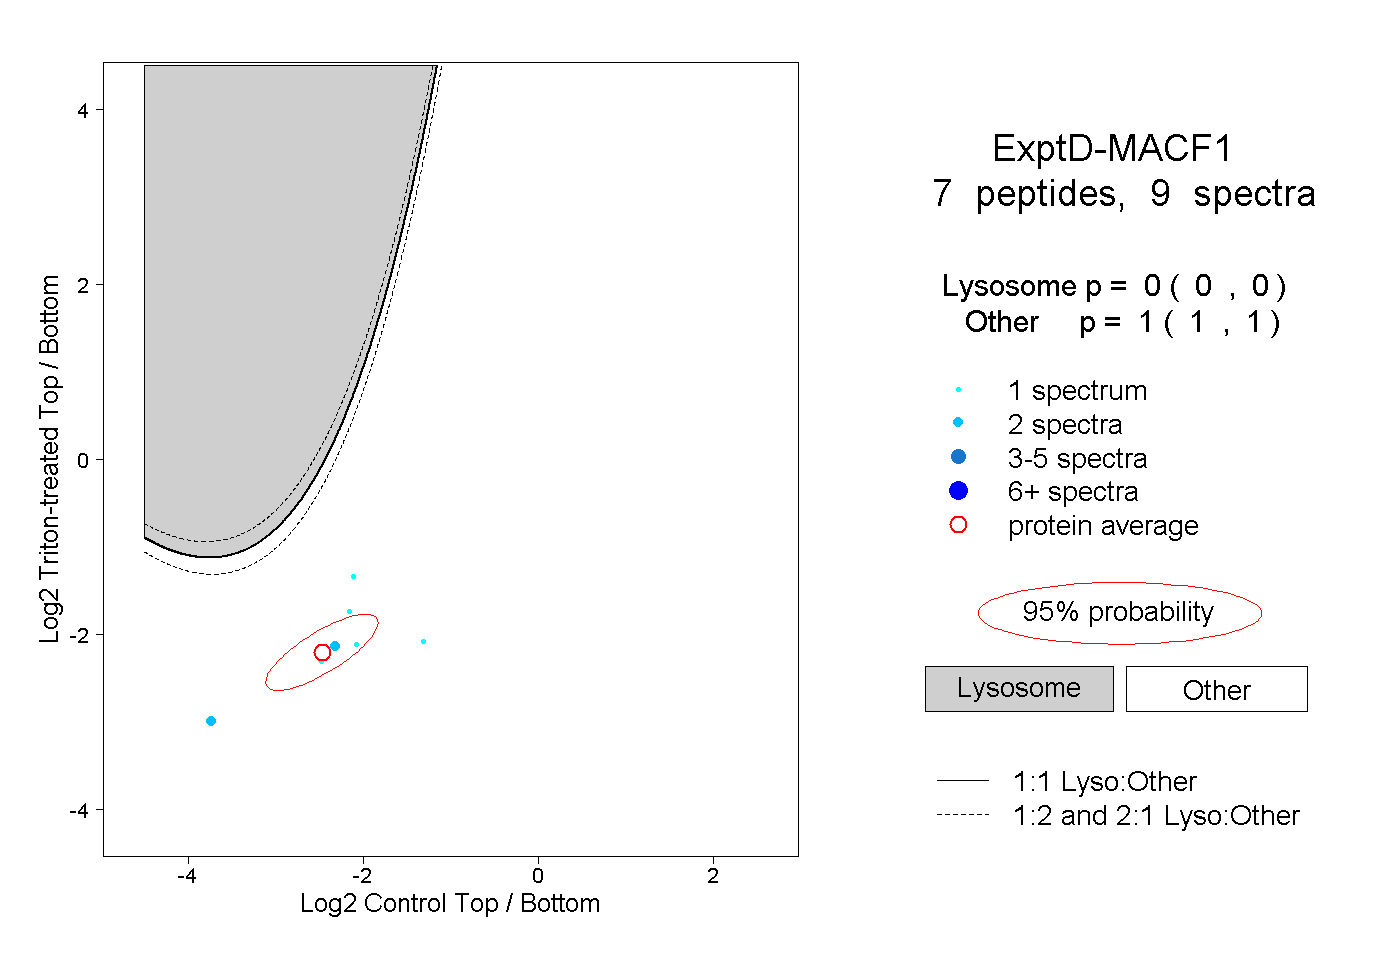
0.000 | 0.000
1.000 | 1.000