MACF1
[ENSRNOP00000041065]
Main page
| | | Plot |
Mito |
Lyso |
|
Perox |
ER |
Golgi |
PM |
Cytosol |
Nucleus |
|
| Expt A |
 74
74
peptides |
112
spectra |
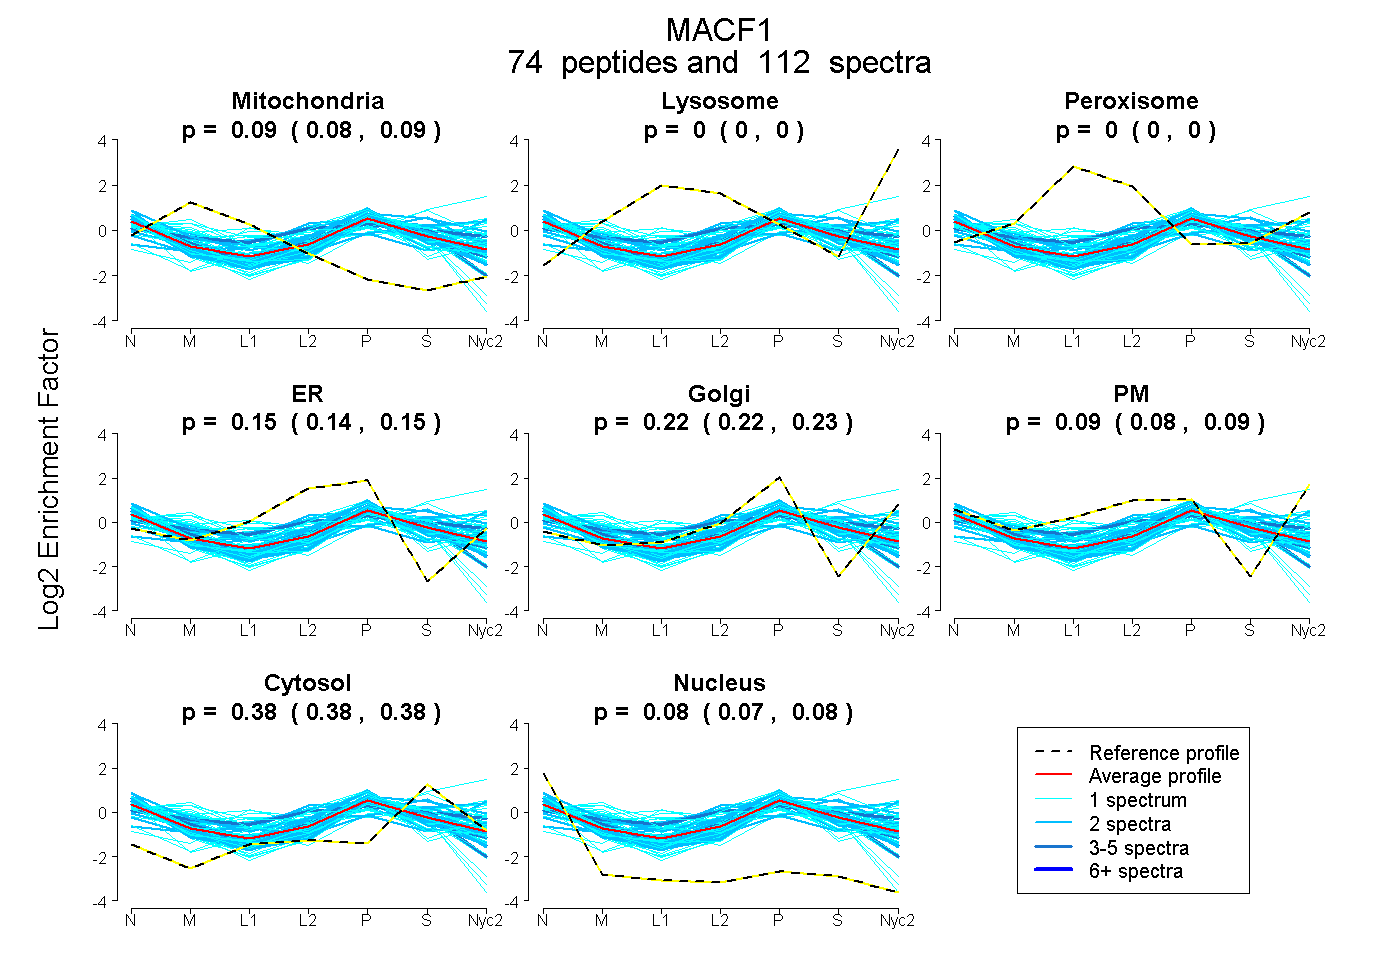 |
0.086
0.084 | 0.089 |
0.000
0.000 | 0.000 |
|
0.000
0.000 | 0.000 |
0.146
0.140 | 0.152 |
0.224
0.218 | 0.228 |
0.088
0.082 | 0.093 |
0.380
0.378 | 0.382 |
0.075
0.074 | 0.077 |
|
| | | Plot |
Mito |
|
Lyso or Perox |
|
ER |
Golgi |
PM |
Cytosol |
Nucleus |
|
| Expt B |
7
peptides |
9
spectra |
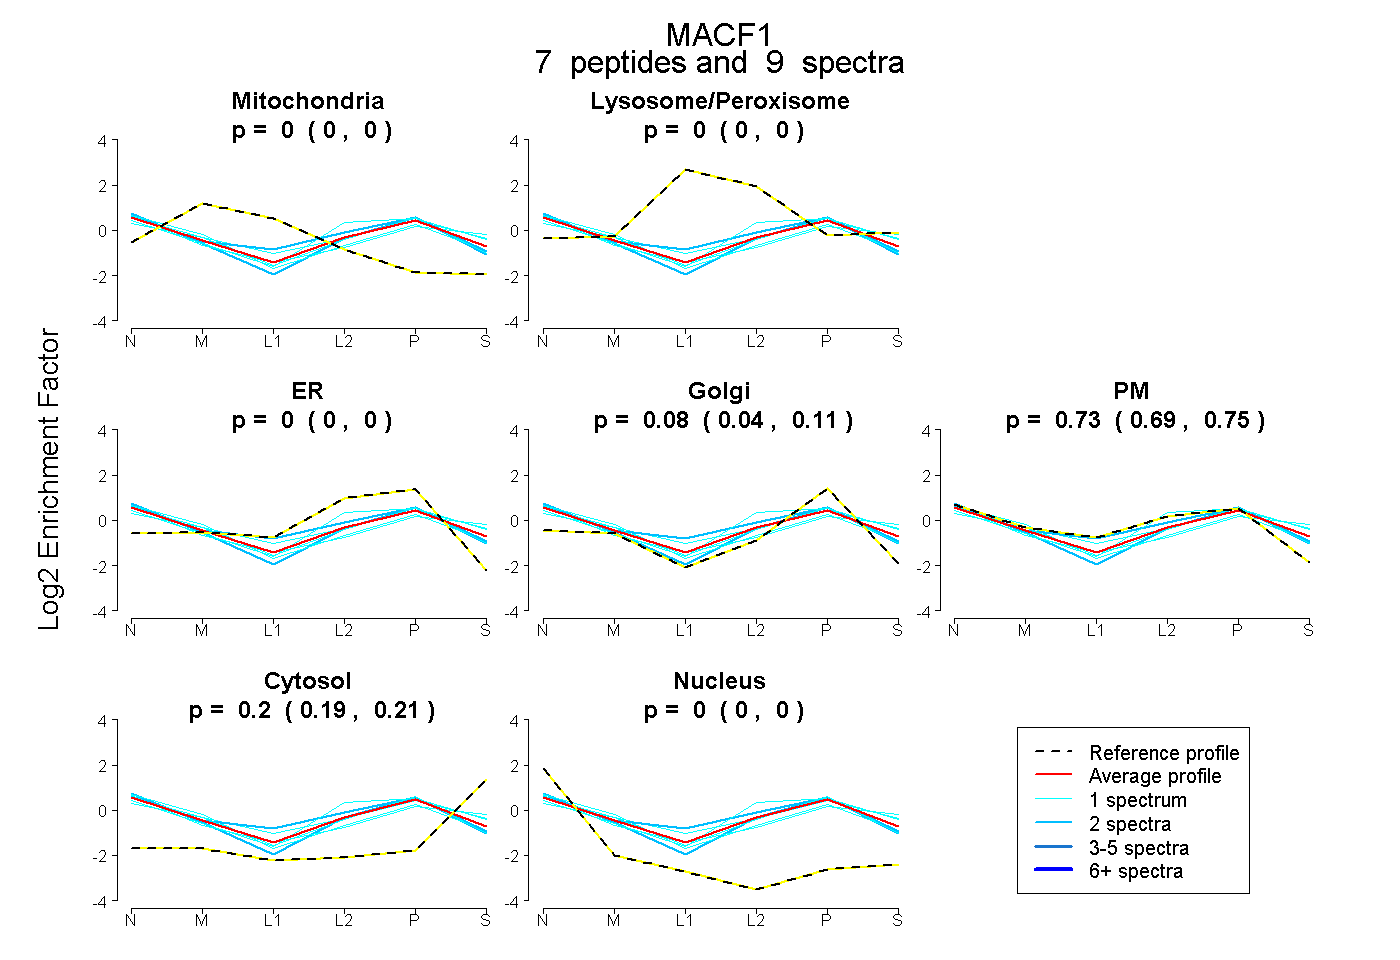 |
0.000
0.000 | 0.000 |
|
0.000
0.000 | 0.000 |
|
0.000
0.000 | 0.000 |
0.076
0.040 | 0.106 |
0.726
0.691 | 0.753 |
0.198
0.185 | 0.210 |
0.000
0.000 | 0.000 |
|
| 1 spectrum, QQLEETSEIR |
0.000 |
|
0.000 |
|
0.000 |
0.216 |
0.643 |
0.141 |
0.001 |
|
| 1 spectrum, VMDFFR |
0.000 |
|
0.003 |
|
0.116 |
0.000 |
0.664 |
0.218 |
0.000 |
|
| 1 spectrum, HWITIIR |
0.000 |
|
0.000 |
|
0.000 |
0.146 |
0.633 |
0.167 |
0.054 |
|
| 1 spectrum, QEFIDGILASK |
0.000 |
|
0.089 |
|
0.000 |
0.105 |
0.580 |
0.225 |
0.000 |
|
| 1 spectrum, SIQDAELLVK |
0.000 |
|
0.000 |
|
0.000 |
0.000 |
0.670 |
0.323 |
0.007 |
|
| 2 spectra, FLDVLELAEK |
0.000 |
|
0.000 |
|
0.000 |
0.273 |
0.570 |
0.117 |
0.041 |
|
| 2 spectra, QLEDILVLAK |
0.000 |
|
0.064 |
|
0.000 |
0.043 |
0.771 |
0.122 |
0.000 |
|
| | | Plot |
|
Lyso |
|
|
|
|
|
|
|
Other |
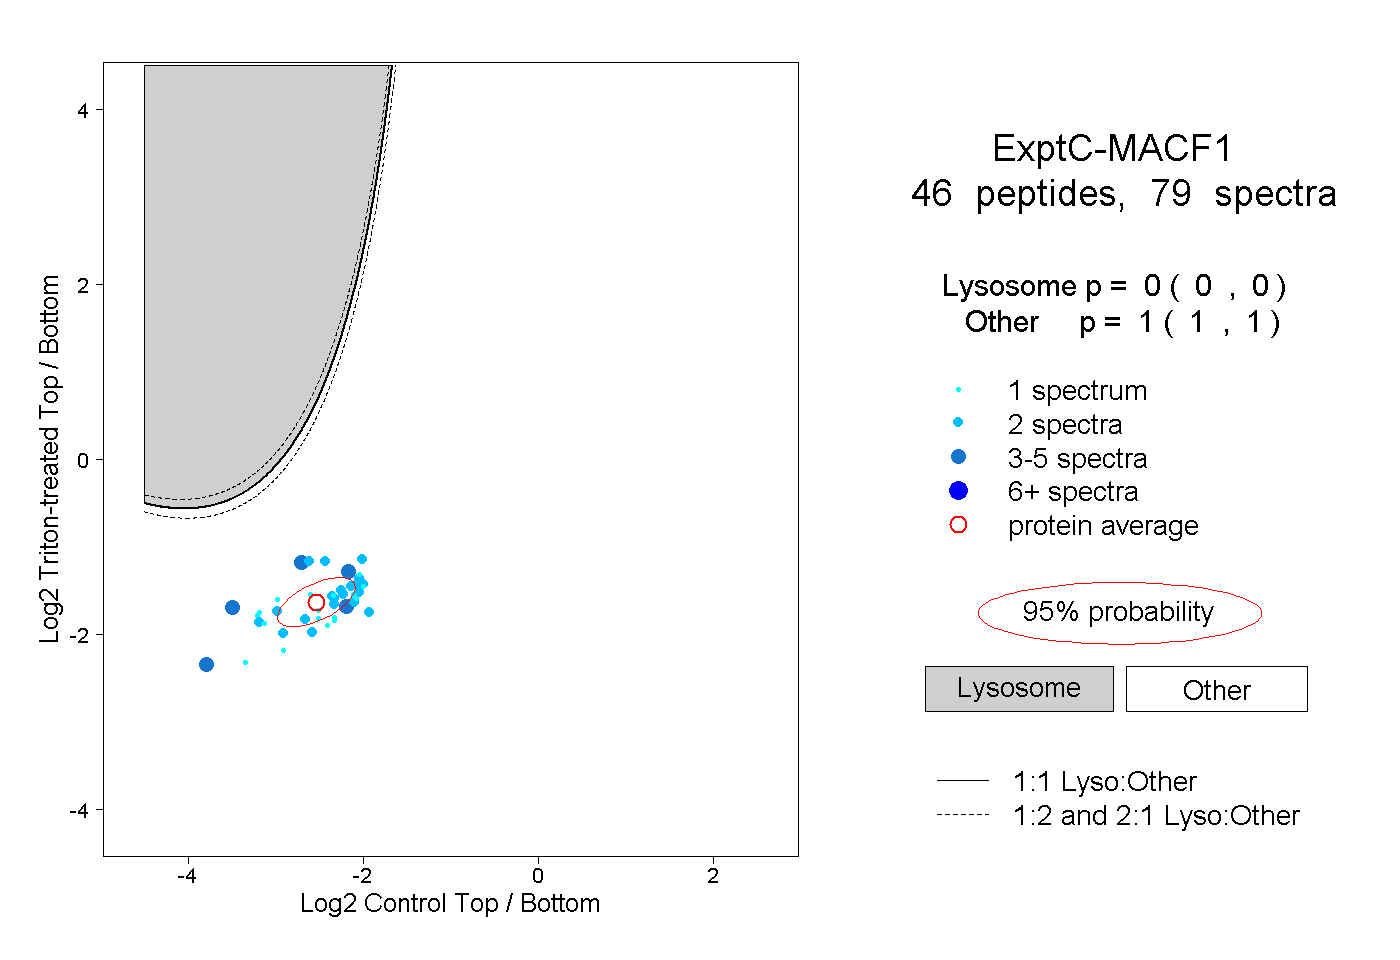
| Expt C |
46
peptides |
79
spectra |
 |
|
0.000
0.000 | 0.000 |
|
|
|
|
|
|
|
1.000
1.000 | 1.000 |
| | | Plot |
|
Lyso |
|
|
|
|
|
|
|
Other |
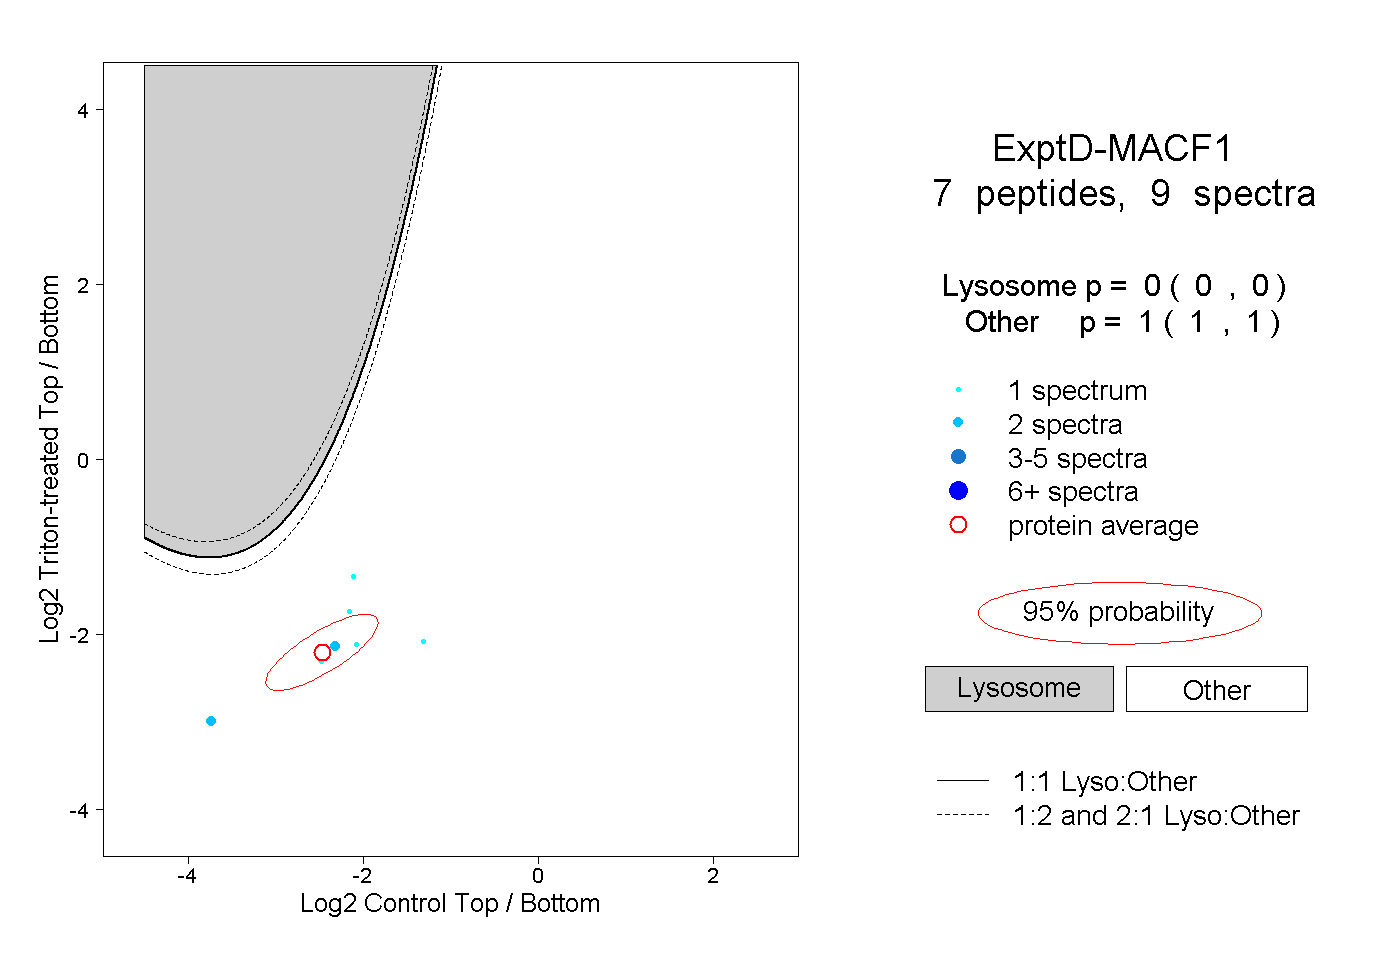
| Expt D |
7
peptides |
9
spectra |
 |
|
0.000
0.000 | 0.000 |
|
|
|
|
|
|
|
1.000
1.000 | 1.000 |