 16
16peptides
spectra
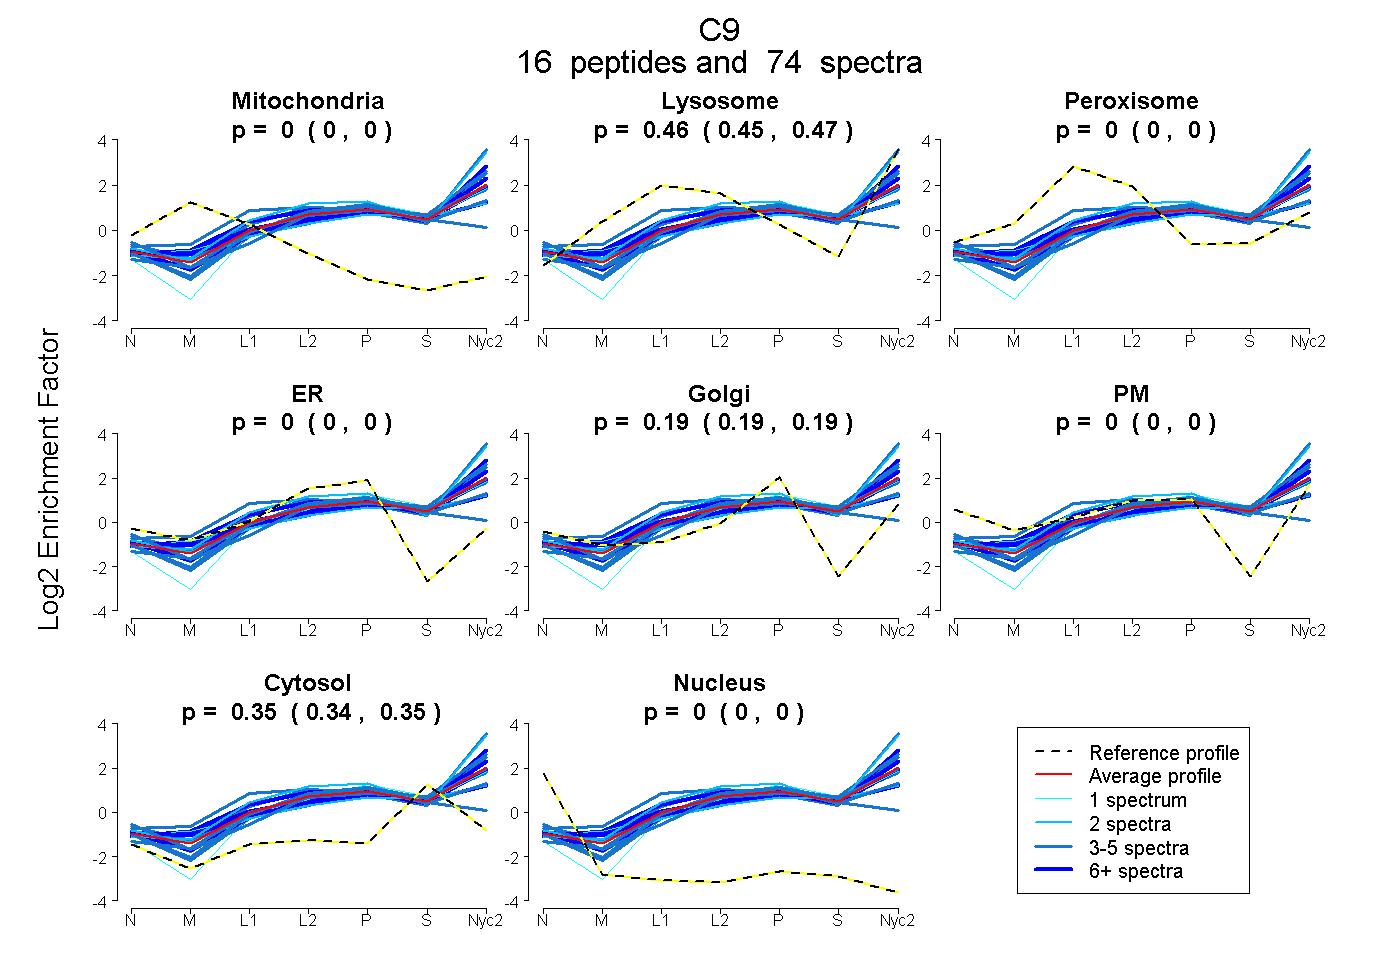
0.000 | 0.000
0.455 | 0.465
0.000 | 0.000
0.000 | 0.000
0.188 | 0.195
0.000 | 0.000
0.344 | 0.350
0.000 | 0.000
10peptides
spectra
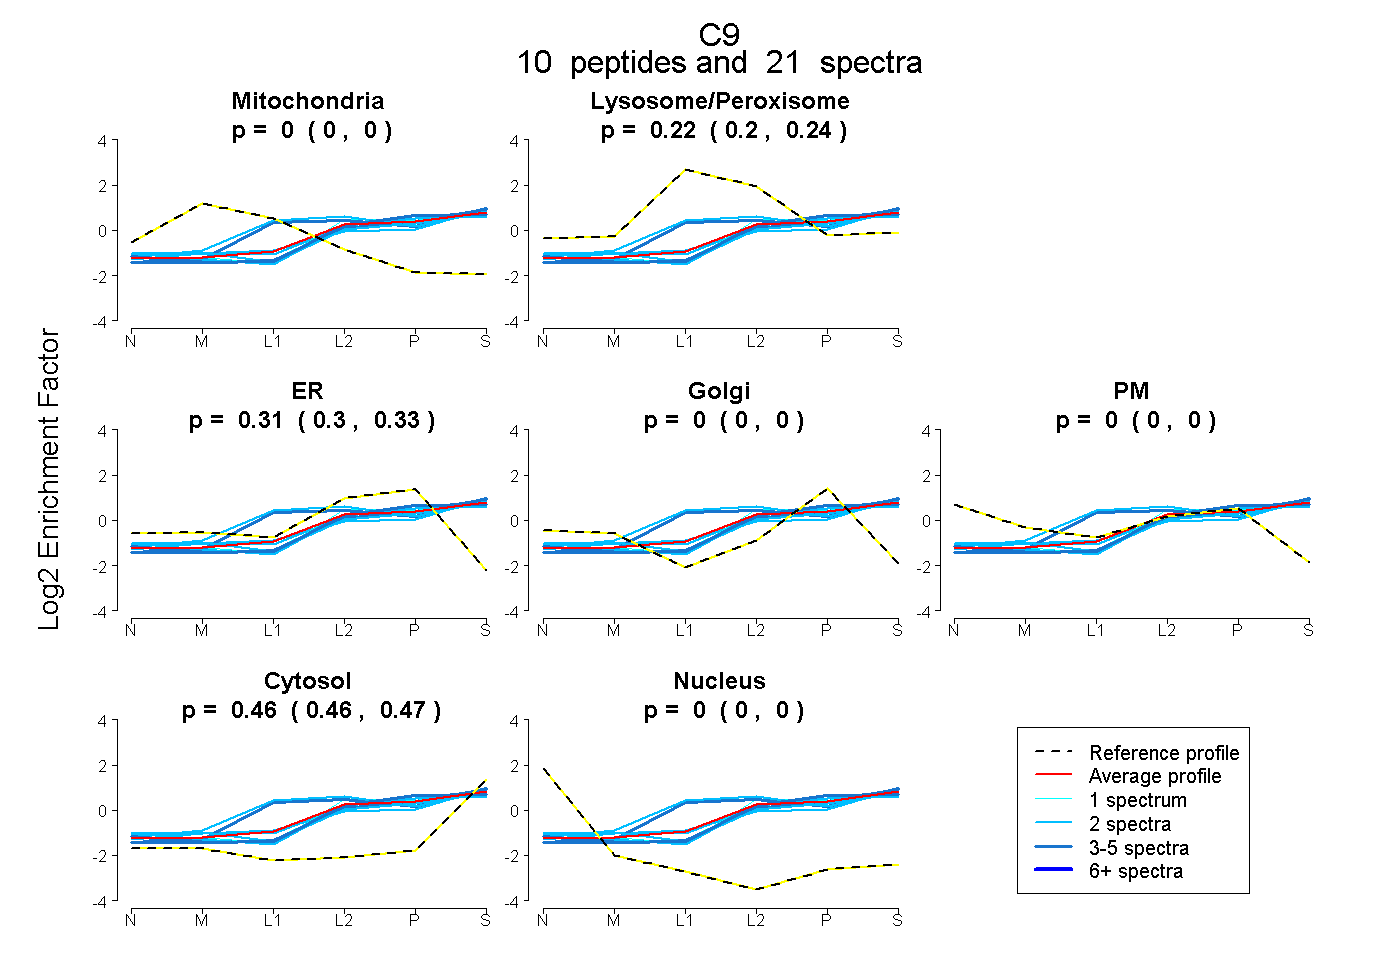
0.000 | 0.000
0.203 | 0.239
0.300 | 0.326
0.000 | 0.000
0.000 | 0.000
0.457 | 0.470
0.000 | 0.000
22peptides
spectra
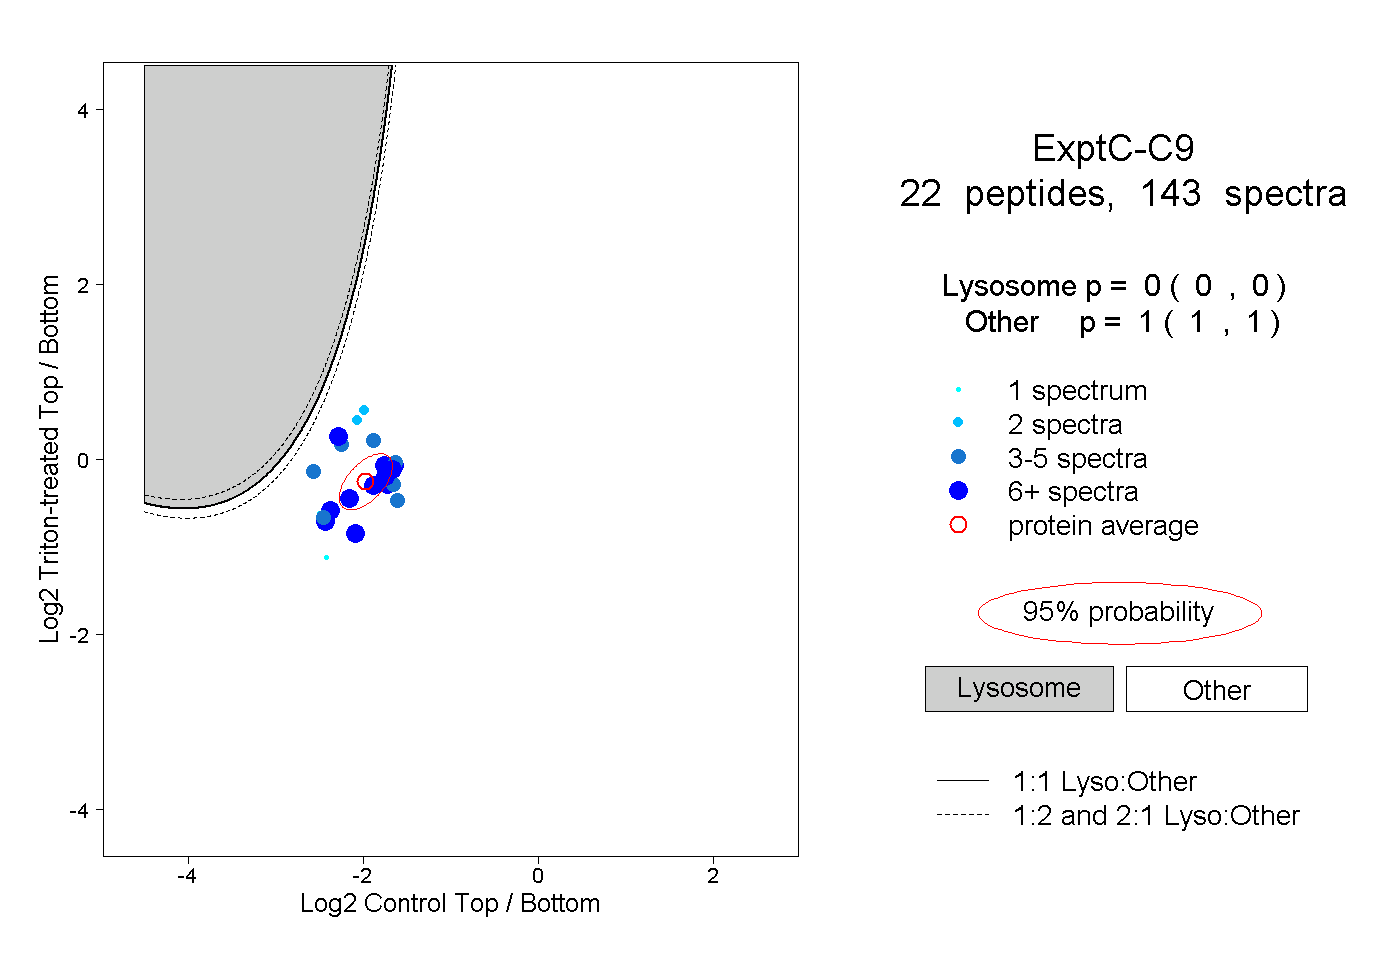
0.000 | 0.000
1.000 | 1.000
10peptides
spectra
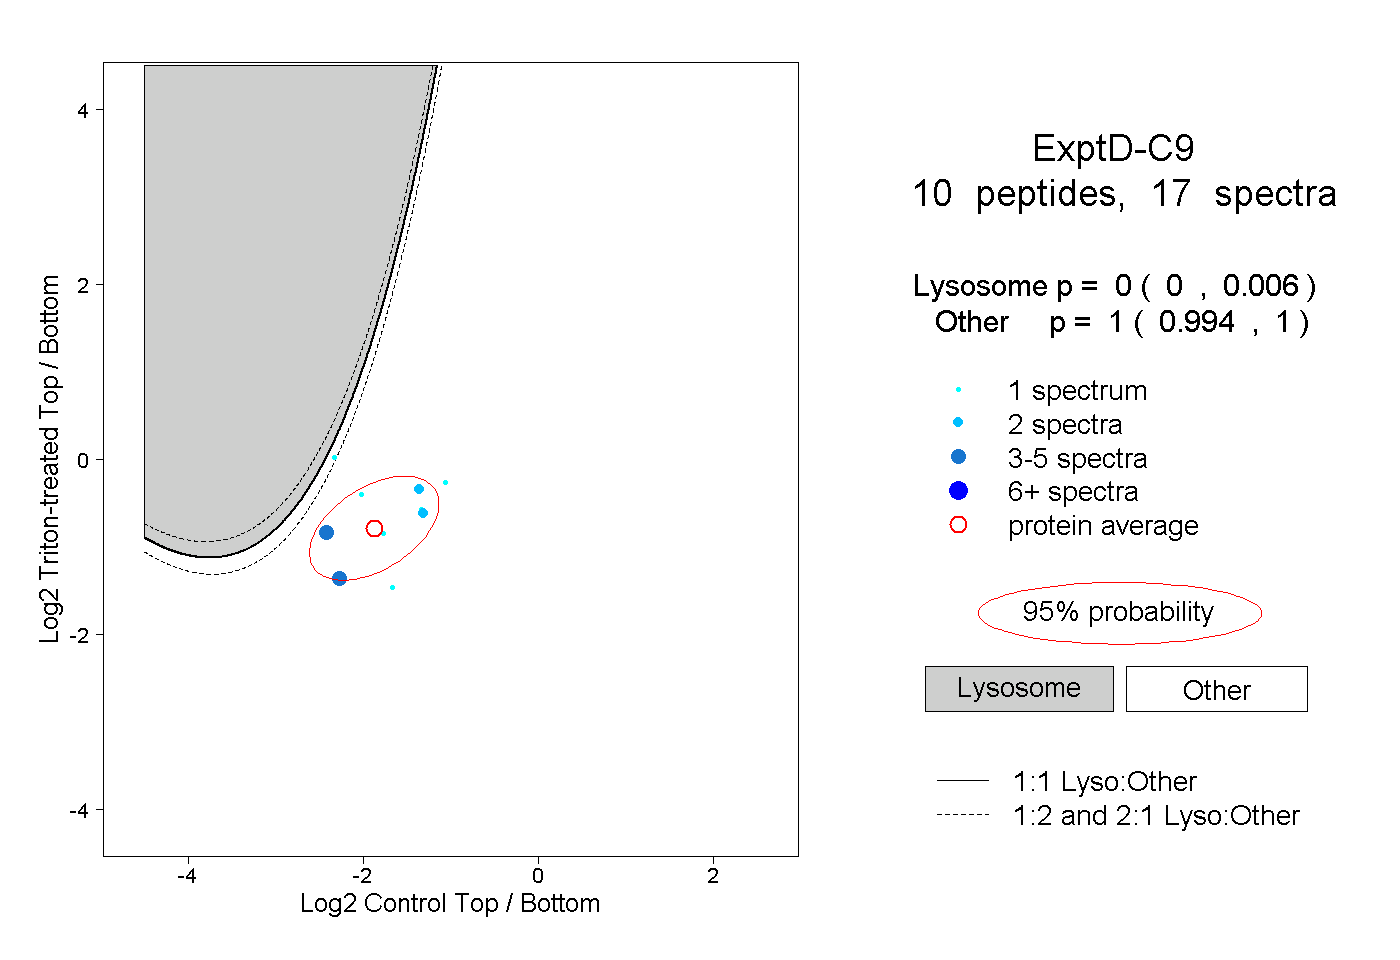
0.000 | 0.006
0.994 | 1.000