 16
16peptides
spectra
0.000 | 0.000
0.455 | 0.465
0.000 | 0.000
0.000 | 0.000
0.188 | 0.195
0.000 | 0.000
0.344 | 0.350
0.000 | 0.000
| Plot | Mito | Lyso | Perox | ER | Golgi | PM | Cytosol | Nucleus | |||||
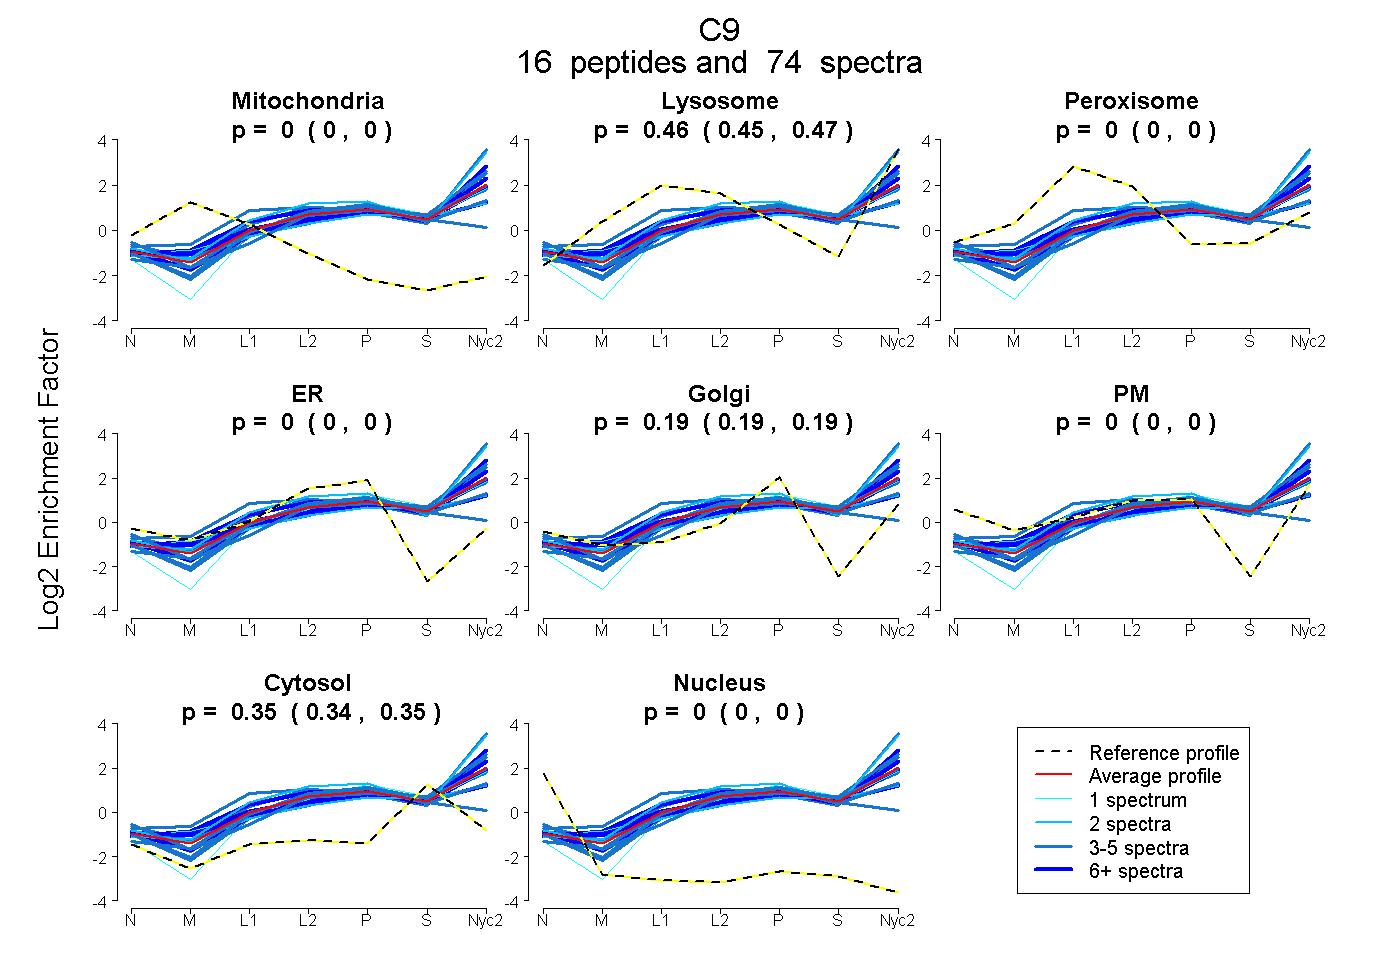
| Expt A |
16 peptides |
74 spectra |
|
0.000 0.000 | 0.000 |
0.460 0.455 | 0.465 |
0.000 0.000 | 0.000 |
0.000 0.000 | 0.000 |
0.192 0.188 | 0.195 |
0.000 0.000 | 0.000 |
0.348 0.344 | 0.350 |
0.000 0.000 | 0.000 |
| 6 spectra, LSPIYNLIPLTMK | 0.000 | 0.401 | 0.000 | 0.000 | 0.249 | 0.000 | 0.350 | 0.000 | ||
| 4 spectra, DGNTLTYYR | 0.000 | 0.371 | 0.000 | 0.000 | 0.216 | 0.000 | 0.413 | 0.000 | ||
| 15 spectra, MFLHVR | 0.000 | 0.631 | 0.000 | 0.000 | 0.111 | 0.000 | 0.258 | 0.000 | ||
| 3 spectra, VGVDEVSPEK | 0.000 | 0.263 | 0.000 | 0.023 | 0.274 | 0.058 | 0.382 | 0.000 | ||
| 3 spectra, TENYEEQFEMFK | 0.000 | 0.537 | 0.000 | 0.000 | 0.094 | 0.000 | 0.369 | 0.000 | ||
| 2 spectra, TTSFNANLALK | 0.000 | 0.683 | 0.000 | 0.000 | 0.134 | 0.000 | 0.183 | 0.000 | ||
| 5 spectra, DHIIDDVISFIR | 0.000 | 0.568 | 0.000 | 0.000 | 0.135 | 0.000 | 0.296 | 0.000 | ||
| 1 spectrum, QAVLLK | 0.000 | 0.458 | 0.000 | 0.000 | 0.203 | 0.000 | 0.338 | 0.000 | ||
| 3 spectra, AIEDYVNEFSAR | 0.000 | 0.370 | 0.000 | 0.000 | 0.218 | 0.000 | 0.412 | 0.000 | ||
| 5 spectra, LSSYLSQTK | 0.000 | 0.766 | 0.000 | 0.000 | 0.015 | 0.037 | 0.182 | 0.000 | ||
| 9 spectra, SCADALGDR | 0.000 | 0.366 | 0.000 | 0.025 | 0.207 | 0.000 | 0.402 | 0.000 | ||
| 3 spectra, GIACEISK | 0.000 | 0.072 | 0.148 | 0.217 | 0.129 | 0.000 | 0.435 | 0.000 | ||
| 1 spectrum, GVMLTTTFLDDVK | 0.000 | 0.334 | 0.000 | 0.000 | 0.221 | 0.000 | 0.446 | 0.000 | ||
| 2 spectra, SIEVFGQFQGK | 0.000 | 0.338 | 0.000 | 0.000 | 0.215 | 0.000 | 0.446 | 0.000 | ||
| 4 spectra, VVEESELGR | 0.000 | 0.418 | 0.000 | 0.000 | 0.212 | 0.000 | 0.370 | 0.000 | ||
| 8 spectra, GMIQLGR | 0.000 | 0.523 | 0.000 | 0.000 | 0.152 | 0.000 | 0.324 | 0.000 |
| Plot | Mito | Lyso or Perox | ER | Golgi | PM | Cytosol | Nucleus | ||||||
| Expt B |
10 peptides |
21 spectra |
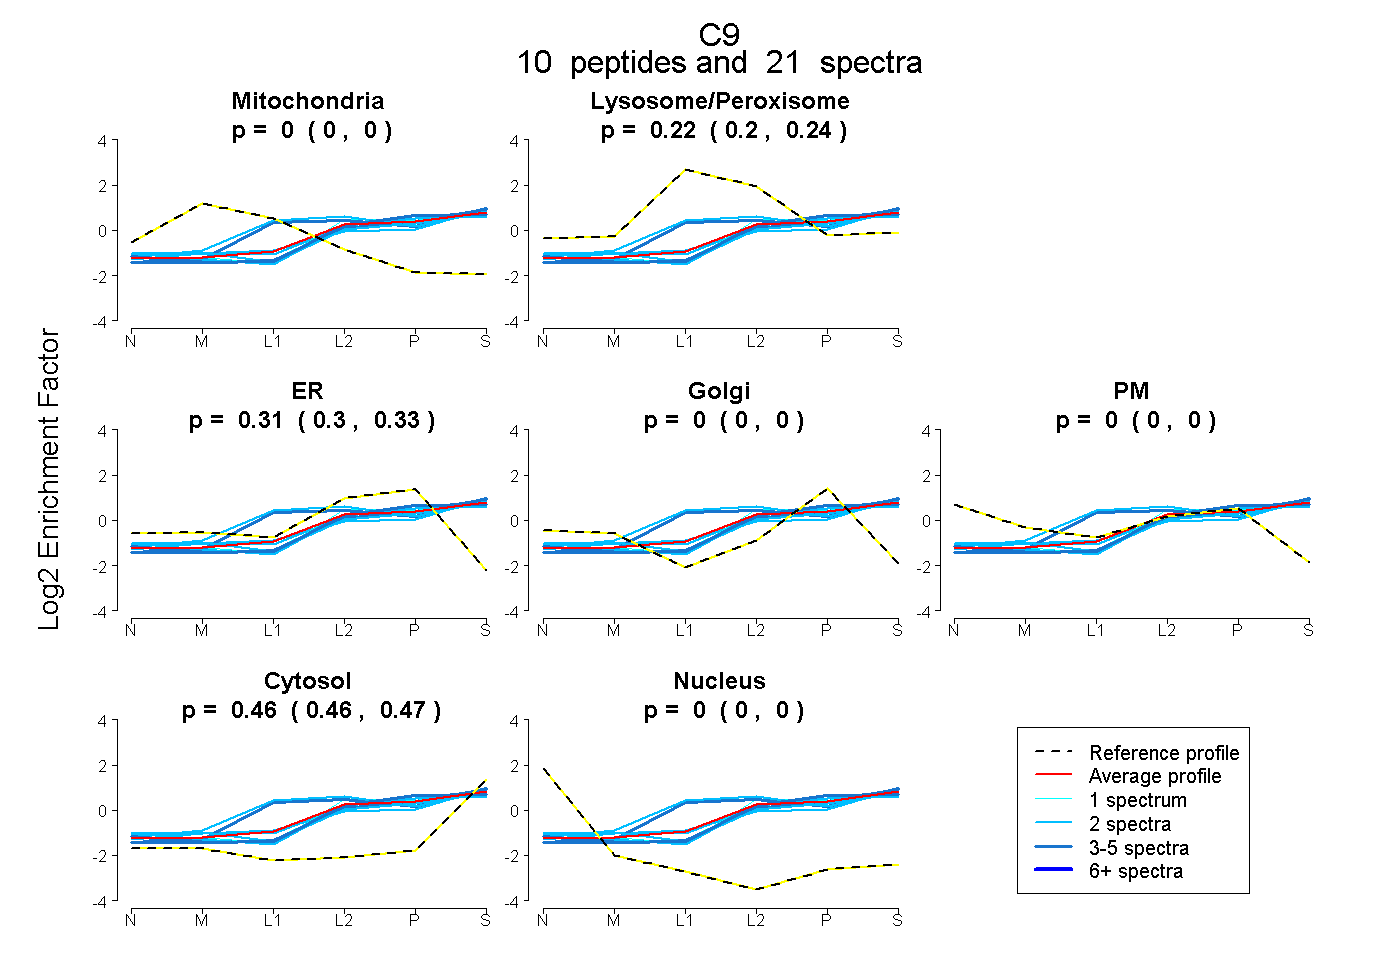 |
0.000 0.000 | 0.000 |
0.221 0.203 | 0.239 |
0.315 0.300 | 0.326 |
0.000 0.000 | 0.000 |
0.000 0.000 | 0.000 |
0.464 0.457 | 0.470 |
0.000 0.000 | 0.000 |
|||
| Plot | Lyso | Other | |||||||||||
| Expt C |
22 peptides |
143 spectra |
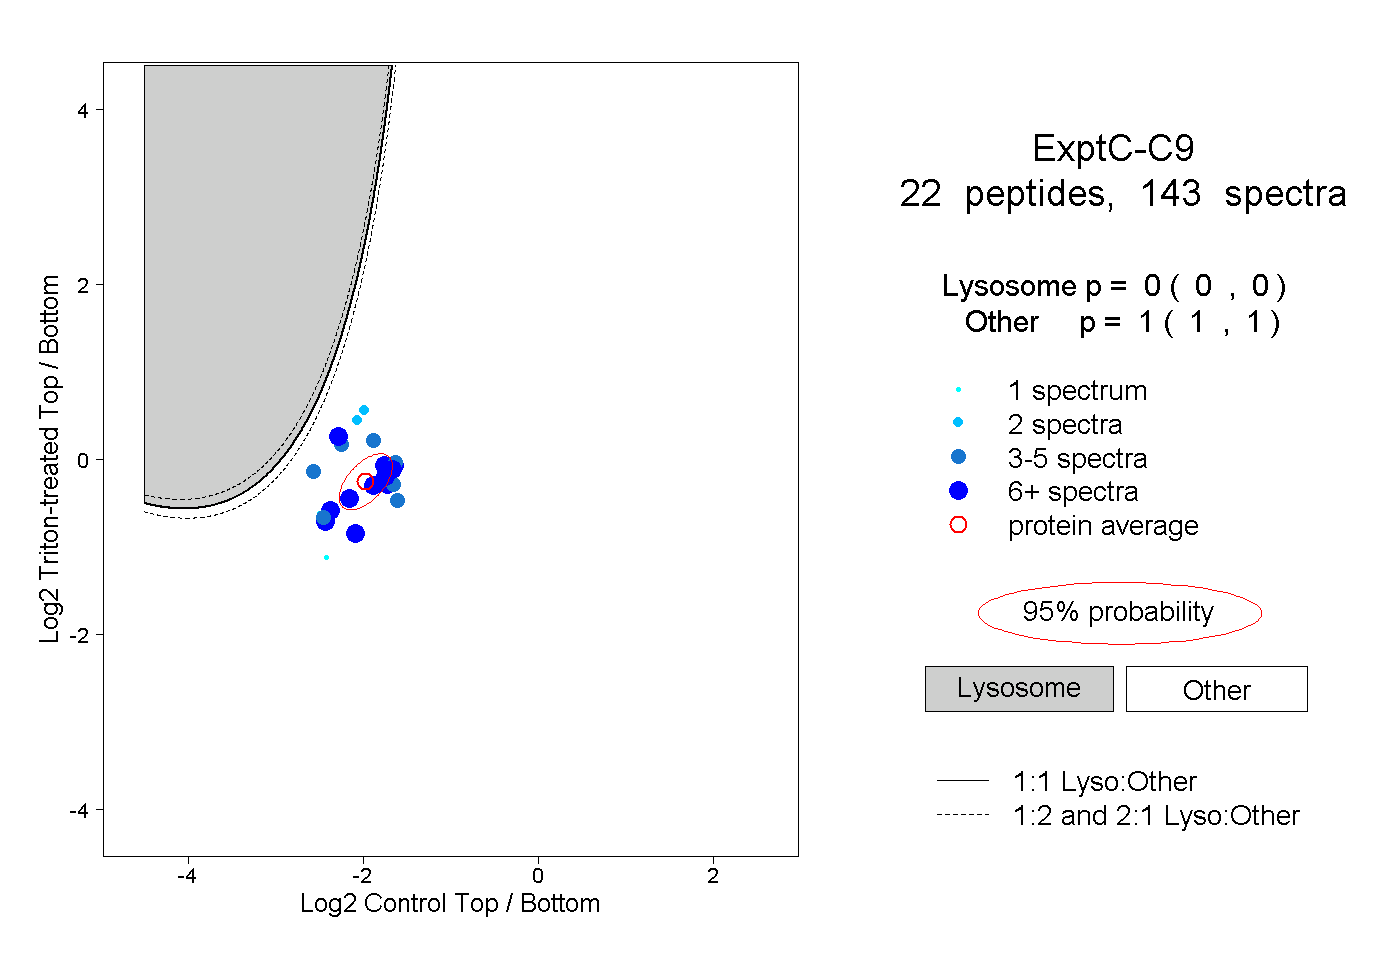 |
0.000 0.000 | 0.000 |
1.000 1.000 | 1.000 |
||||||||
| Plot | Lyso | Other | |||||||||||
| Expt D |
10 peptides |
17 spectra |
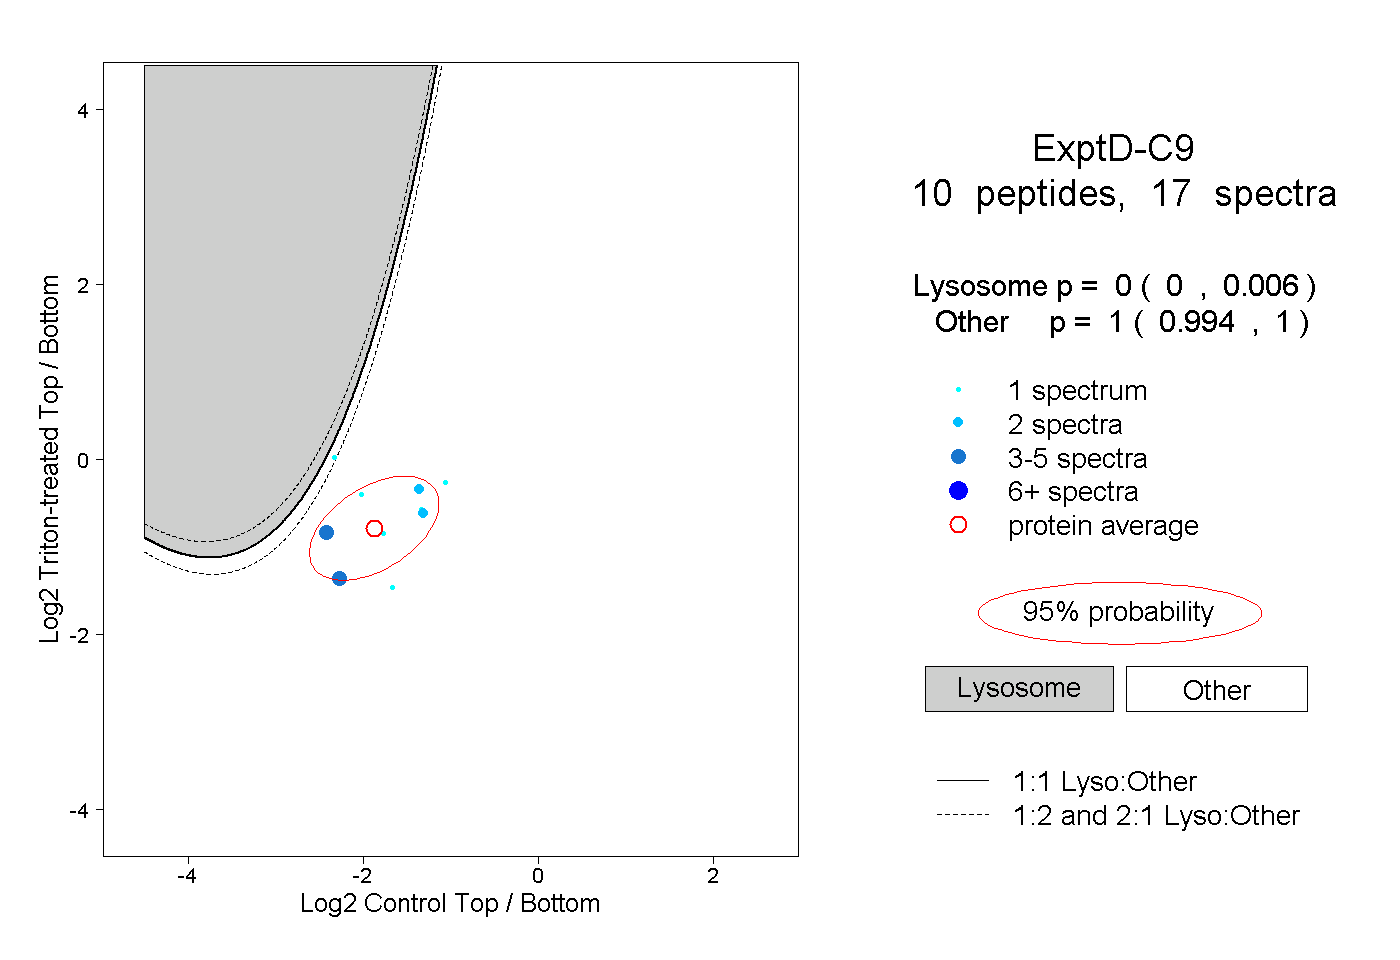 |
0.000 0.000 | 0.006 |
1.000 0.994 | 1.000 |