 14
14peptides
spectra
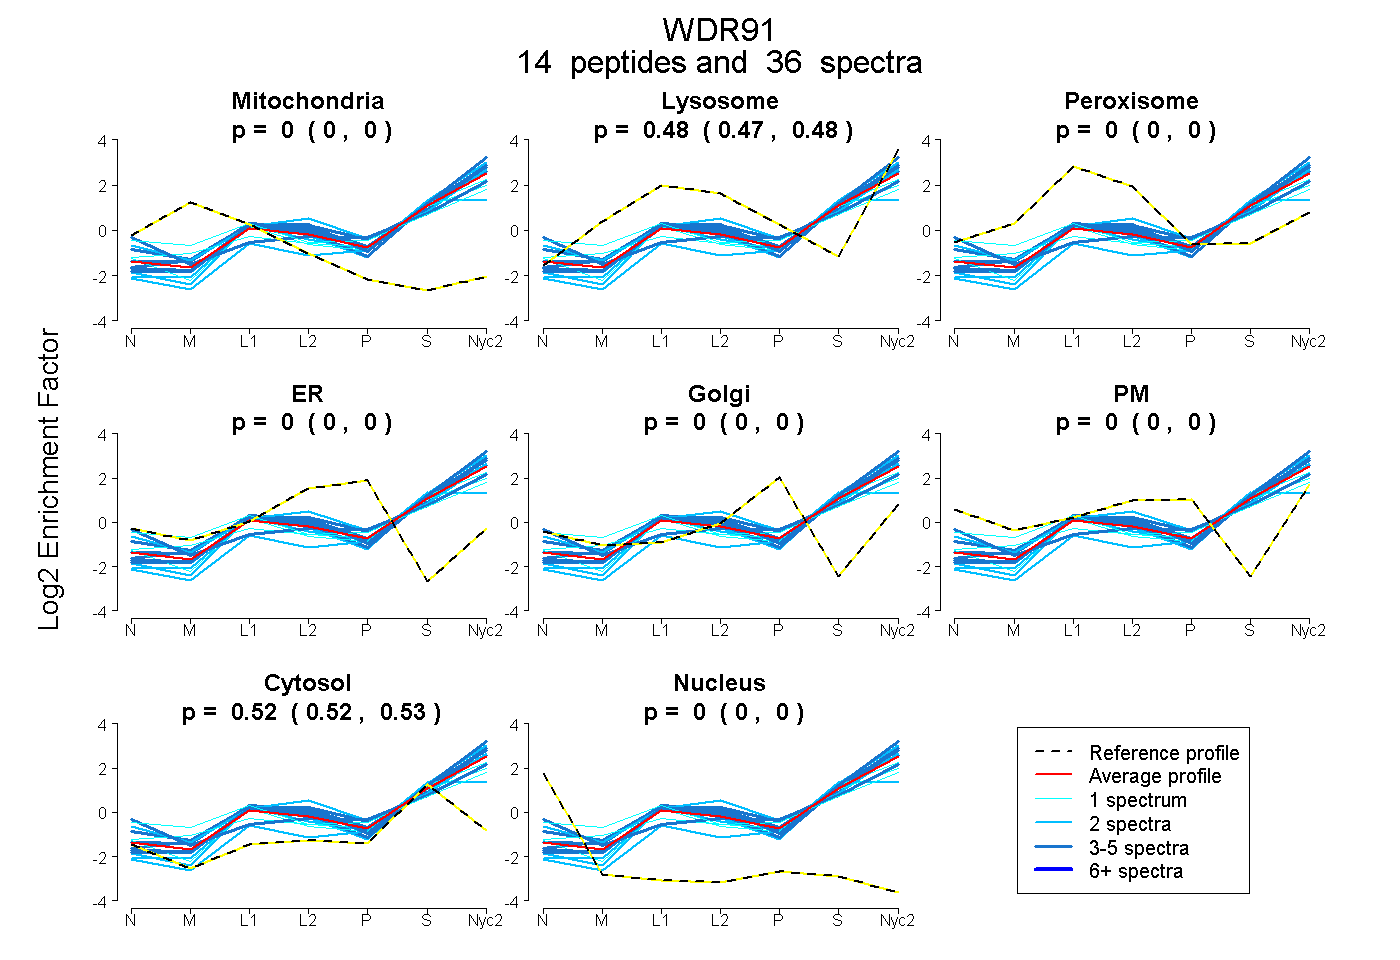
0.000 | 0.000
0.473 | 0.482
0.000 | 0.000
0.000 | 0.000
0.000 | 0.000
0.000 | 0.000
0.517 | 0.526
0.000 | 0.000
4peptides
spectra
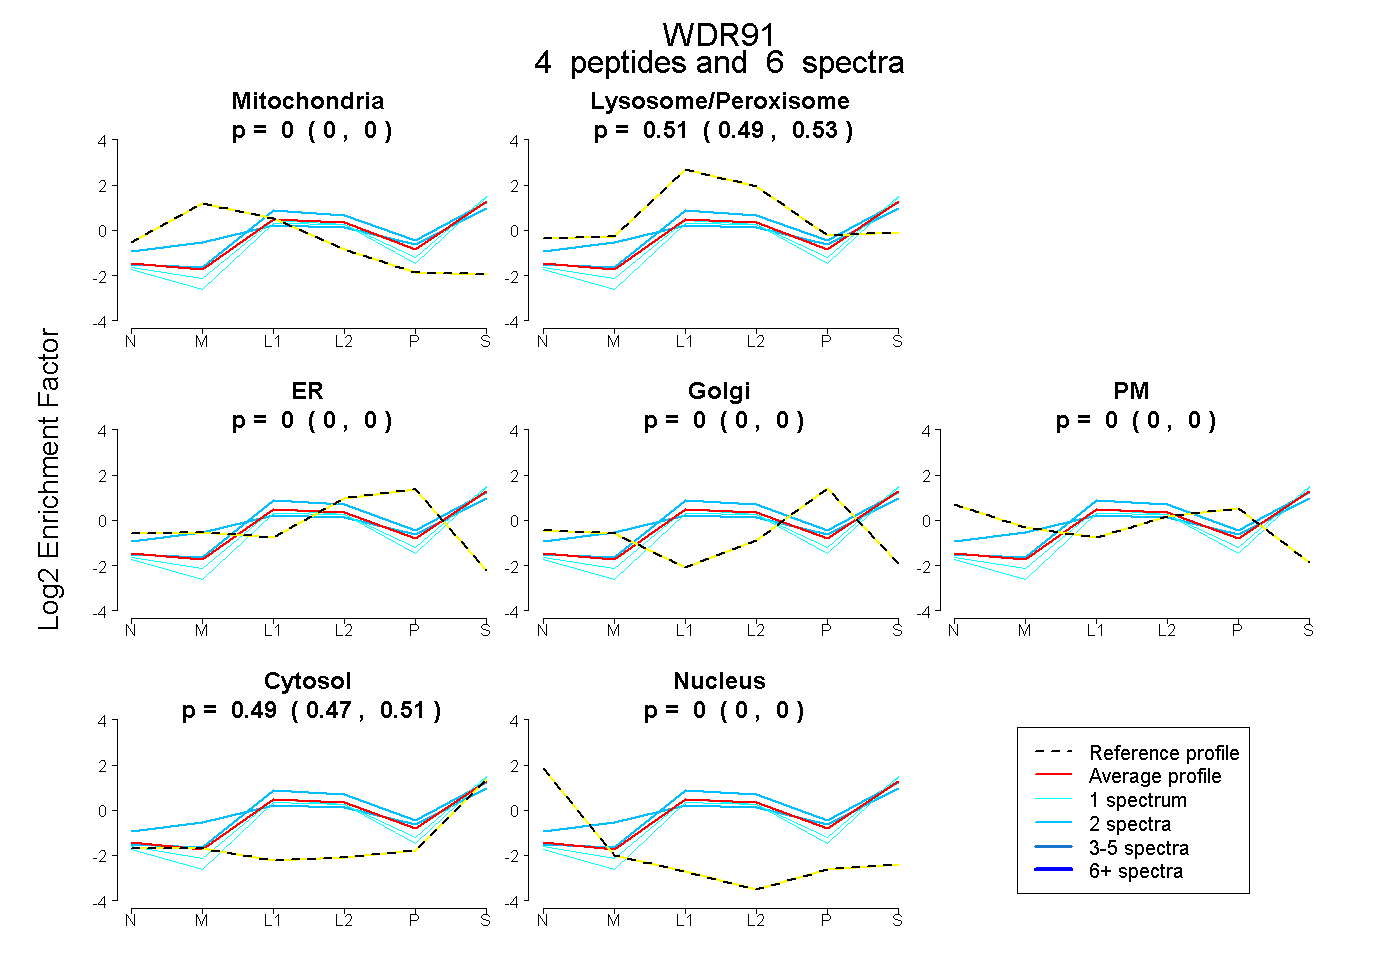
0.000 | 0.000
0.491 | 0.526
0.000 | 0.000
0.000 | 0.000
0.000 | 0.000
0.471 | 0.506
0.000 | 0.000
19peptides
spectra
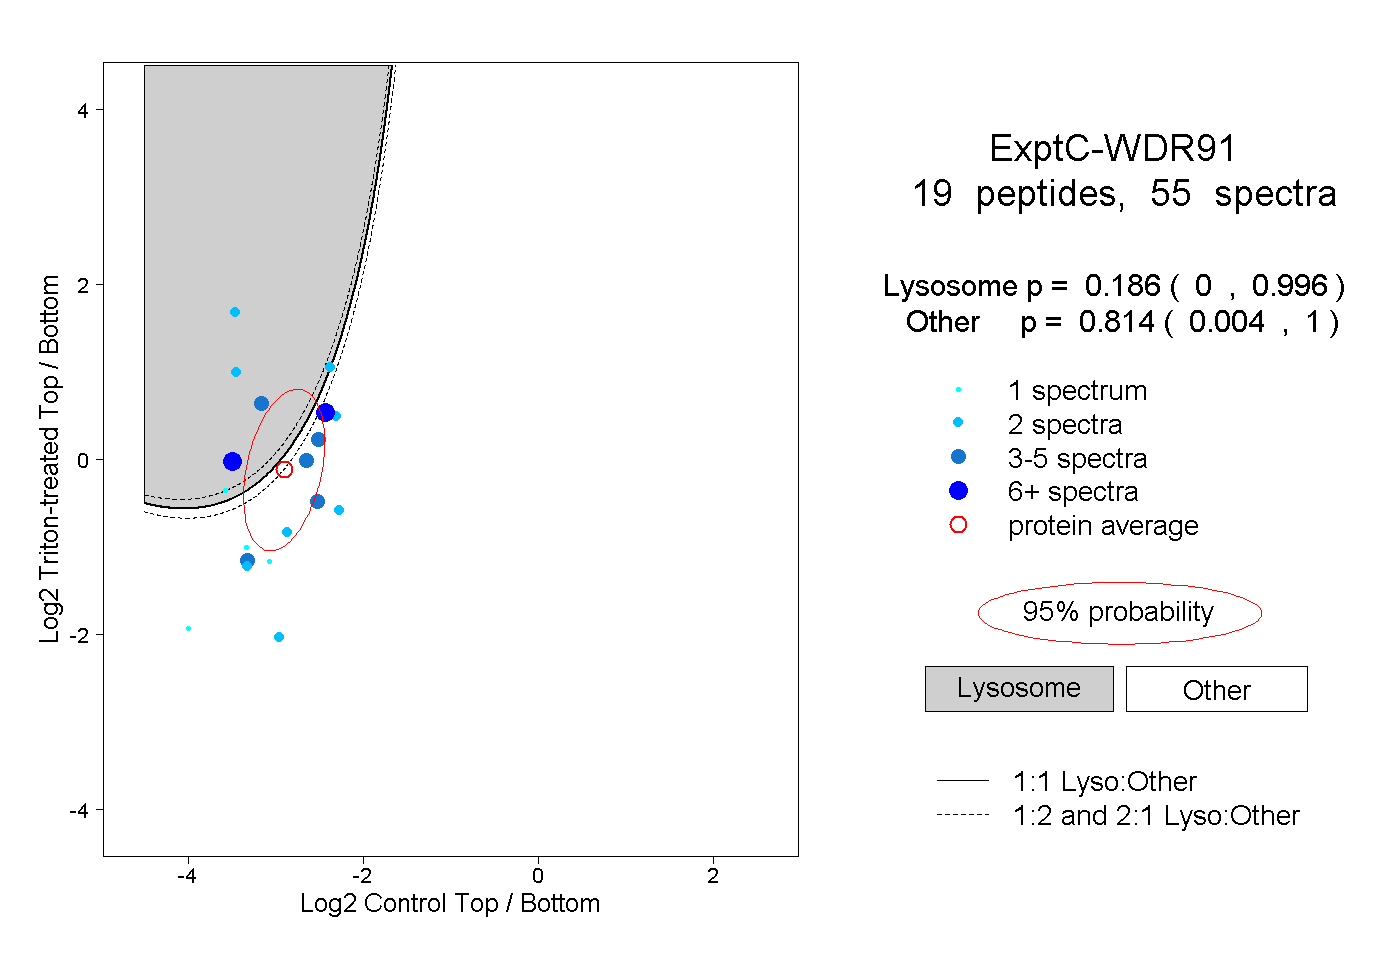
0.000 | 0.996
0.004 | 1.000
1peptide
spectra
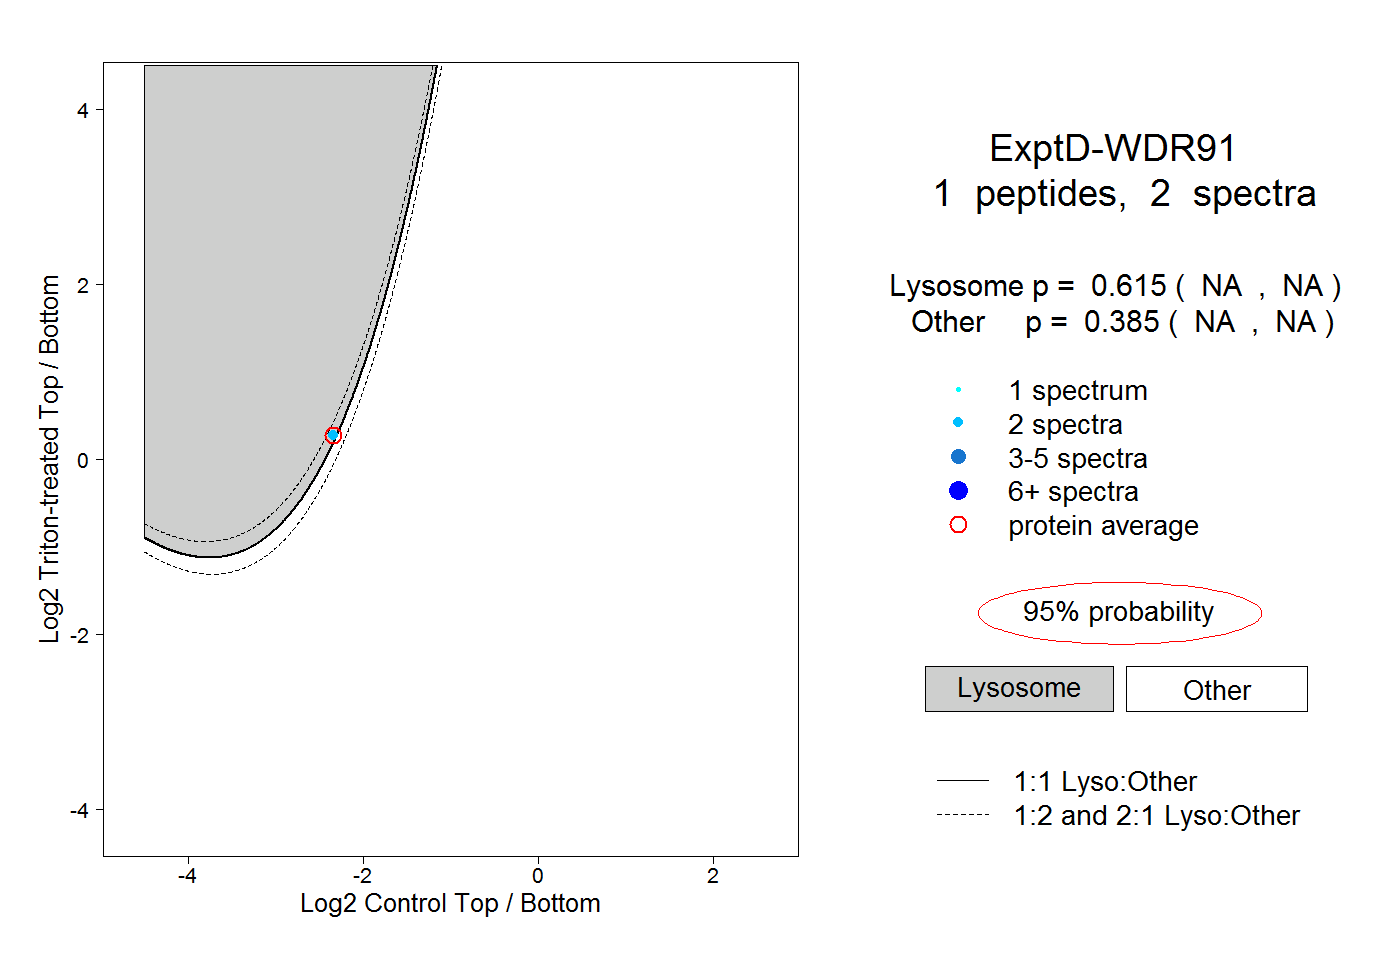
NA | NA
NA | NA