WDR91
[ENSRNOP00000014010]
Main page
| | | Plot |
Mito |
Lyso |
|
Perox |
ER |
Golgi |
PM |
Cytosol |
Nucleus |
|
| Expt A |
 14
14
peptides |
36
spectra |
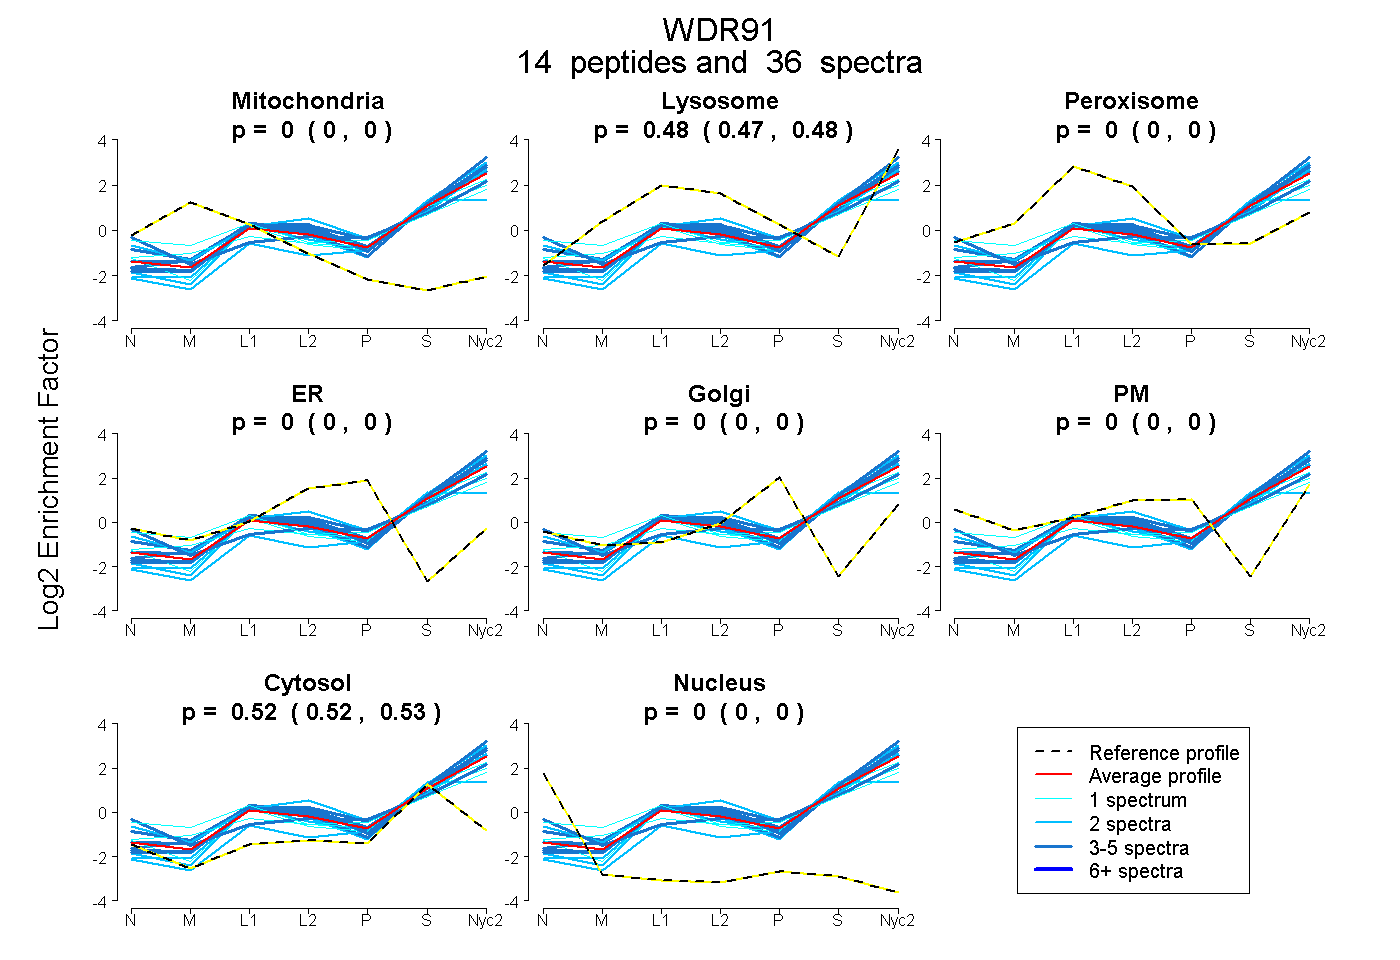 |
0.000
0.000 | 0.000 |
0.478
0.473 | 0.482 |
|
0.000
0.000 | 0.000 |
0.000
0.000 | 0.000 |
0.000
0.000 | 0.000 |
0.000
0.000 | 0.000 |
0.522
0.517 | 0.526 |
0.000
0.000 | 0.000 |
|
| | | Plot |
Mito |
|
Lyso or Perox |
|
ER |
Golgi |
PM |
Cytosol |
Nucleus |
|
| Expt B |
4
peptides |
6
spectra |
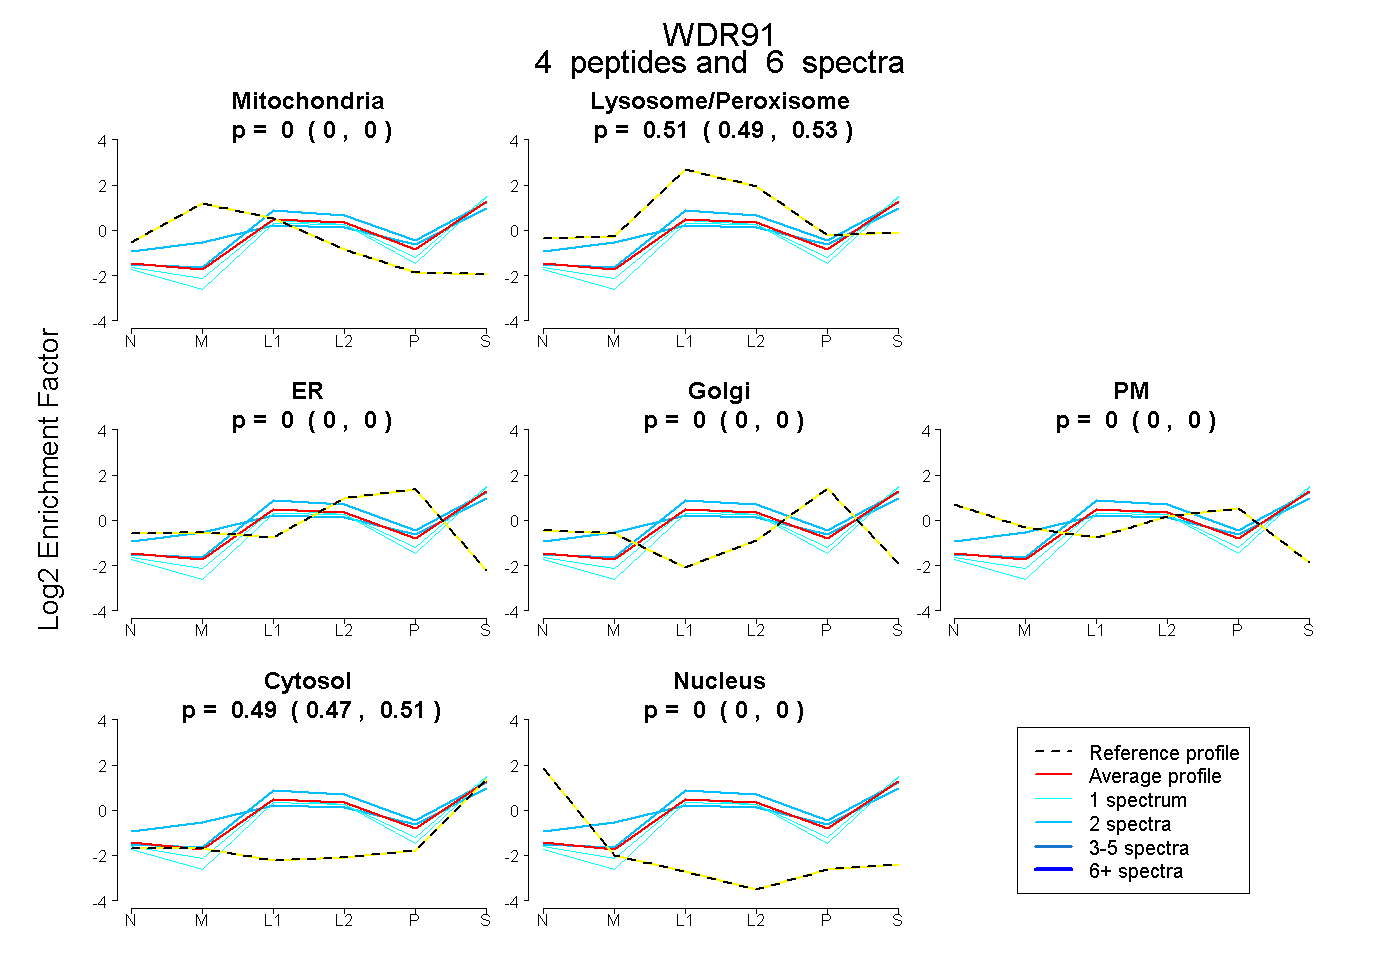 |
0.000
0.000 | 0.000 |
|
0.510
0.491 | 0.526 |
|
0.000
0.000 | 0.000 |
0.000
0.000 | 0.000 |
0.000
0.000 | 0.000 |
0.490
0.471 | 0.506 |
0.000
0.000 | 0.000 |
|
| 2 spectra, EYLLFR |
0.000 |
|
0.593 |
|
0.000 |
0.000 |
0.000 |
0.407 |
0.000 |
|
| 1 spectrum, LLLLGSGVGTVR |
0.000 |
|
0.436 |
|
0.000 |
0.000 |
0.000 |
0.564 |
0.000 |
|
| 1 spectrum, TNQVQEENEVLR |
0.000 |
|
0.460 |
|
0.000 |
0.000 |
0.000 |
0.540 |
0.000 |
|
| 2 spectra, LFALQAEVHR |
0.000 |
|
0.521 |
|
0.000 |
0.021 |
0.000 |
0.458 |
0.000 |
|
| | | Plot |
|
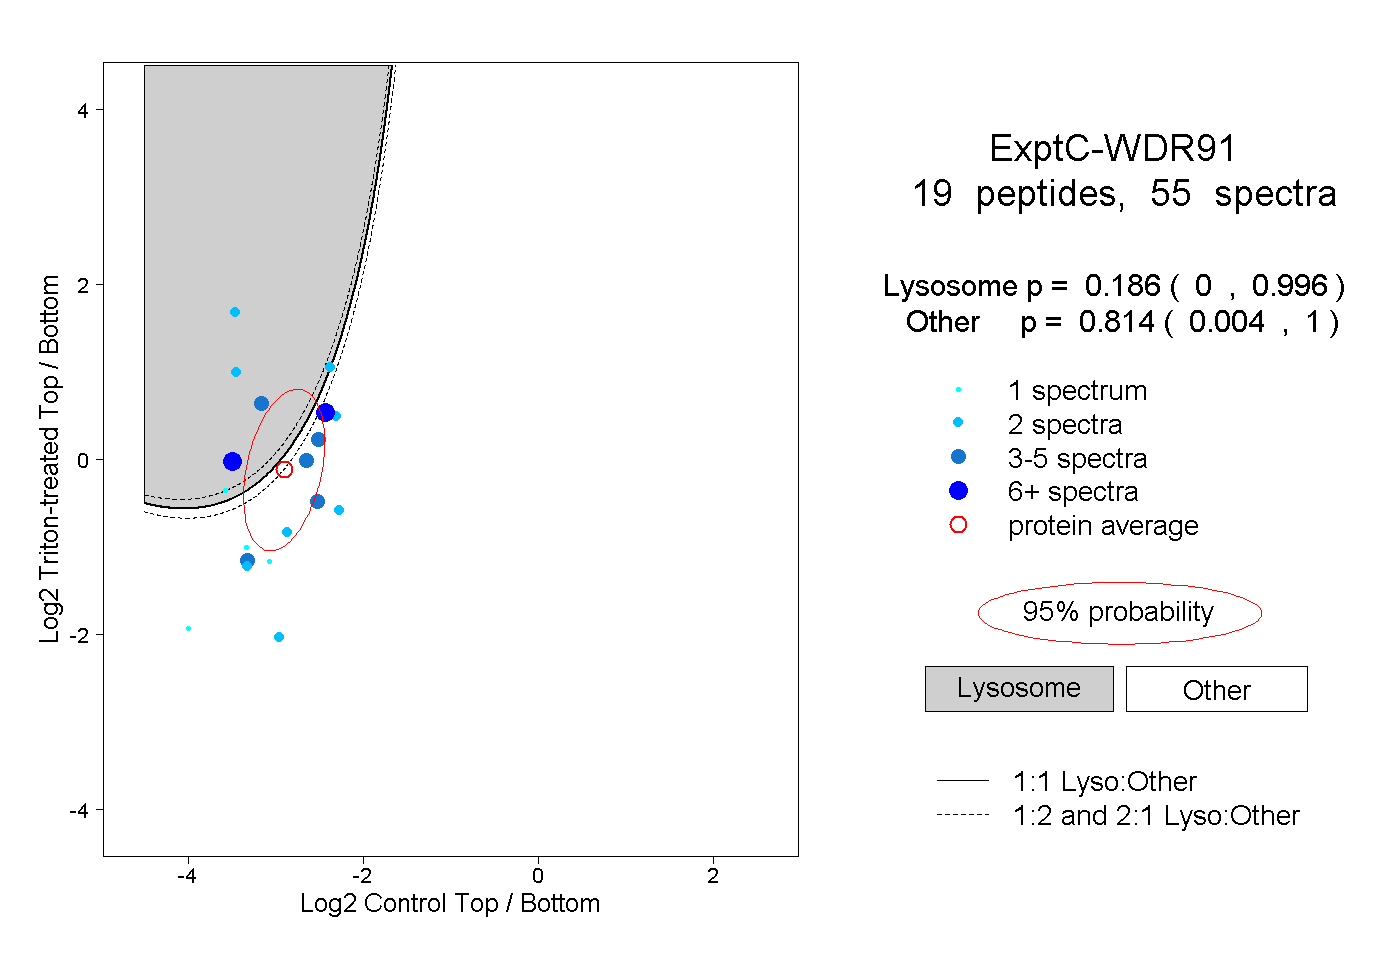
Lyso |
|
|
|
|
|
|
|
Other |
| Expt C |
19
peptides |
55
spectra |
 |
|
0.186
0.000 | 0.996 |
|
|
|
|
|
|
|
0.814
0.004 | 1.000 |
| | | Plot |
|
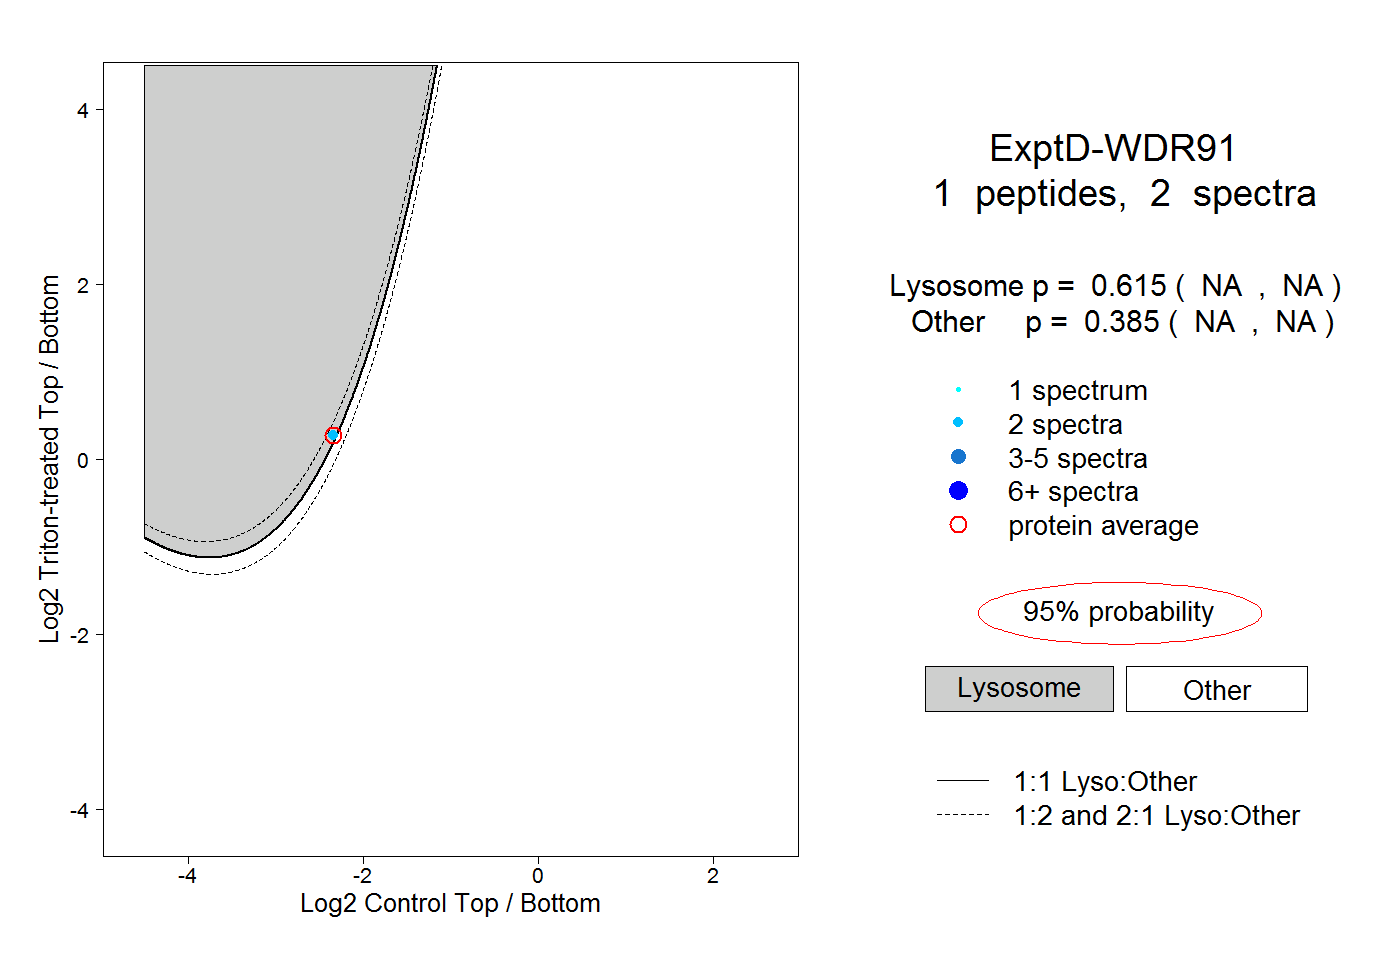
Lyso |
|
|
|
|
|
|
|
Other |
| Expt D |
1
peptide |
2
spectra |
 |
|
0.615
NA | NA |
|
|
|
|
|
|
|
0.385
NA | NA |