 20
20peptides
spectra
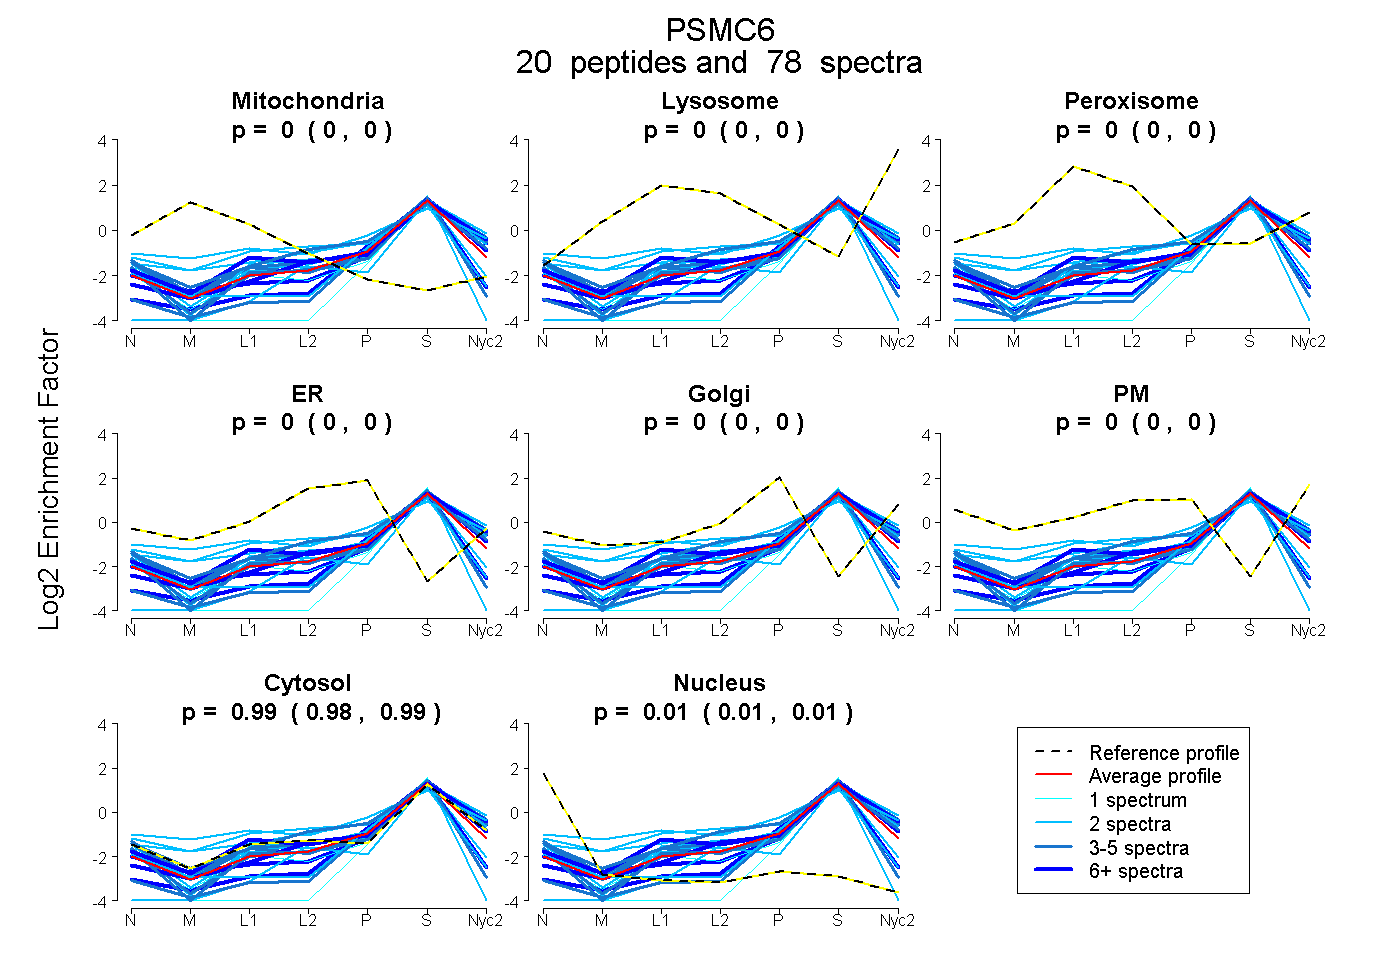
0.000 | 0.000
0.000 | 0.000
0.000 | 0.000
0.000 | 0.000
0.000 | 0.000
0.000 | 0.000
0.985 | 0.994
0.005 | 0.015
7peptides
spectra
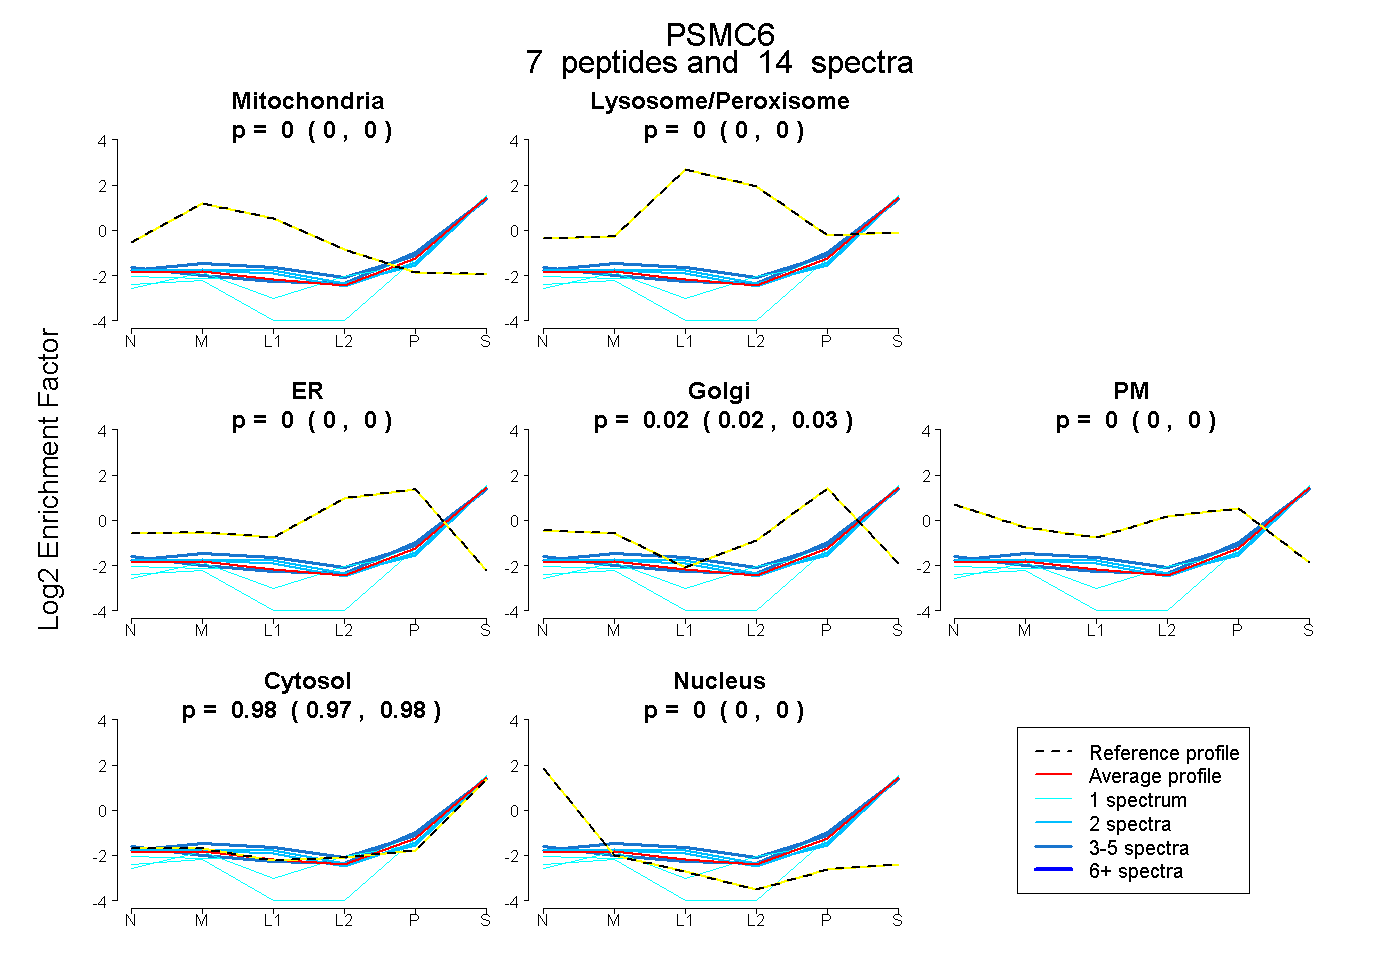
0.000 | 0.000
0.000 | 0.000
0.000 | 0.000
0.016 | 0.032
0.000 | 0.000
0.967 | 0.982
0.000 | 0.000
19peptides
spectra
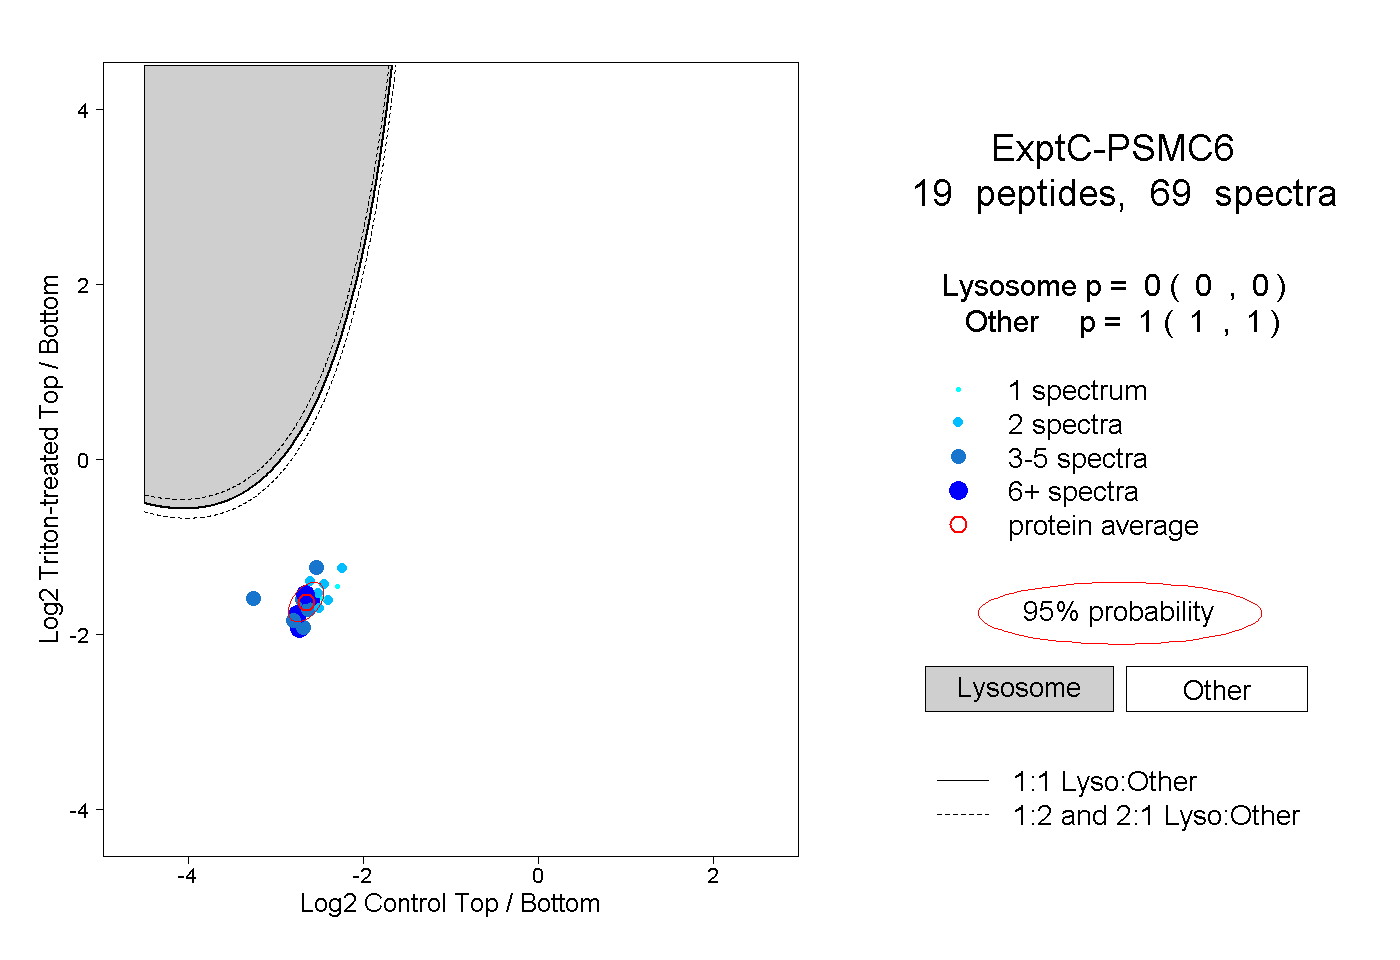
0.000 | 0.000
1.000 | 1.000
2peptides
spectra
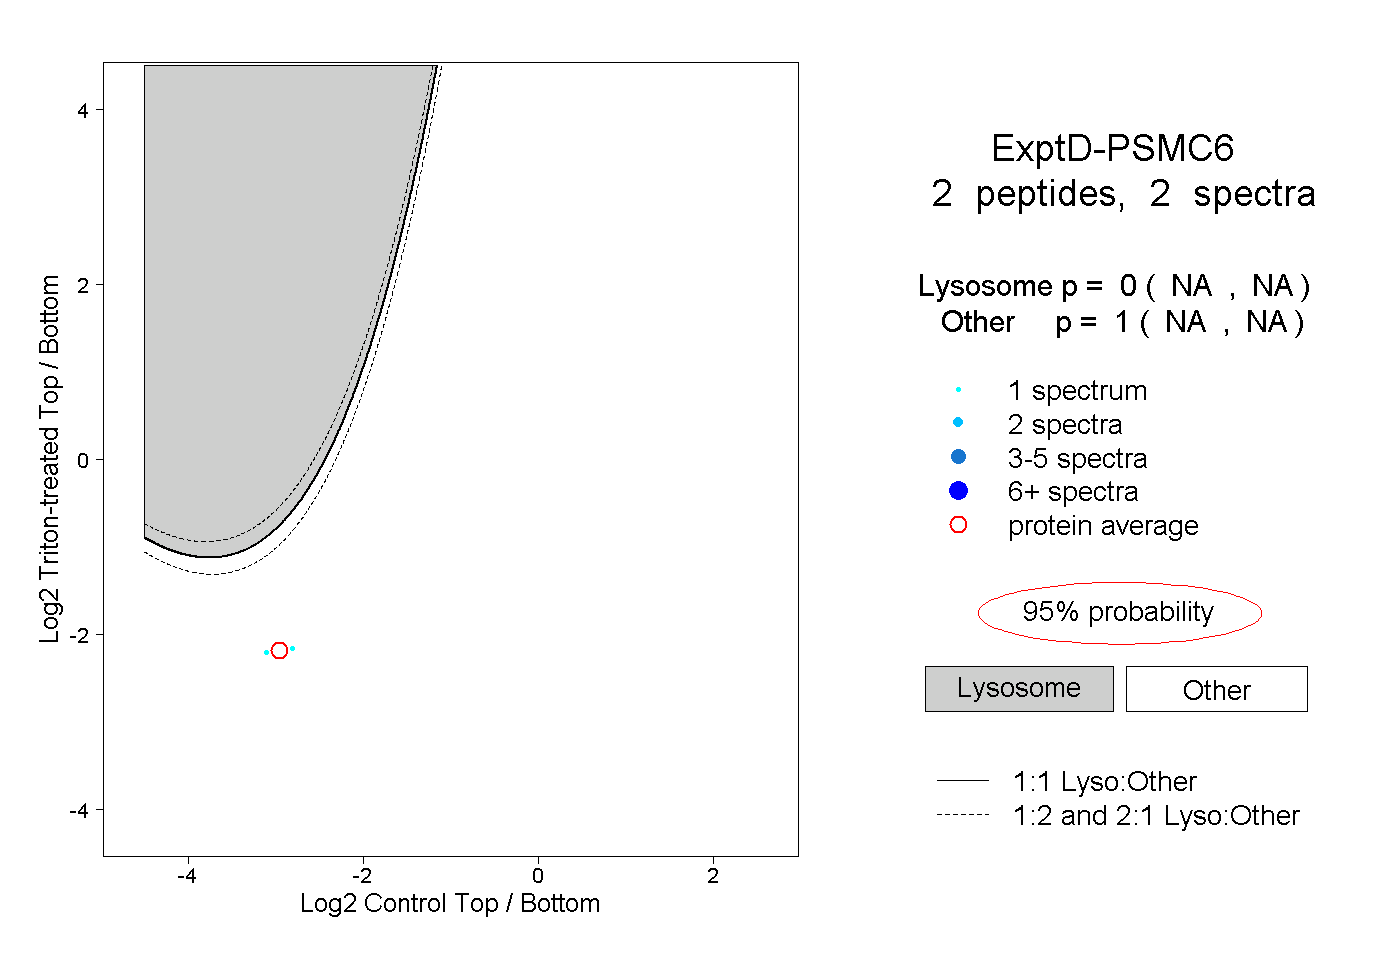
NA | NA
NA | NA