 20
20peptides
spectra
0.000 | 0.000
0.000 | 0.000
0.000 | 0.000
0.000 | 0.000
0.000 | 0.000
0.000 | 0.000
0.985 | 0.994
0.005 | 0.015
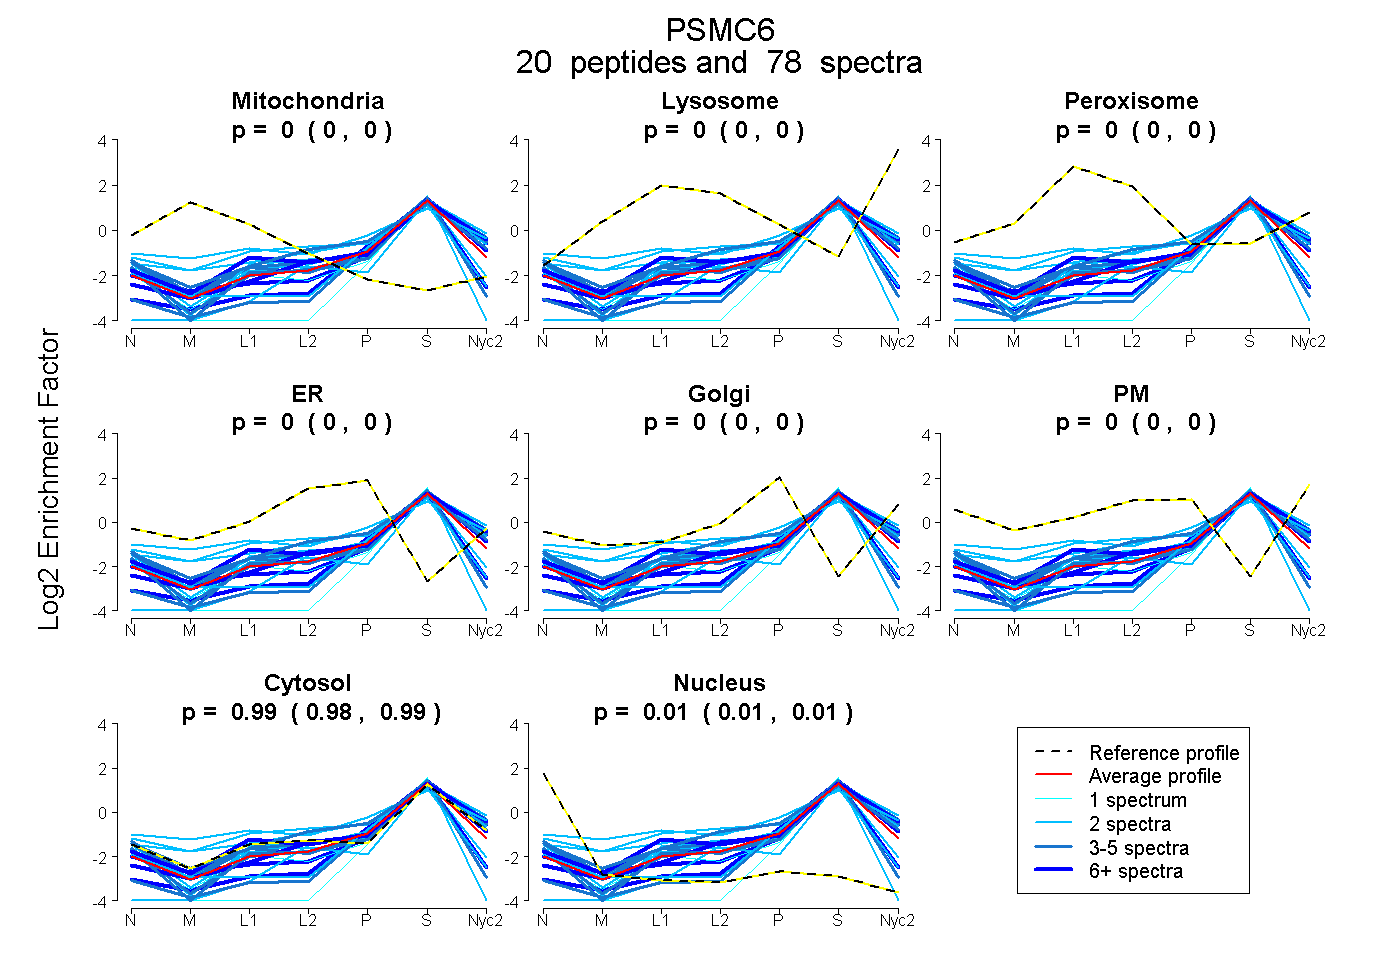
| Plot | Mito | Lyso | Perox | ER | Golgi | PM | Cytosol | Nucleus | |||||
| Expt A |
20 peptides |
78 spectra |
|
0.000 0.000 | 0.000 |
0.000 0.000 | 0.000 |
0.000 0.000 | 0.000 |
0.000 0.000 | 0.000 |
0.000 0.000 | 0.000 |
0.000 0.000 | 0.000 |
0.990 0.985 | 0.994 |
0.010 0.005 | 0.015 |
| 3 spectra, HGEIDYEAIVK | 0.000 | 0.000 | 0.000 | 0.000 | 0.000 | 0.000 | 0.863 | 0.137 | ||
| 5 spectra, FSEGTSADR | 0.000 | 0.000 | 0.000 | 0.000 | 0.038 | 0.000 | 0.962 | 0.000 | ||
| 2 spectra, TLMELLNQMDGFDTLHR | 0.000 | 0.000 | 0.000 | 0.000 | 0.000 | 0.000 | 0.969 | 0.031 | ||
| 4 spectra, LSDGFNGADLR | 0.000 | 0.000 | 0.000 | 0.000 | 0.000 | 0.000 | 1.000 | 0.000 | ||
| 1 spectrum, EVIELPLTNPELFQR | 0.000 | 0.000 | 0.000 | 0.000 | 0.000 | 0.000 | 0.985 | 0.015 | ||
| 2 spectra, IHIDLPNEQAR | 0.000 | 0.035 | 0.000 | 0.013 | 0.111 | 0.000 | 0.841 | 0.000 | ||
| 6 spectra, ADHDFVVQEDFMK | 0.000 | 0.000 | 0.000 | 0.000 | 0.000 | 0.000 | 1.000 | 0.000 | ||
| 1 spectrum, ALQSVGQIVGEVLK | 0.000 | 0.000 | 0.000 | 0.000 | 0.000 | 0.000 | 0.786 | 0.214 | ||
| 6 spectra, DHQPCIIFMDEIDAIGGR | 0.000 | 0.000 | 0.000 | 0.000 | 0.000 | 0.000 | 0.865 | 0.135 | ||
| 5 spectra, YVVGCR | 0.000 | 0.000 | 0.000 | 0.042 | 0.071 | 0.000 | 0.887 | 0.000 | ||
| 13 spectra, VALDMTTLTIMR | 0.000 | 0.037 | 0.000 | 0.000 | 0.000 | 0.000 | 0.963 | 0.000 | ||
| 2 spectra, ELTEEK | 0.000 | 0.000 | 0.000 | 0.000 | 0.000 | 0.000 | 1.000 | 0.000 | ||
| 2 spectra, AVASQLDCNFLK | 0.000 | 0.000 | 0.000 | 0.000 | 0.000 | 0.000 | 0.903 | 0.097 | ||
| 2 spectra, GCLLYGPPGTGK | 0.000 | 0.000 | 0.000 | 0.000 | 0.000 | 0.000 | 0.940 | 0.060 | ||
| 2 spectra, YIGESAR | 0.002 | 0.006 | 0.116 | 0.000 | 0.177 | 0.000 | 0.698 | 0.000 | ||
| 12 spectra, MIMATNRPDTLDPALLRPGR | 0.000 | 0.000 | 0.000 | 0.000 | 0.000 | 0.000 | 1.000 | 0.000 | ||
| 2 spectra, NVCTEAGMFAIR | 0.112 | 0.000 | 0.000 | 0.091 | 0.000 | 0.000 | 0.792 | 0.004 | ||
| 3 spectra, EMFNYAR | 0.000 | 0.000 | 0.000 | 0.000 | 0.002 | 0.000 | 0.994 | 0.004 | ||
| 3 spectra, QLTEEK | 0.000 | 0.000 | 0.000 | 0.000 | 0.000 | 0.000 | 1.000 | 0.000 | ||
| 2 spectra, IHAGPITK | 0.000 | 0.000 | 0.000 | 0.000 | 0.000 | 0.000 | 1.000 | 0.000 |
| Plot | Mito | Lyso or Perox | ER | Golgi | PM | Cytosol | Nucleus | ||||||
| Expt B |
7 peptides |
14 spectra |
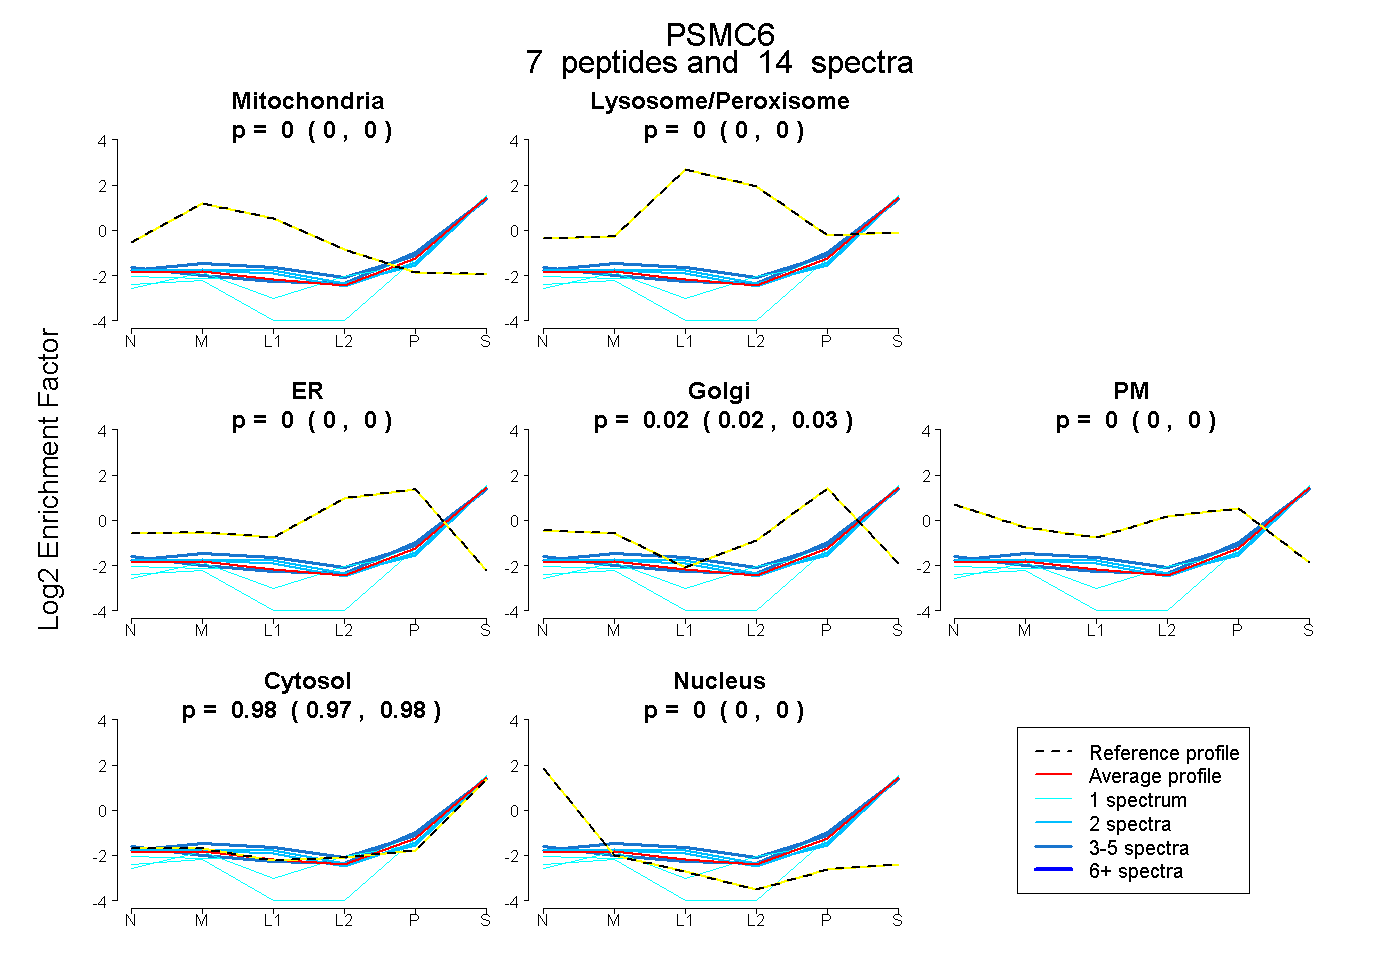 |
0.000 0.000 | 0.000 |
0.000 0.000 | 0.000 |
0.000 0.000 | 0.000 |
0.025 0.016 | 0.032 |
0.000 0.000 | 0.000 |
0.975 0.967 | 0.982 |
0.000 0.000 | 0.000 |
|||
| Plot | Lyso | Other | |||||||||||
| Expt C |
19 peptides |
69 spectra |
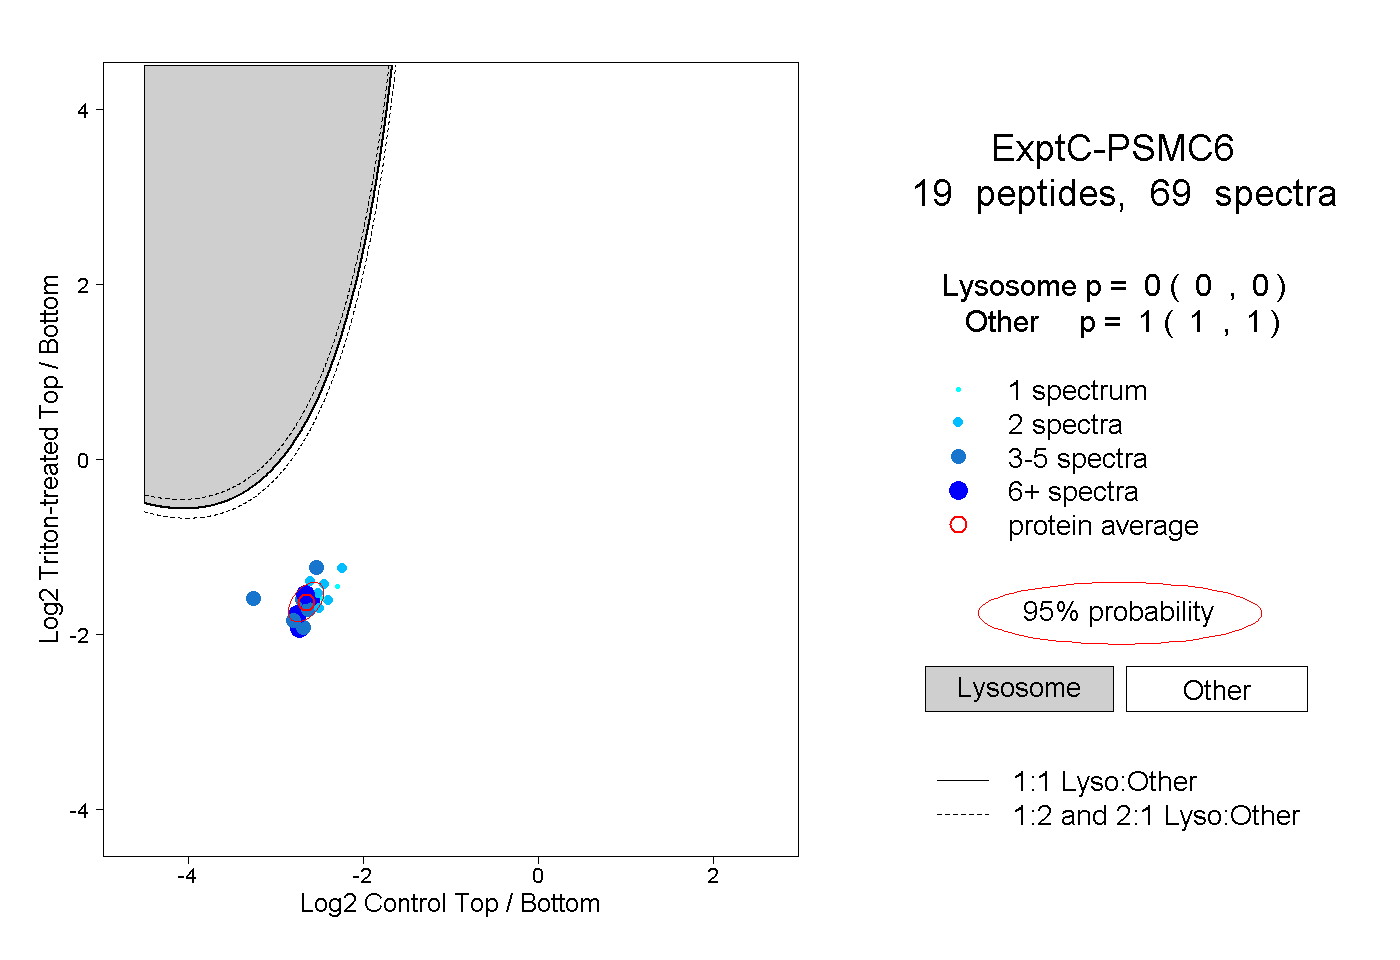 |
0.000 0.000 | 0.000 |
1.000 1.000 | 1.000 |
||||||||
| Plot | Lyso | Other | |||||||||||
| Expt D |
2 peptides |
2 spectra |
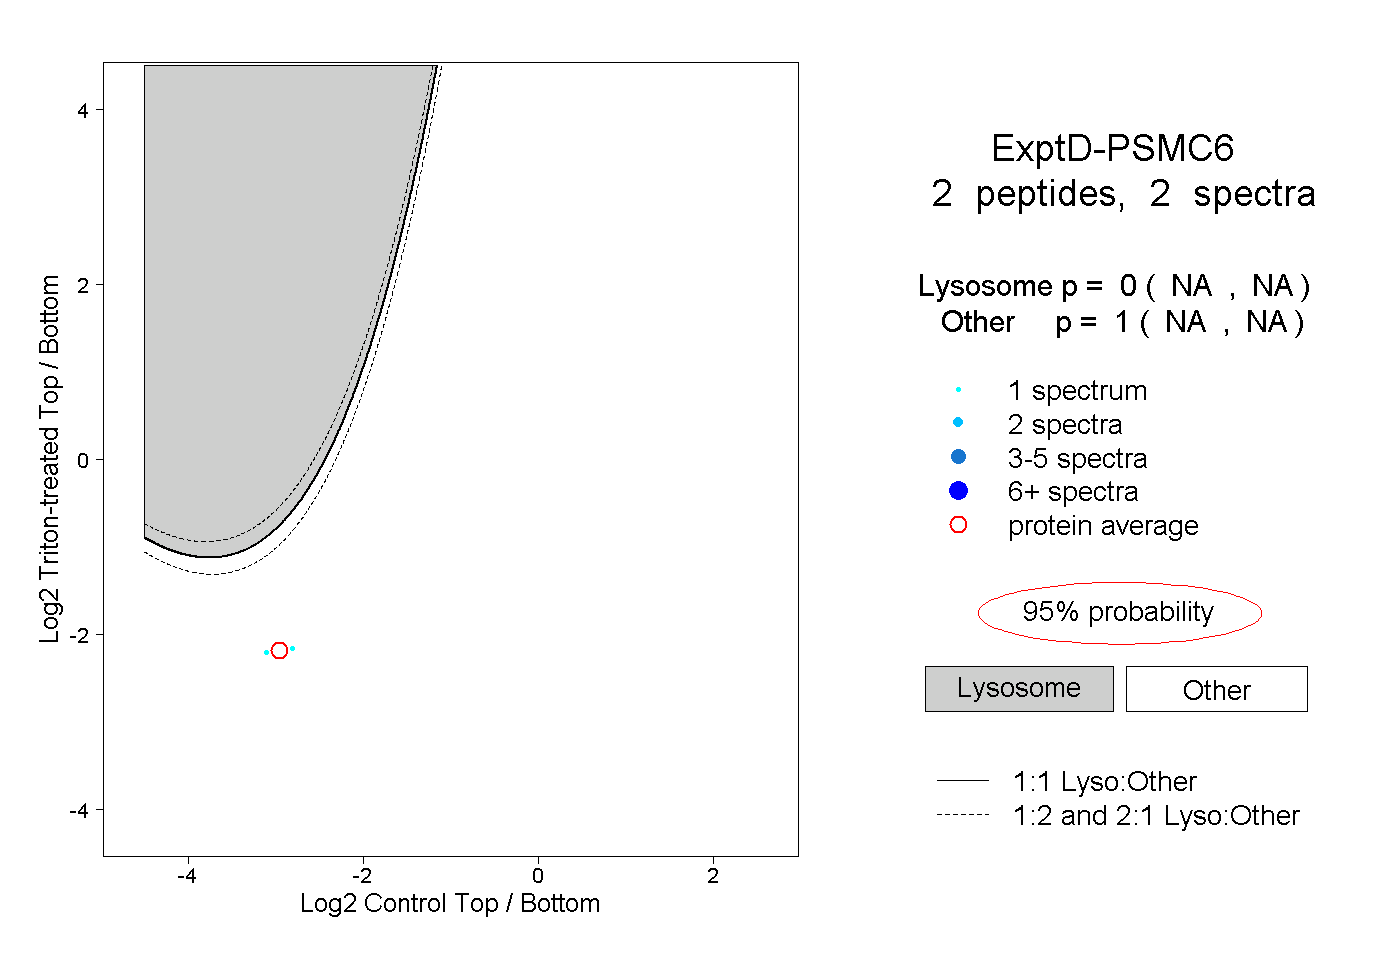 |
0.000 NA | NA |
1.000 NA | NA |