 27
27peptides
spectra
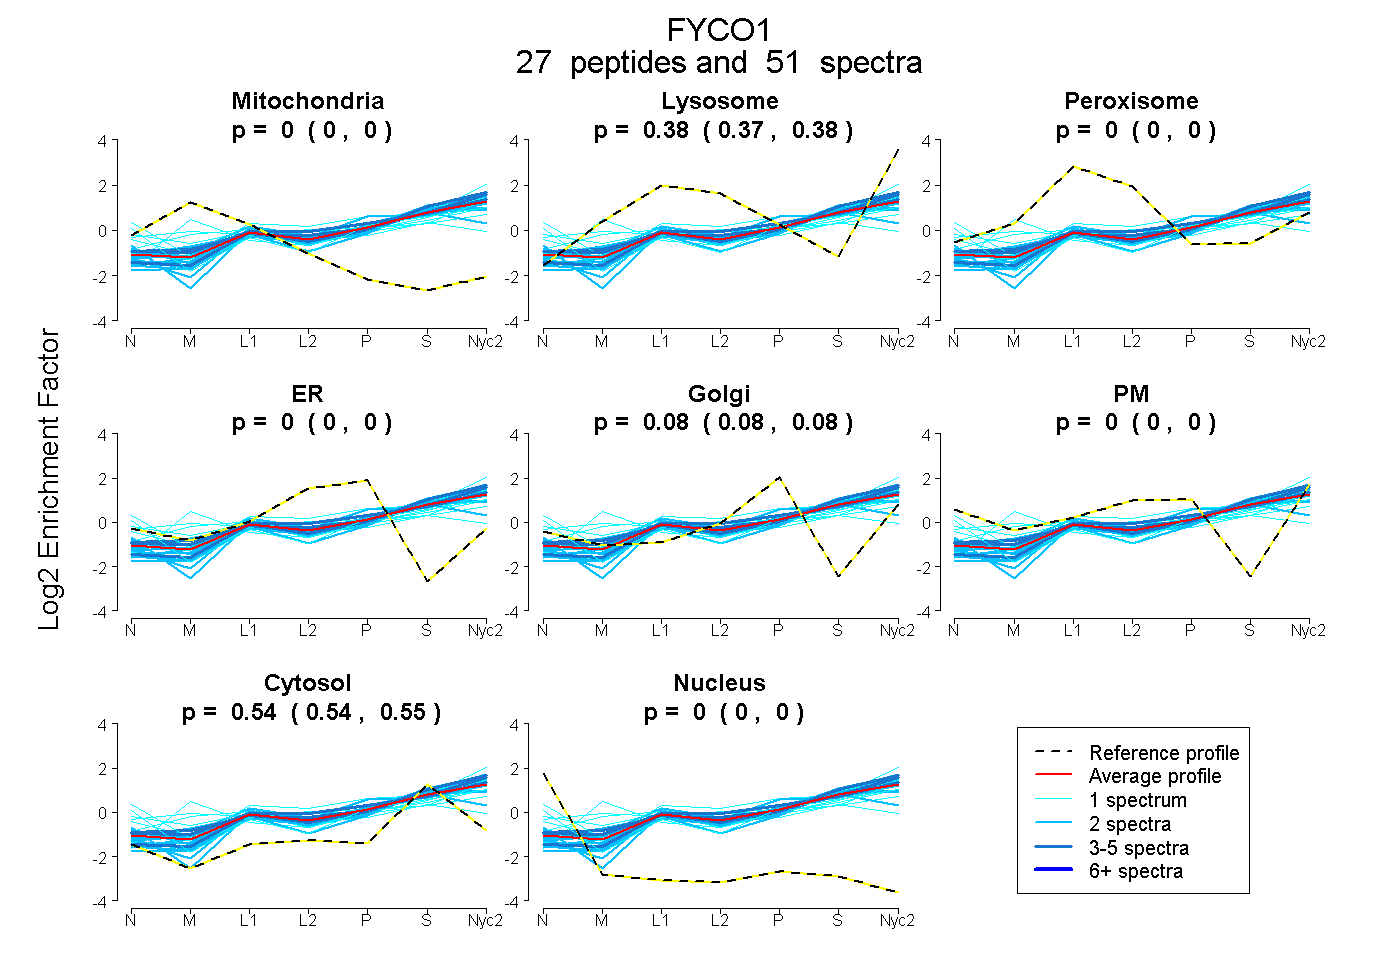
0.000 | 0.000
0.374 | 0.381
0.000 | 0.000
0.000 | 0.000
0.076 | 0.082
0.000 | 0.000
0.540 | 0.545
0.000 | 0.000
11peptides
spectra
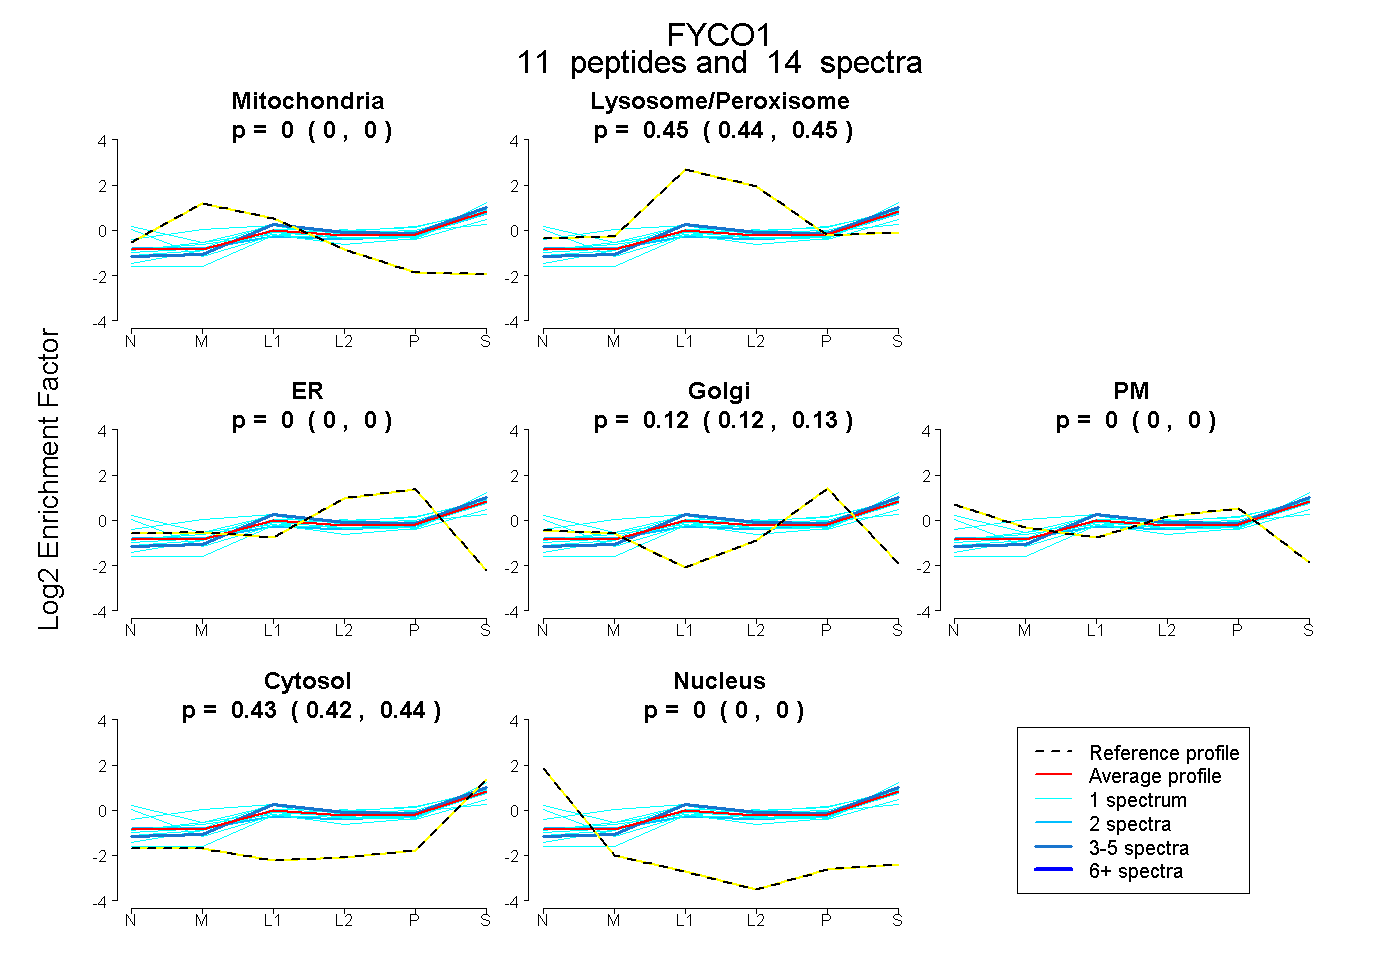
0.000 | 0.000
0.439 | 0.450
0.000 | 0.000
0.115 | 0.132
0.000 | 0.000
0.422 | 0.438
0.000 | 0.000
38peptides
spectra
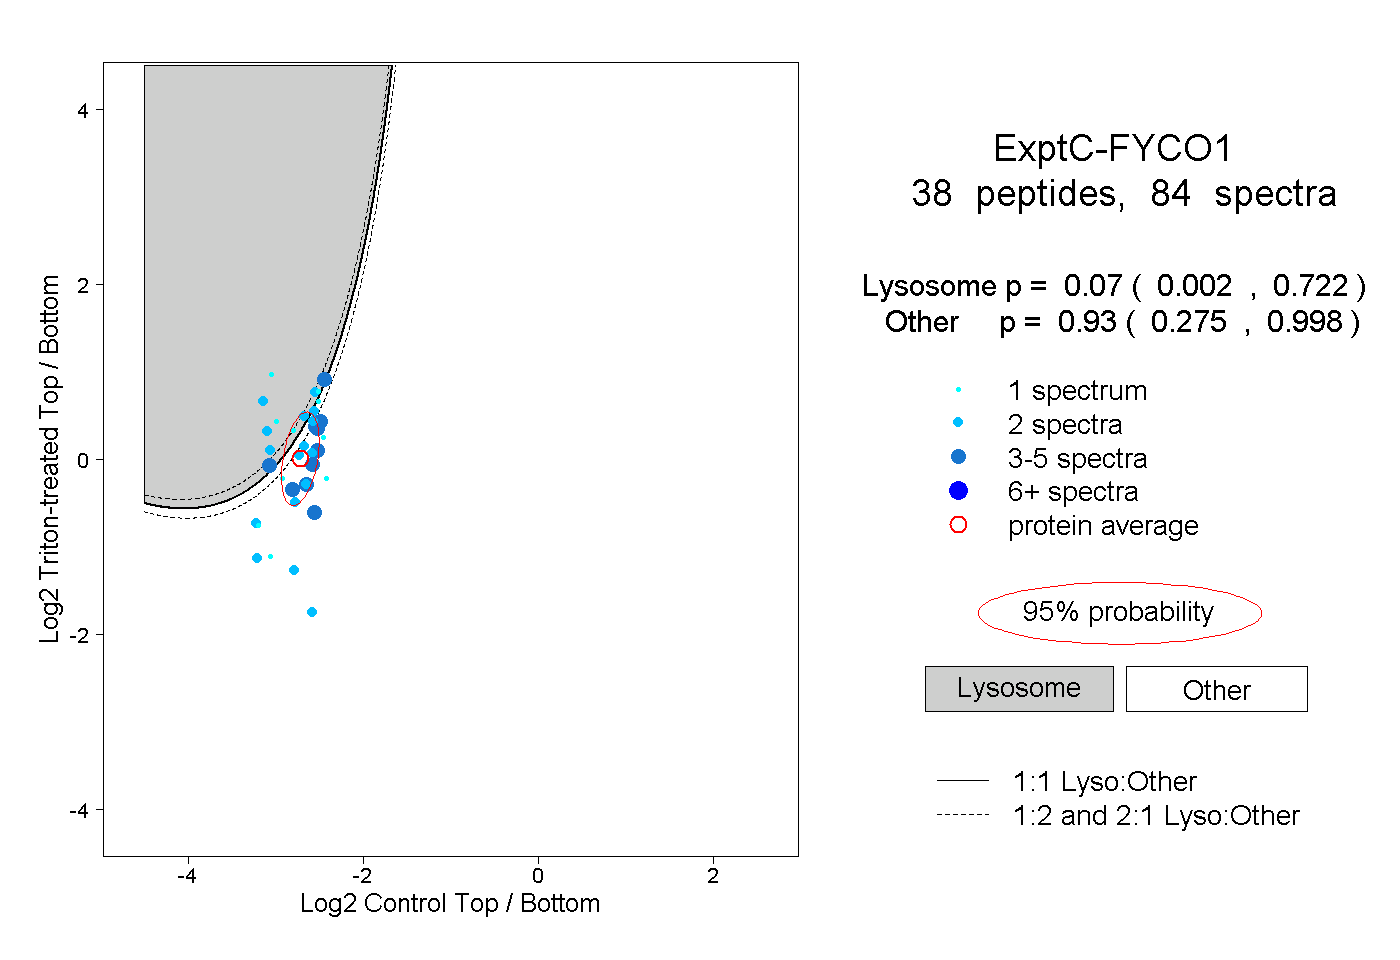
0.002 | 0.722
0.275 | 0.998
9peptides
spectra
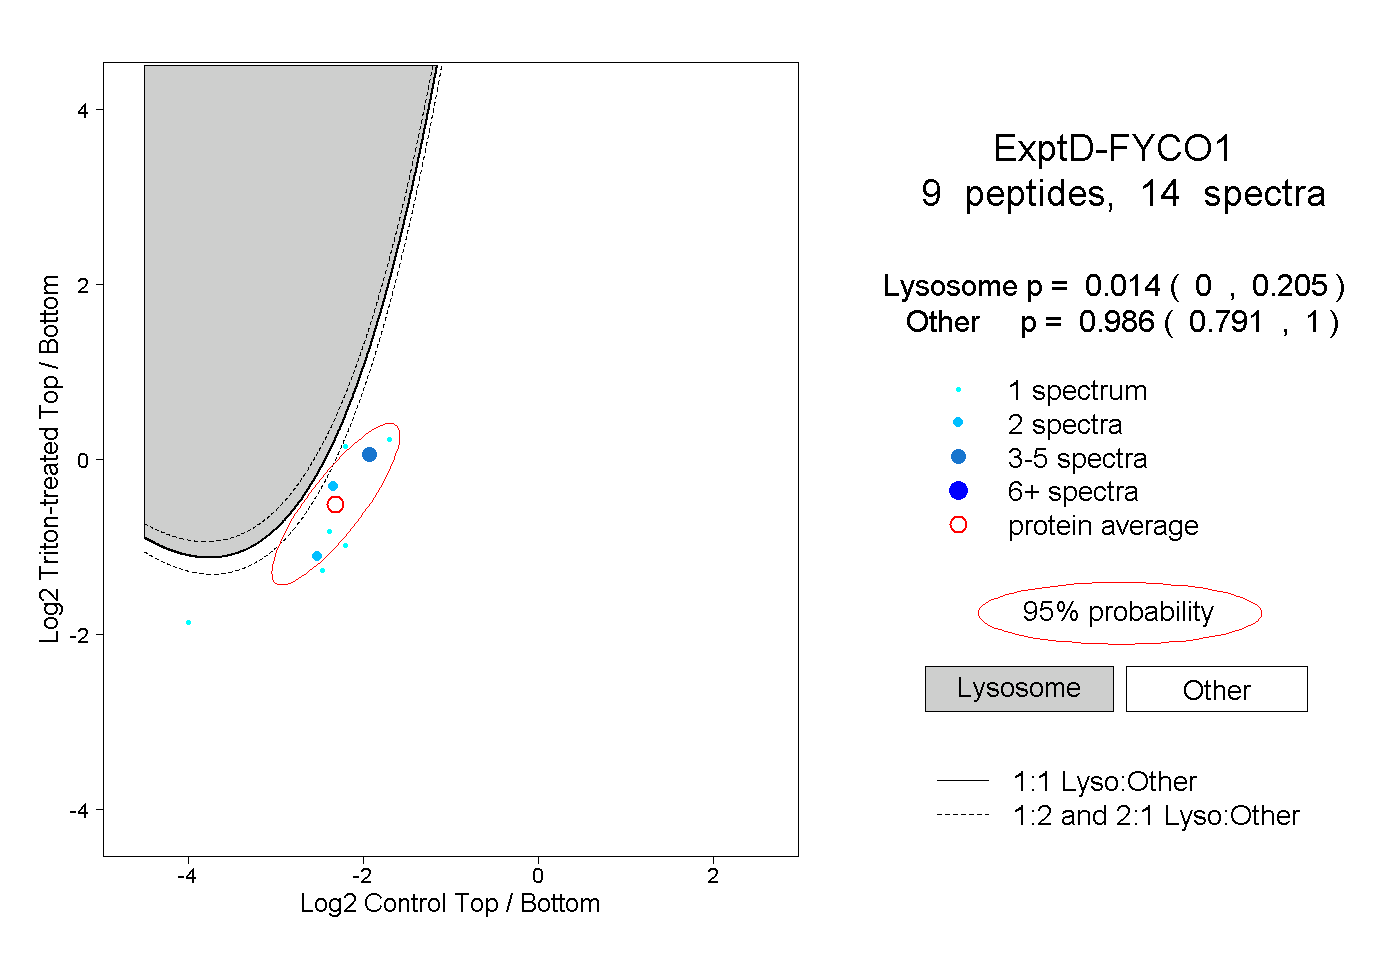
0.000 | 0.205
0.791 | 1.000