FYCO1
[ENSRNOP00000008630]
Main page
| | | Plot |
Mito |
Lyso |
|
Perox |
ER |
Golgi |
PM |
Cytosol |
Nucleus |
|
| Expt A |
 27
27
peptides |
51
spectra |
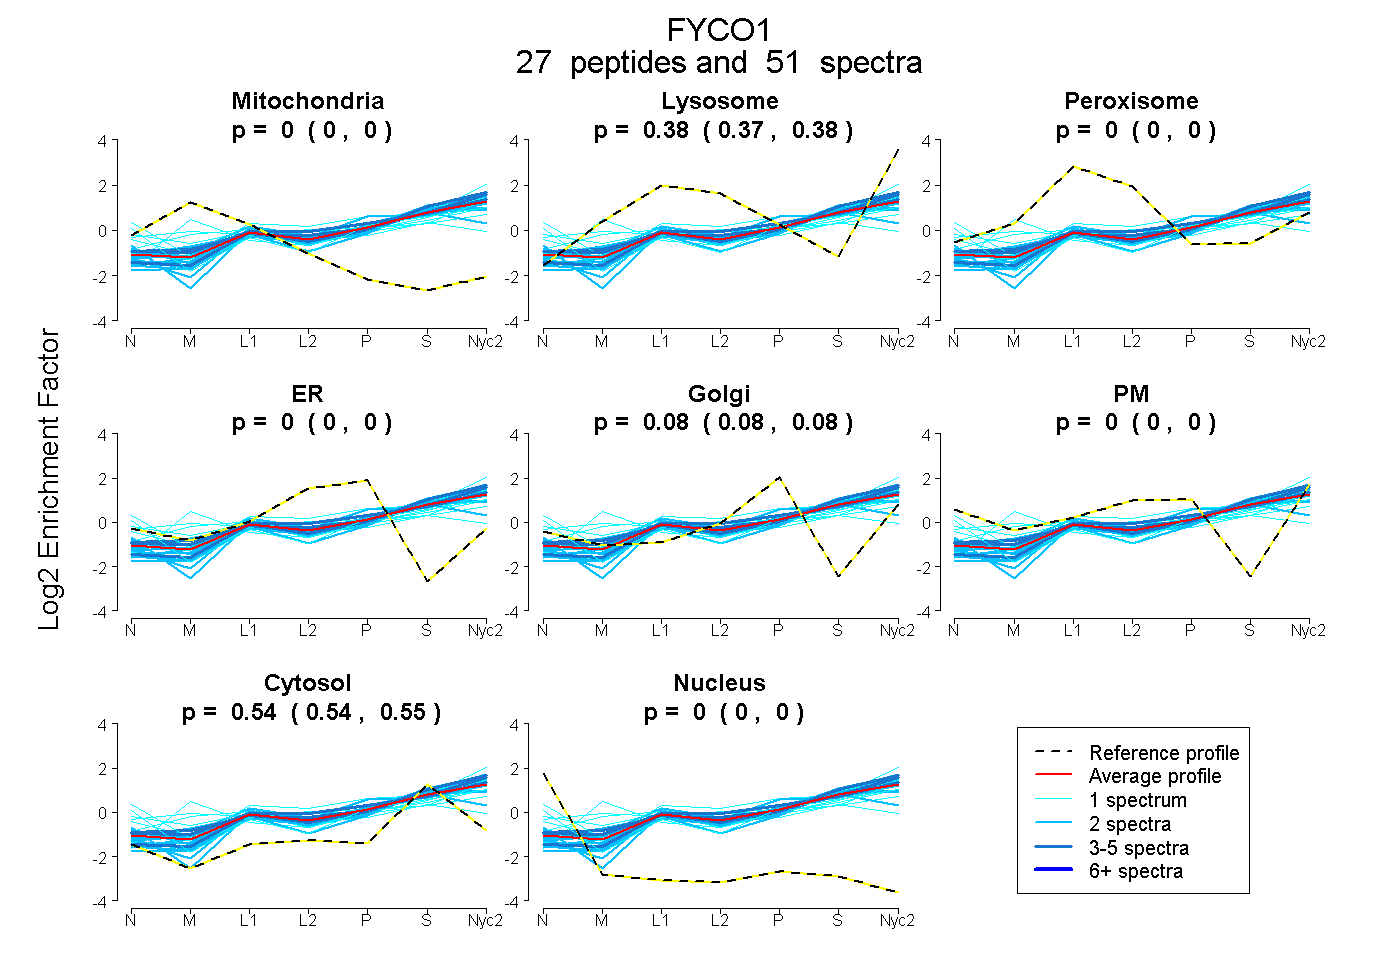 |
0.000
0.000 | 0.000 |
0.378
0.374 | 0.381 |
|
0.000
0.000 | 0.000 |
0.000
0.000 | 0.000 |
0.079
0.076 | 0.082 |
0.000
0.000 | 0.000 |
0.543
0.540 | 0.545 |
0.000
0.000 | 0.000 |
|
| | | Plot |
Mito |
|
Lyso or Perox |
|
ER |
Golgi |
PM |
Cytosol |
Nucleus |
|
| Expt B |
11
peptides |
14
spectra |
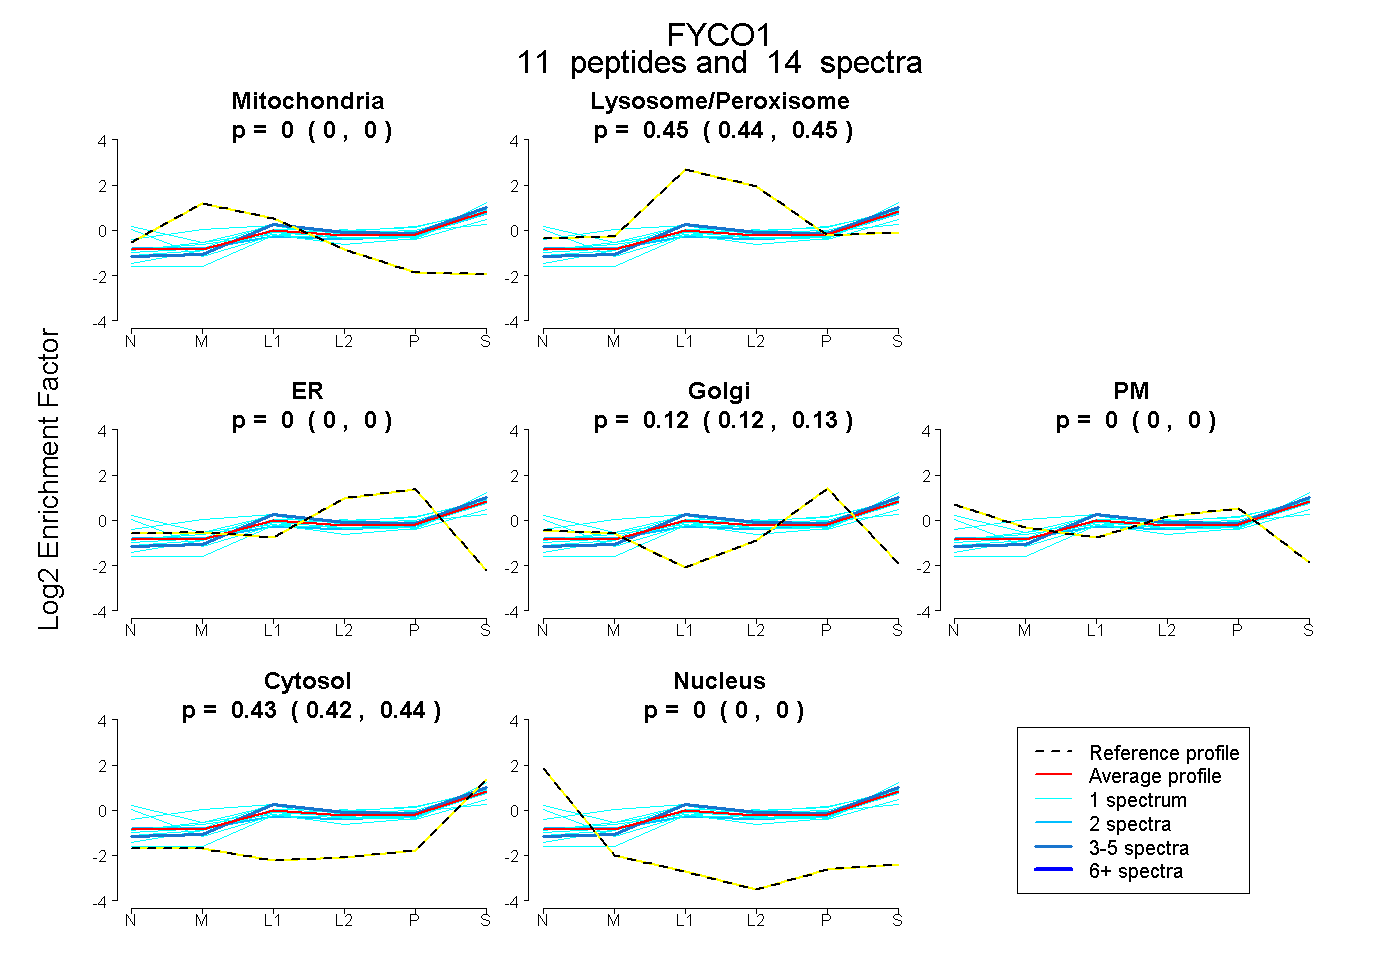 |
0.000
0.000 | 0.000 |
|
0.445
0.439 | 0.450 |
|
0.000
0.000 | 0.000 |
0.124
0.115 | 0.132 |
0.000
0.000 | 0.000 |
0.431
0.422 | 0.438 |
0.000
0.000 | 0.000 |
|
| | | Plot |
|
Lyso |
|
|
|
|
|
|
|
Other |
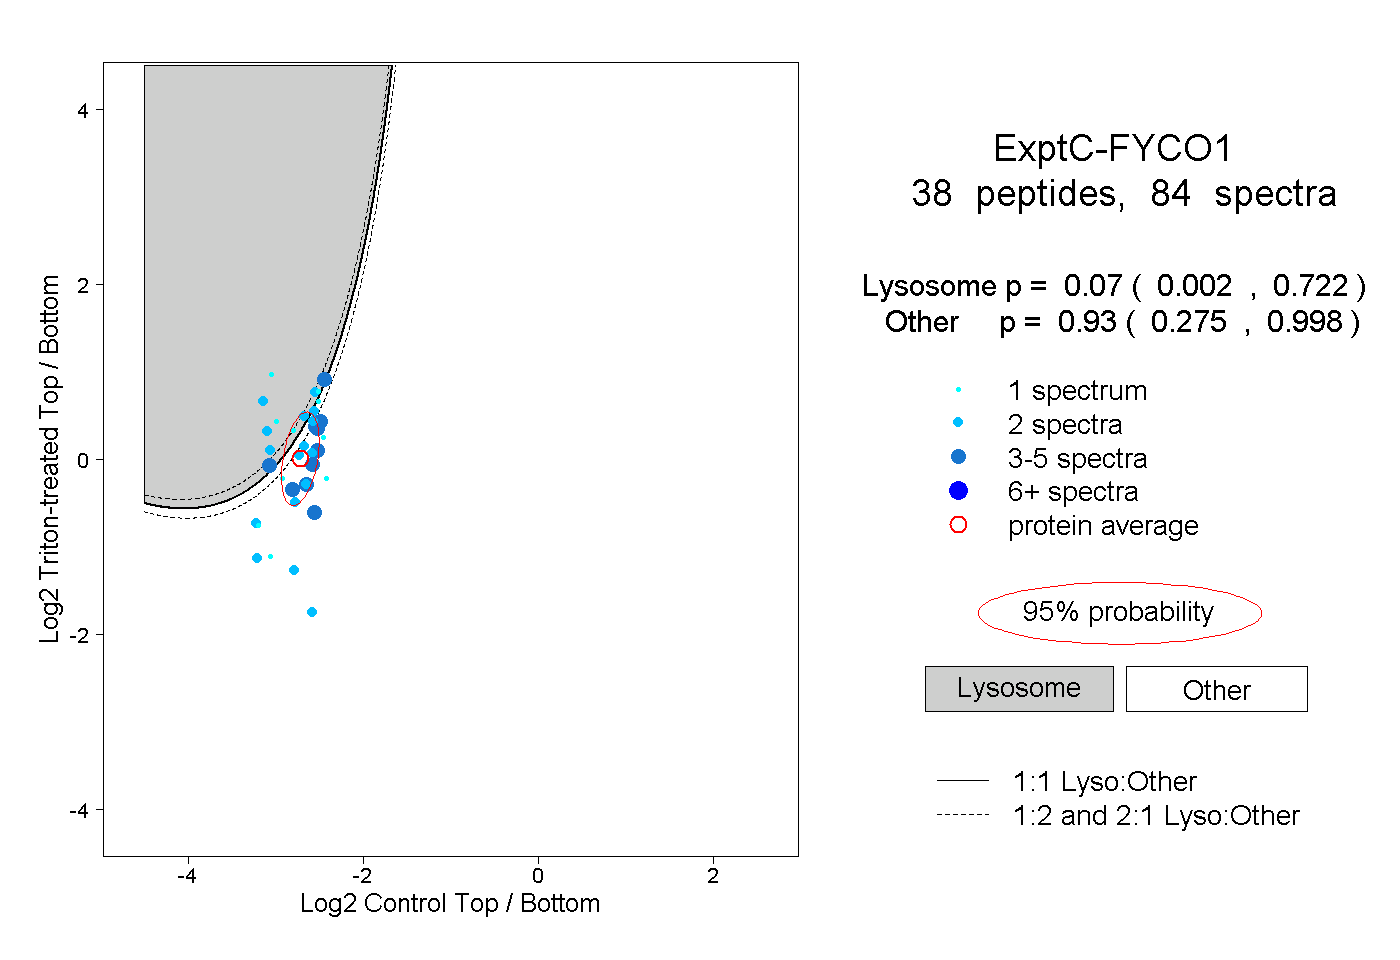
| Expt C |
38
peptides |
84
spectra |
 |
|
0.070
0.002 | 0.722 |
|
|
|
|
|
|
|
0.930
0.275 | 0.998 |
| | | Plot |
|
Lyso |
|
|
|
|
|
|
|
Other |
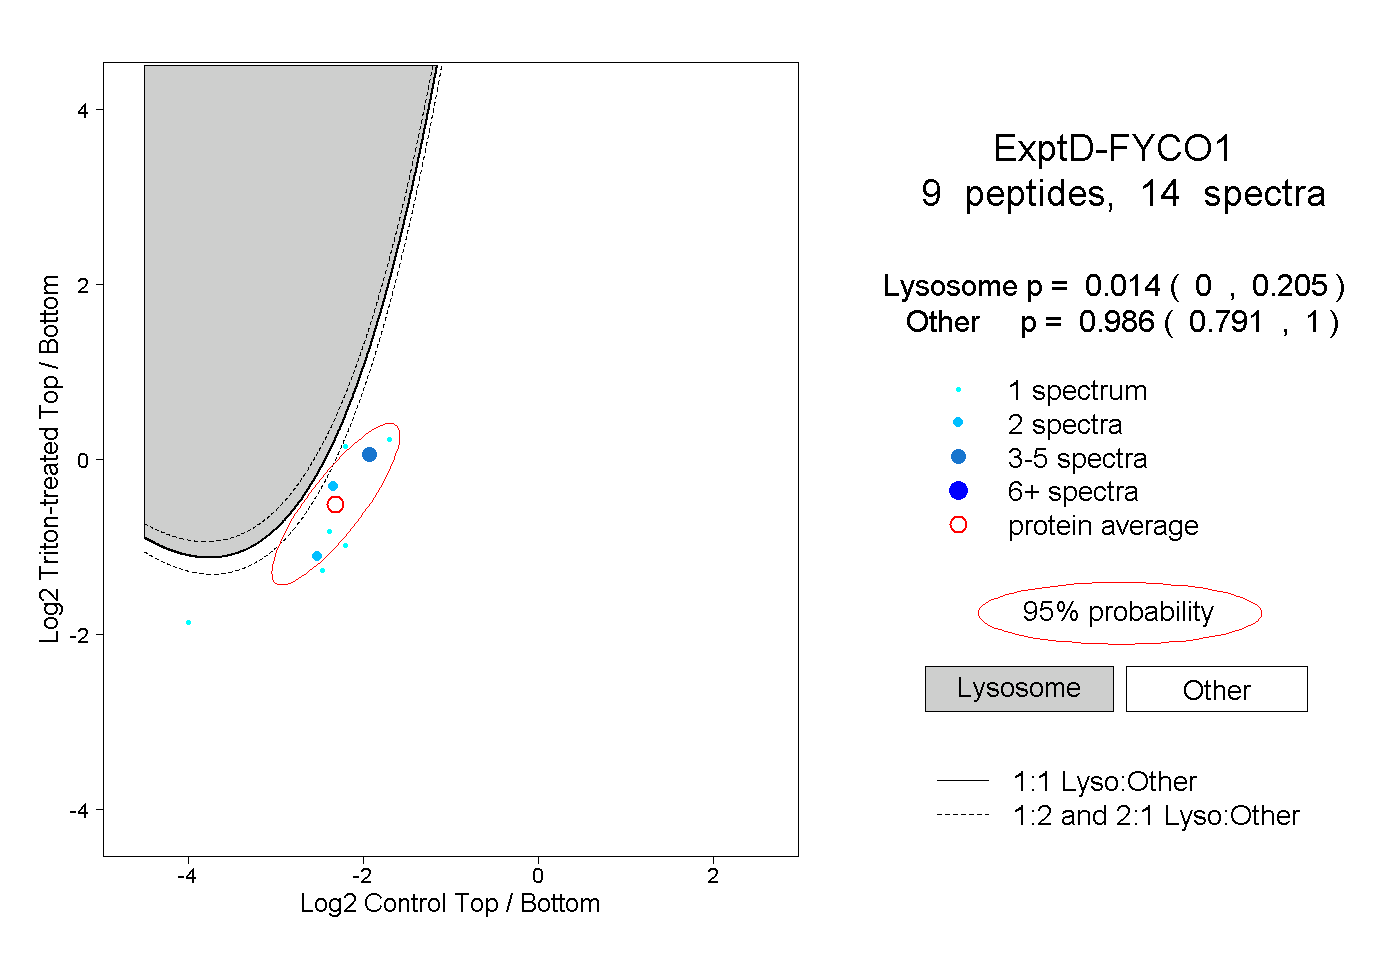
| Expt D |
9
peptides |
14
spectra |
 |
|
0.014
0.000 | 0.205 |
|
|
|
|
|
|
|
0.986
0.791 | 1.000 |
| 1 spectrum, AHIQELLQCSER |
|
0.003 |
|
|
|
|
|
|
|
0.997 |
| 2 spectra, VNQELQK |
|
0.004 |
|
|
|
|
|
|
|
0.996 |
| 1 spectrum, ALQAELSQVR |
|
0.128 |
|
|
|
|
|
|
|
0.872 |
| 1 spectrum, ASLEHLVK |
|
0.001 |
|
|
|
|
|
|
|
0.999 |
| 2 spectra, QEEELR |
|
0.057 |
|
|
|
|
|
|
|
0.943 |
| 4 spectra, EAVQELK |
|
0.002 |
|
|
|
|
|
|
|
0.998 |
| 1 spectrum, LQNEVVDLQAK |
|
0.000 |
|
|
|
|
|
|
|
1.000 |
| 1 spectrum, TANEECGSLR |
|
0.000 |
|
|
|
|
|
|
|
1.000 |
| 1 spectrum, LLELIR |
|
0.005 |
|
|
|
|
|
|
|
0.995 |