 51
51peptides
spectra
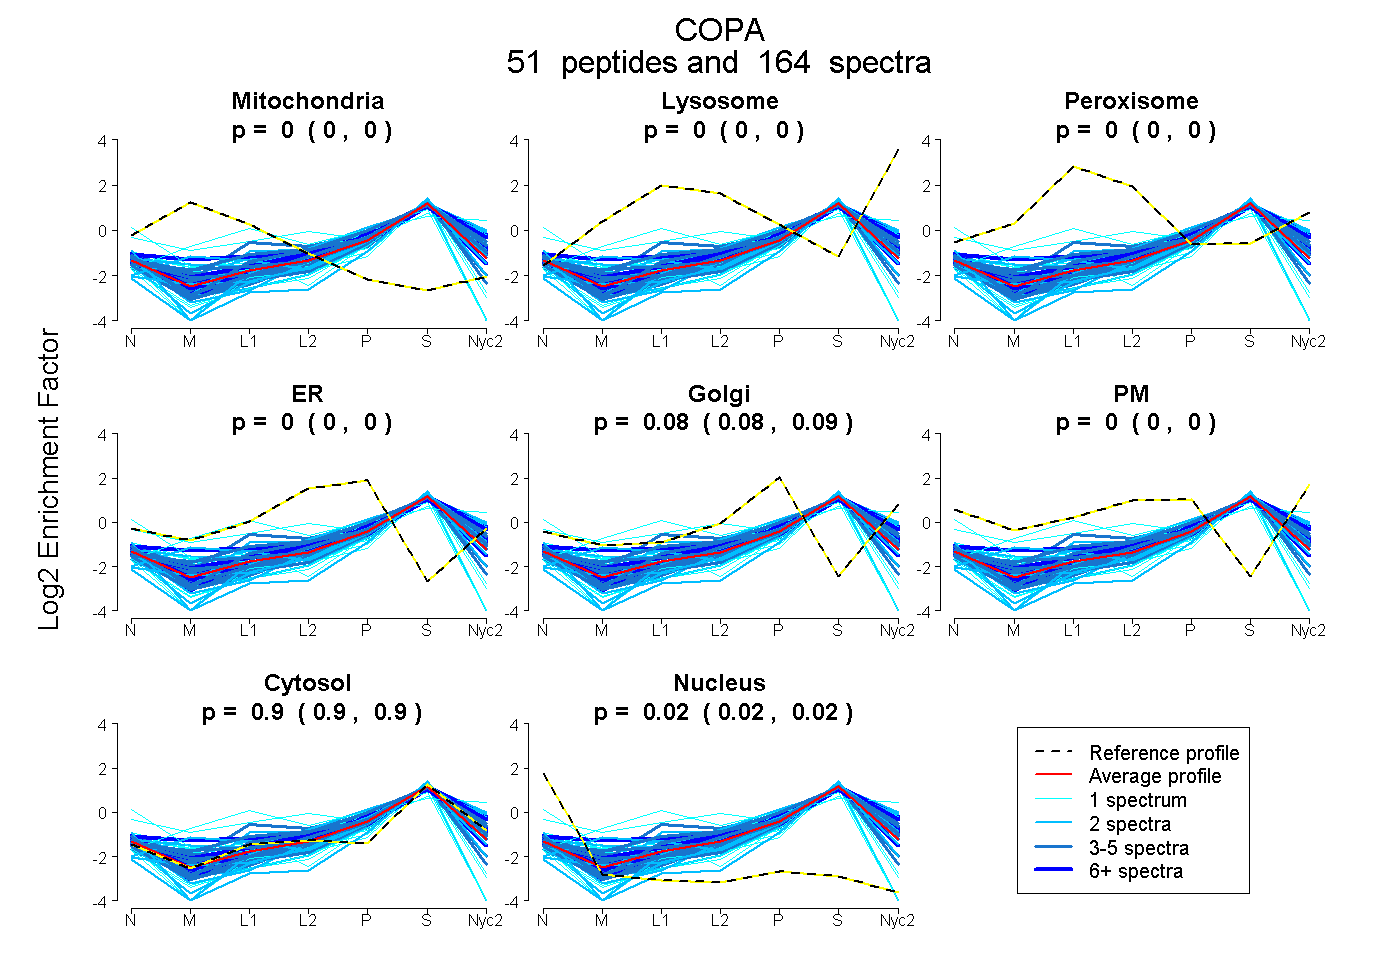
0.000 | 0.000
0.000 | 0.000
0.000 | 0.000
0.000 | 0.000
0.083 | 0.086
0.000 | 0.000
0.897 | 0.899
0.015 | 0.019
34peptides
spectra
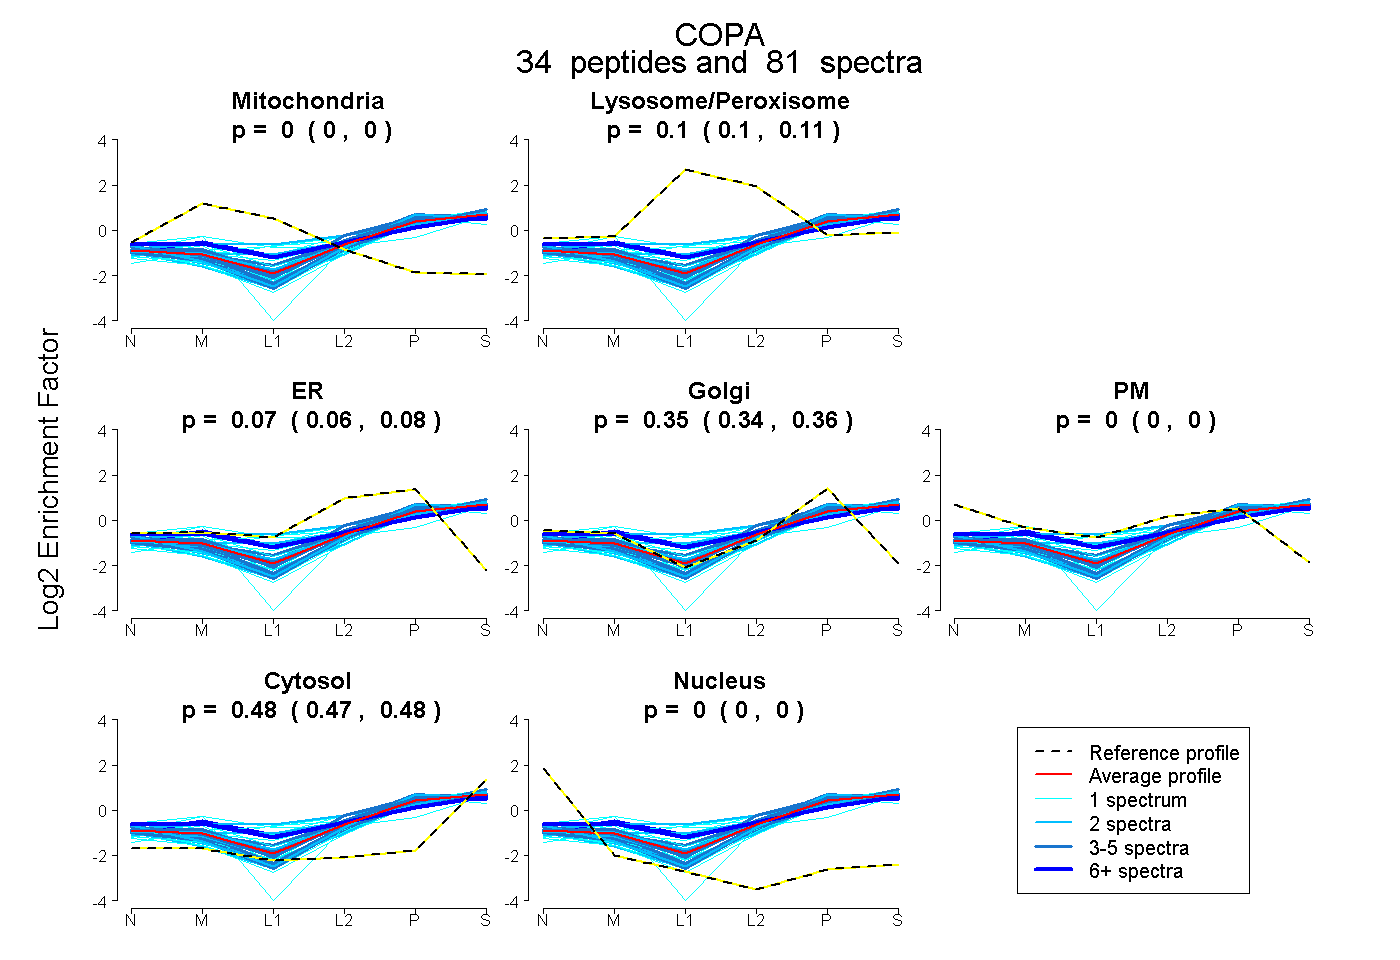
0.000 | 0.000
0.097 | 0.110
0.060 | 0.083
0.336 | 0.355
0.000 | 0.000
0.473 | 0.480
0.000 | 0.000
45peptides
spectra
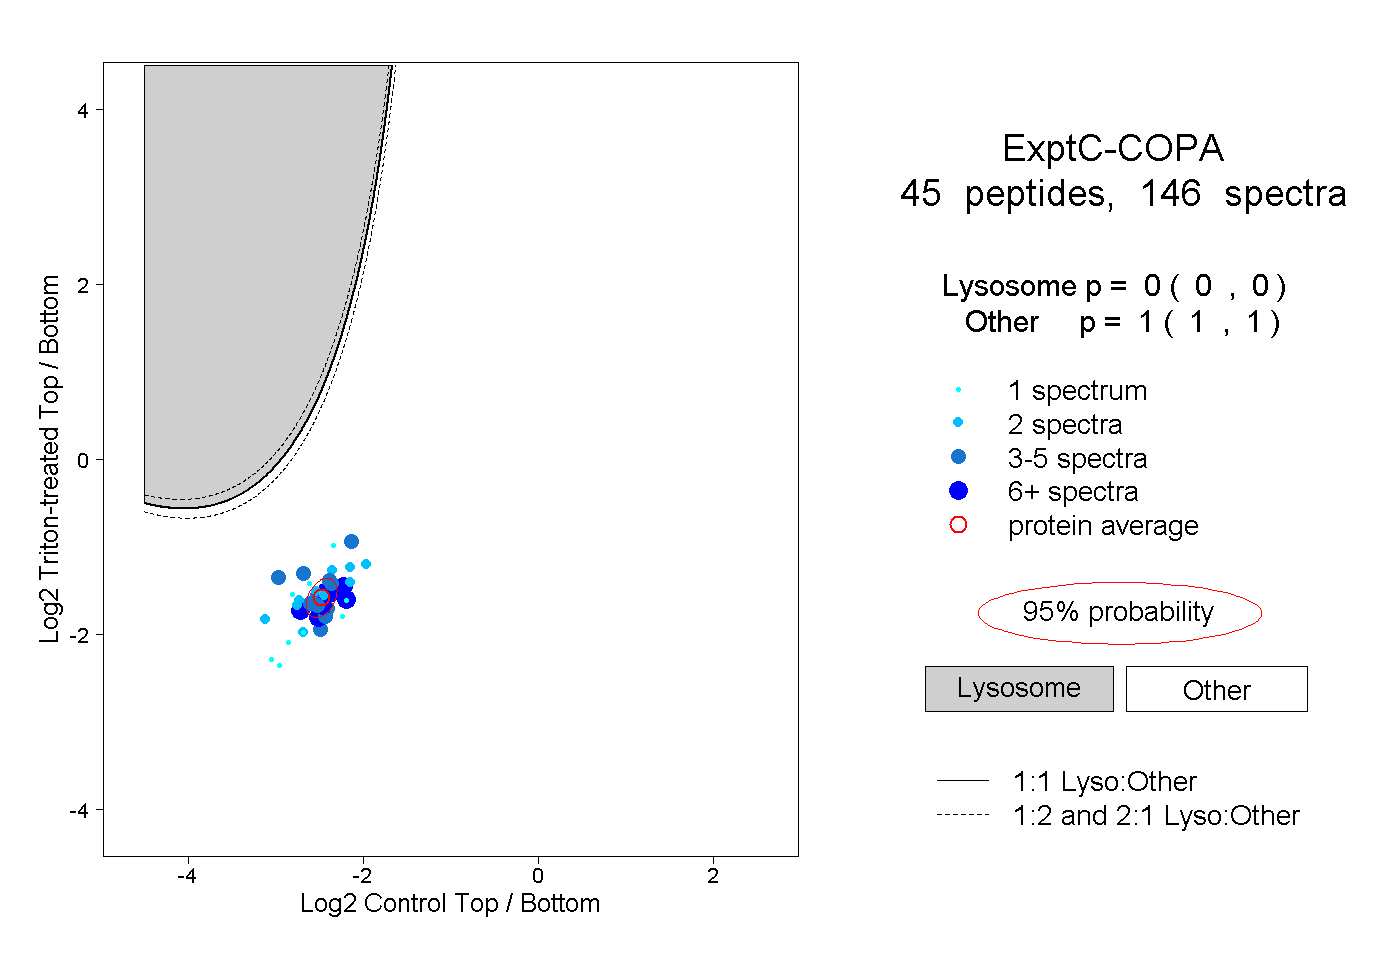
0.000 | 0.000
1.000 | 1.000
8peptides
spectra
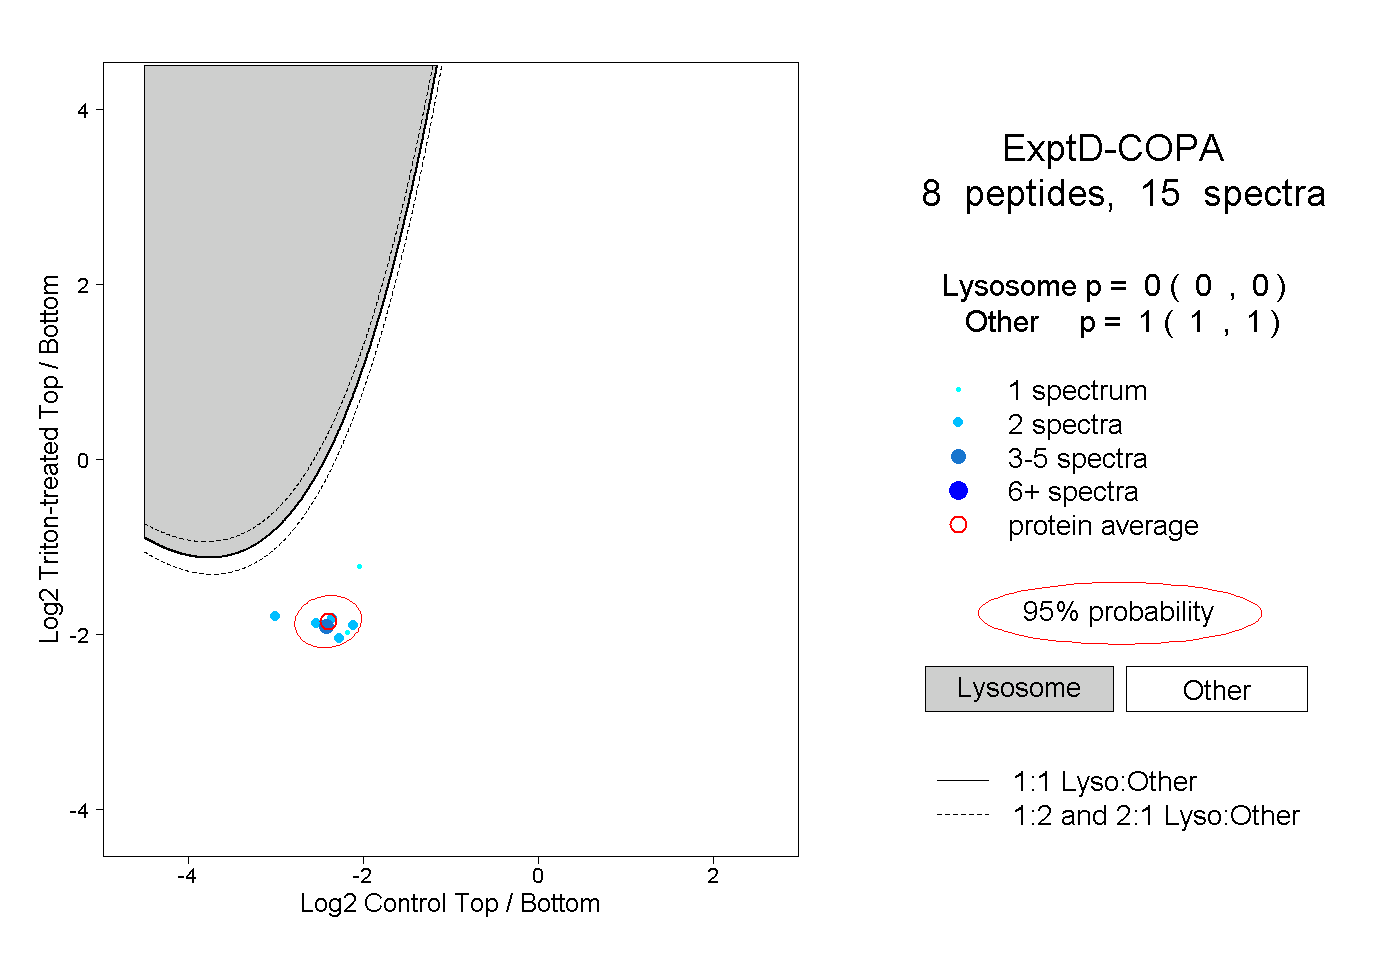
0.000 | 0.000
1.000 | 1.000