 8
8peptides
spectra
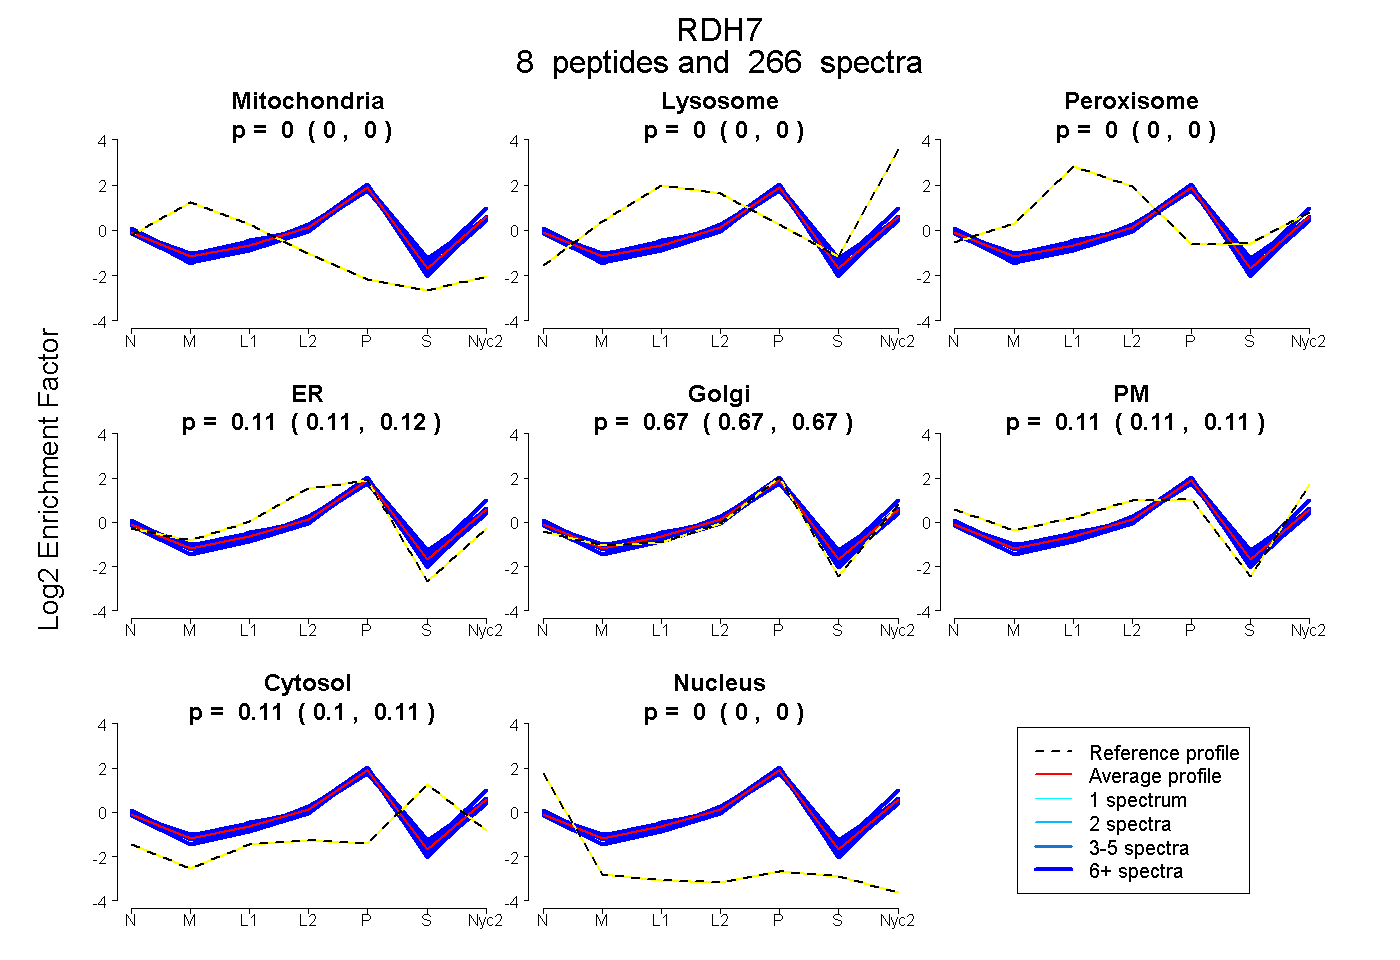
0.000 | 0.000
0.000 | 0.000
0.000 | 0.000
0.110 | 0.115
0.666 | 0.672
0.109 | 0.114
0.104 | 0.107
0.000 | 0.000
13peptides
spectra
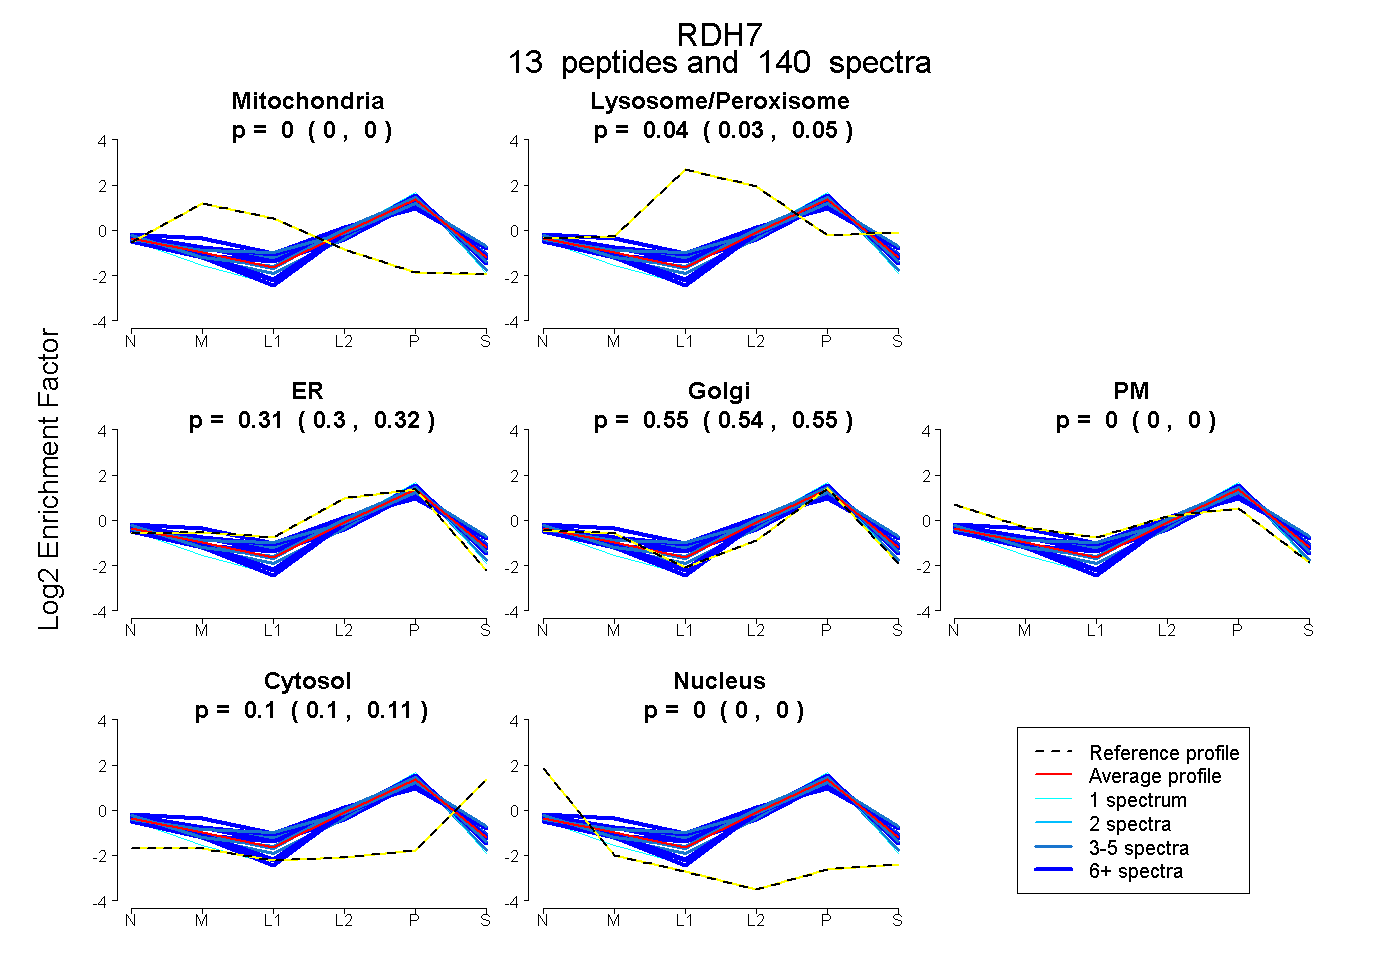
0.000 | 0.000
0.032 | 0.046
0.298 | 0.322
0.537 | 0.555
0.000 | 0.000
0.098 | 0.106
0.000 | 0.000
9peptides
spectra
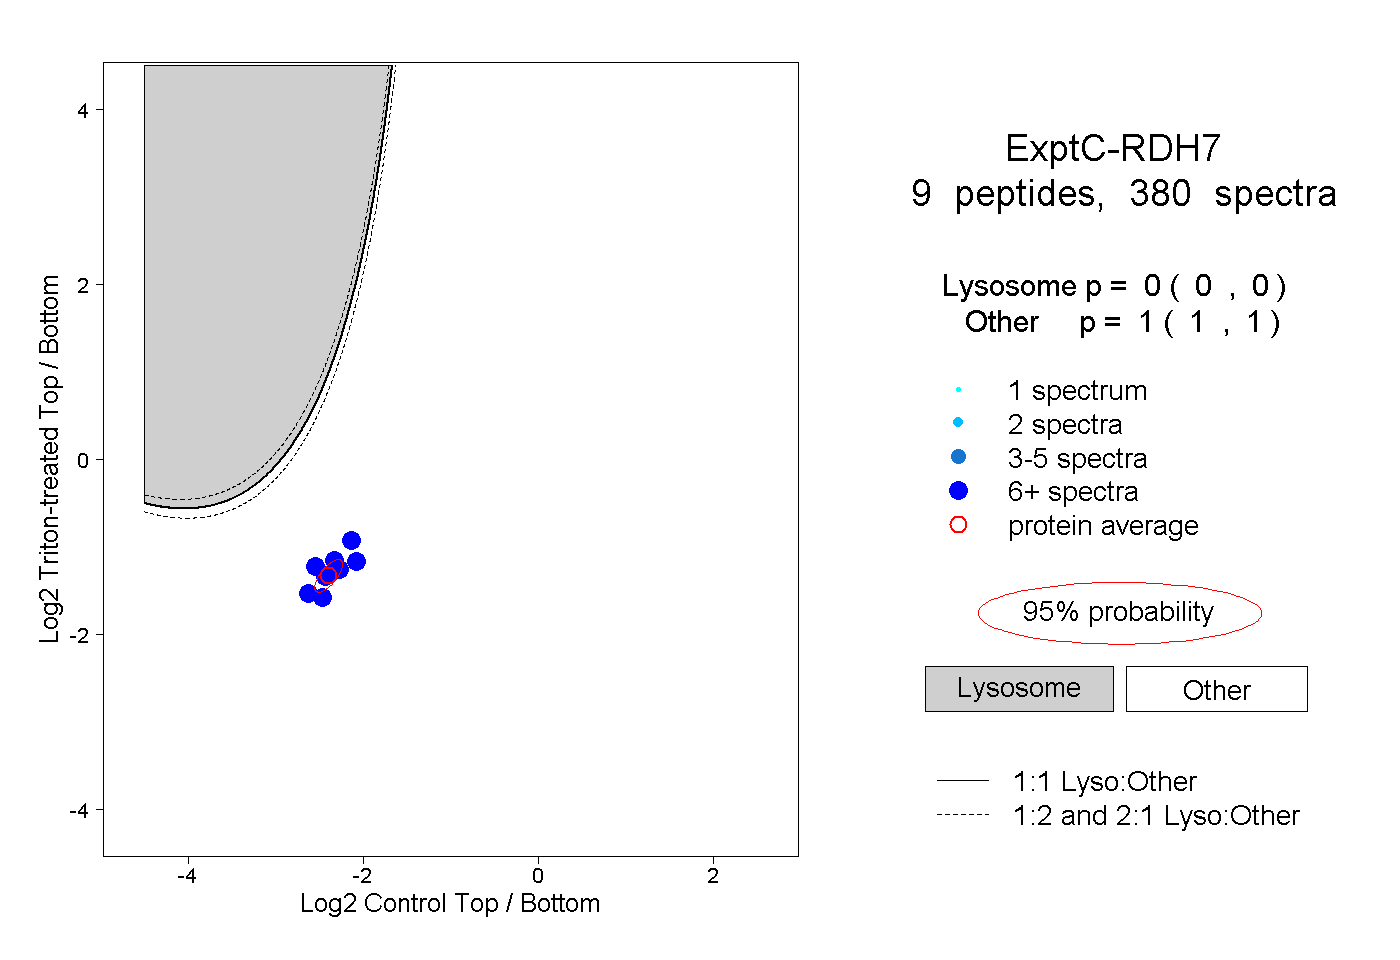
0.000 | 0.000
1.000 | 1.000
9peptides
spectra
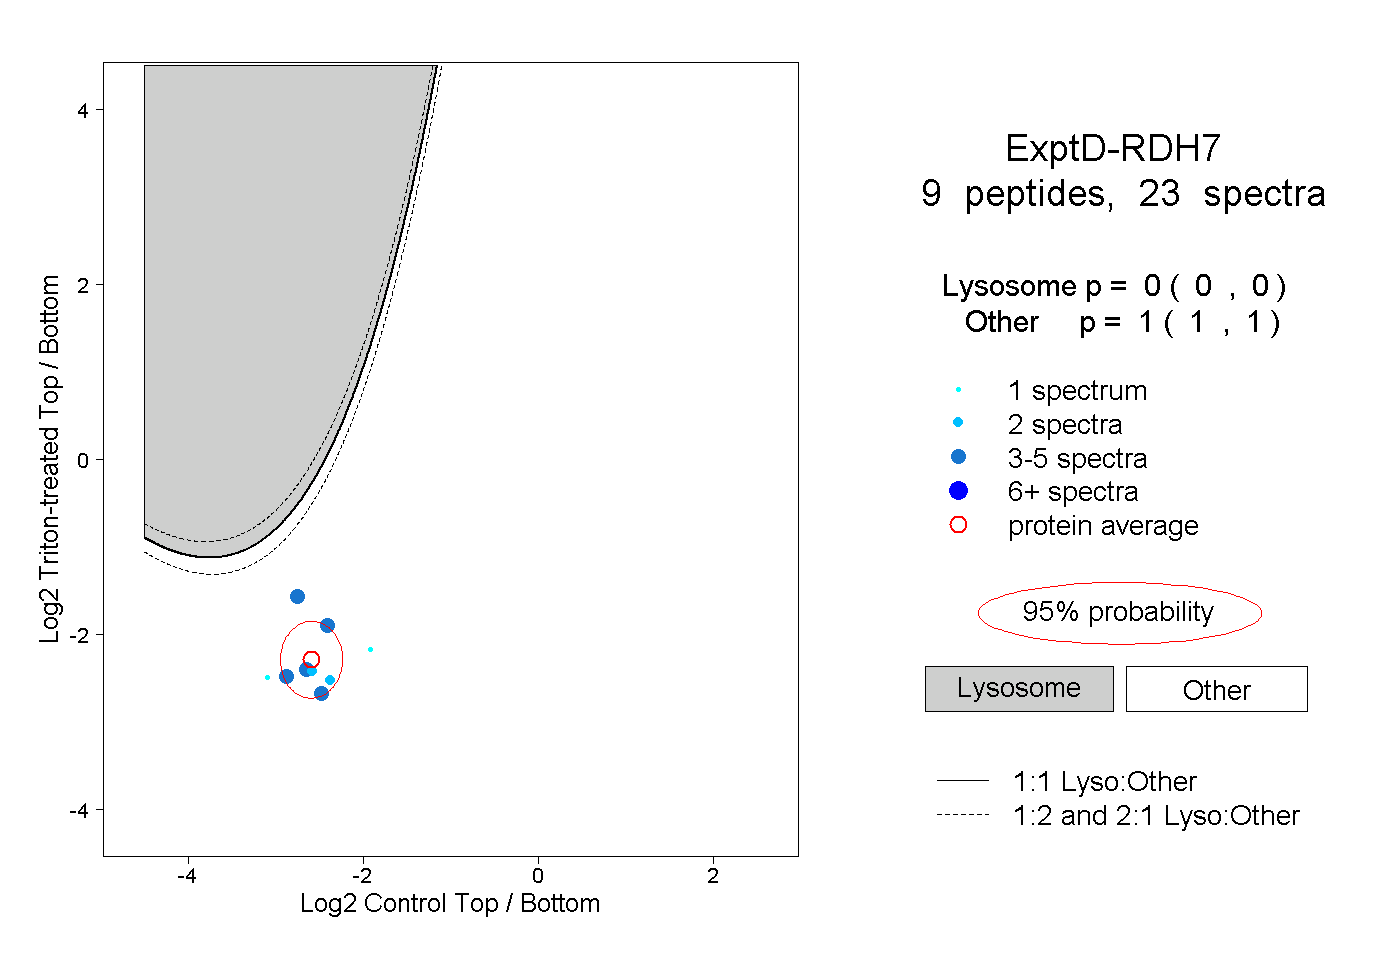
0.000 | 0.000
1.000 | 1.000