RDH7
[ENSRNOP00000005875]
Main page
| | | Plot |
Mito |
Lyso |
|
Perox |
ER |
Golgi |
PM |
Cytosol |
Nucleus |
|
| Expt A |
 8
8
peptides |
266
spectra |
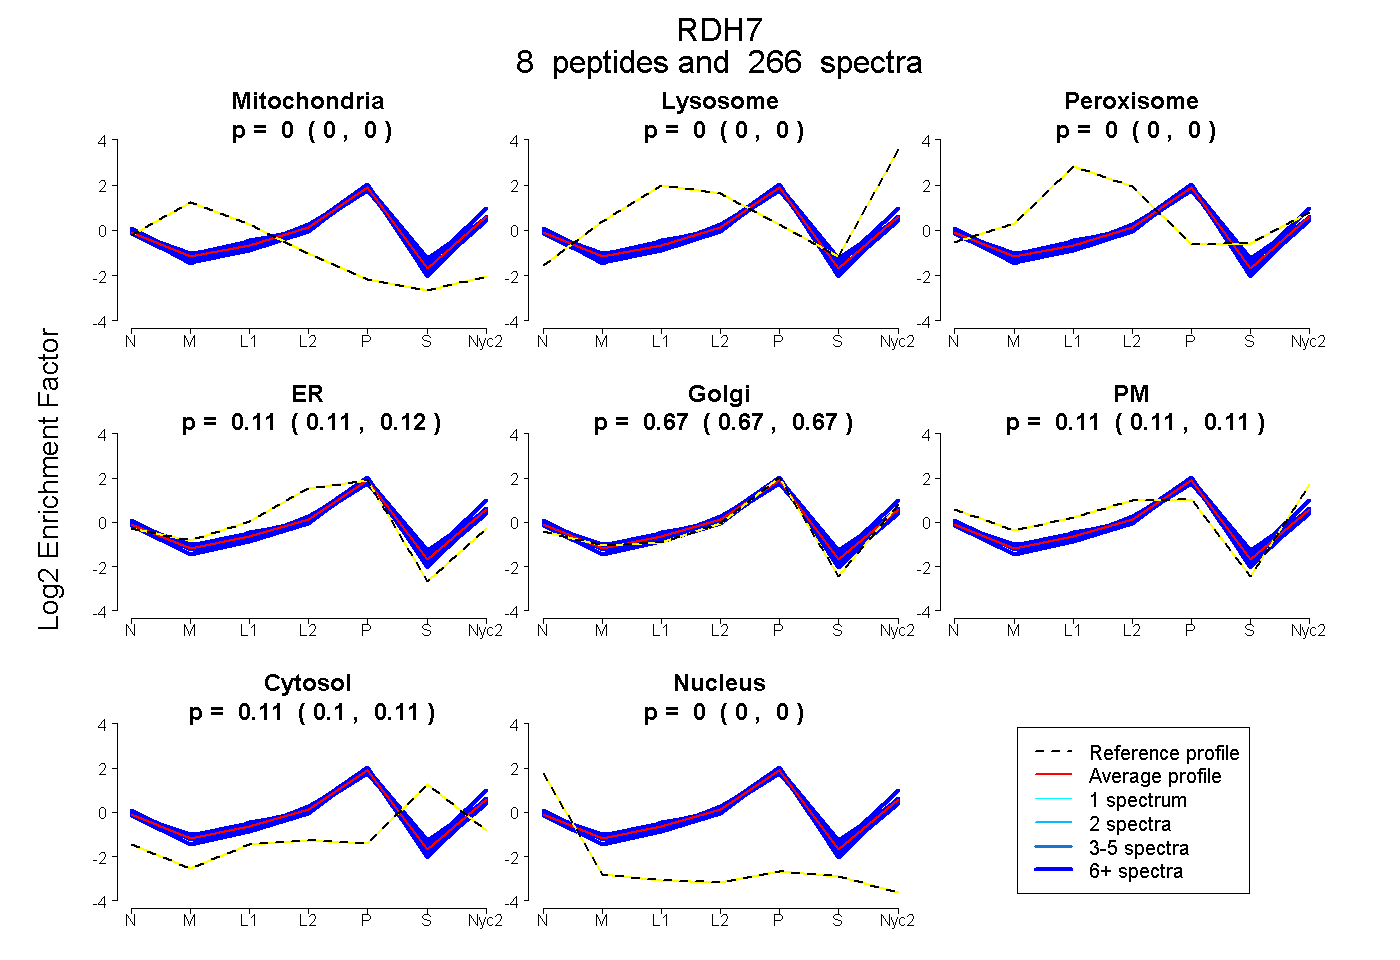 |
0.000
0.000 | 0.000 |
0.000
0.000 | 0.000 |
|
0.000
0.000 | 0.000 |
0.113
0.110 | 0.115 |
0.669
0.666 | 0.672 |
0.112
0.109 | 0.114 |
0.106
0.104 | 0.107 |
0.000
0.000 | 0.000 |
|
| | | Plot |
Mito |
|
Lyso or Perox |
|
ER |
Golgi |
PM |
Cytosol |
Nucleus |
|
| Expt B |
13
peptides |
140
spectra |
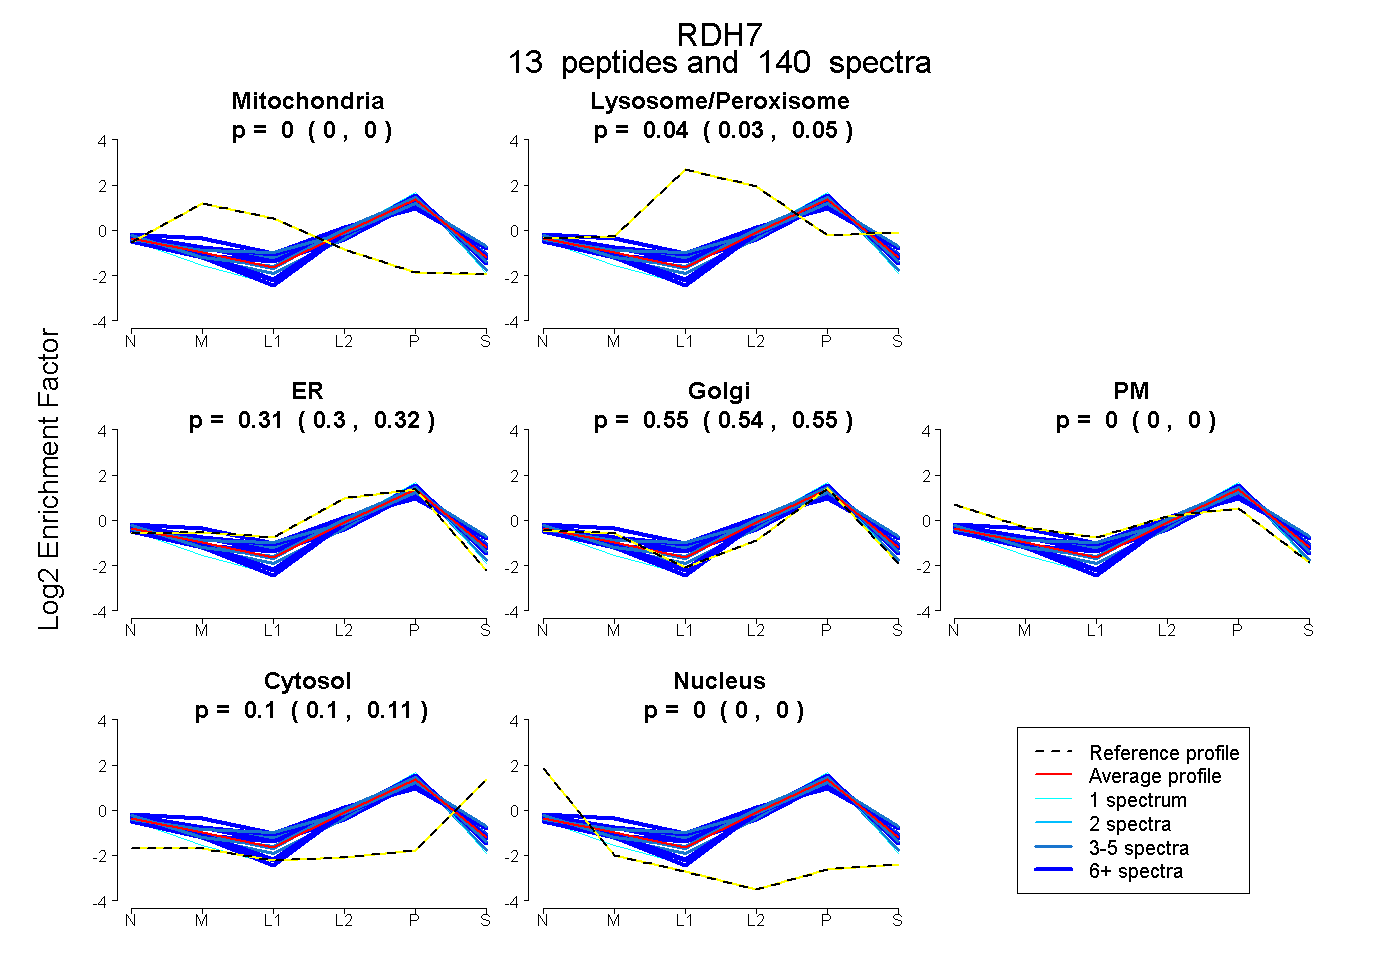 |
0.000
0.000 | 0.000 |
|
0.040
0.032 | 0.046 |
|
0.311
0.298 | 0.322 |
0.547
0.537 | 0.555 |
0.000
0.000 | 0.000 |
0.102
0.098 | 0.106 |
0.000
0.000 | 0.000 |
|
| | | Plot |
|
Lyso |
|
|
|
|
|
|
|
Other |
| Expt C |
9
peptides |
380
spectra |
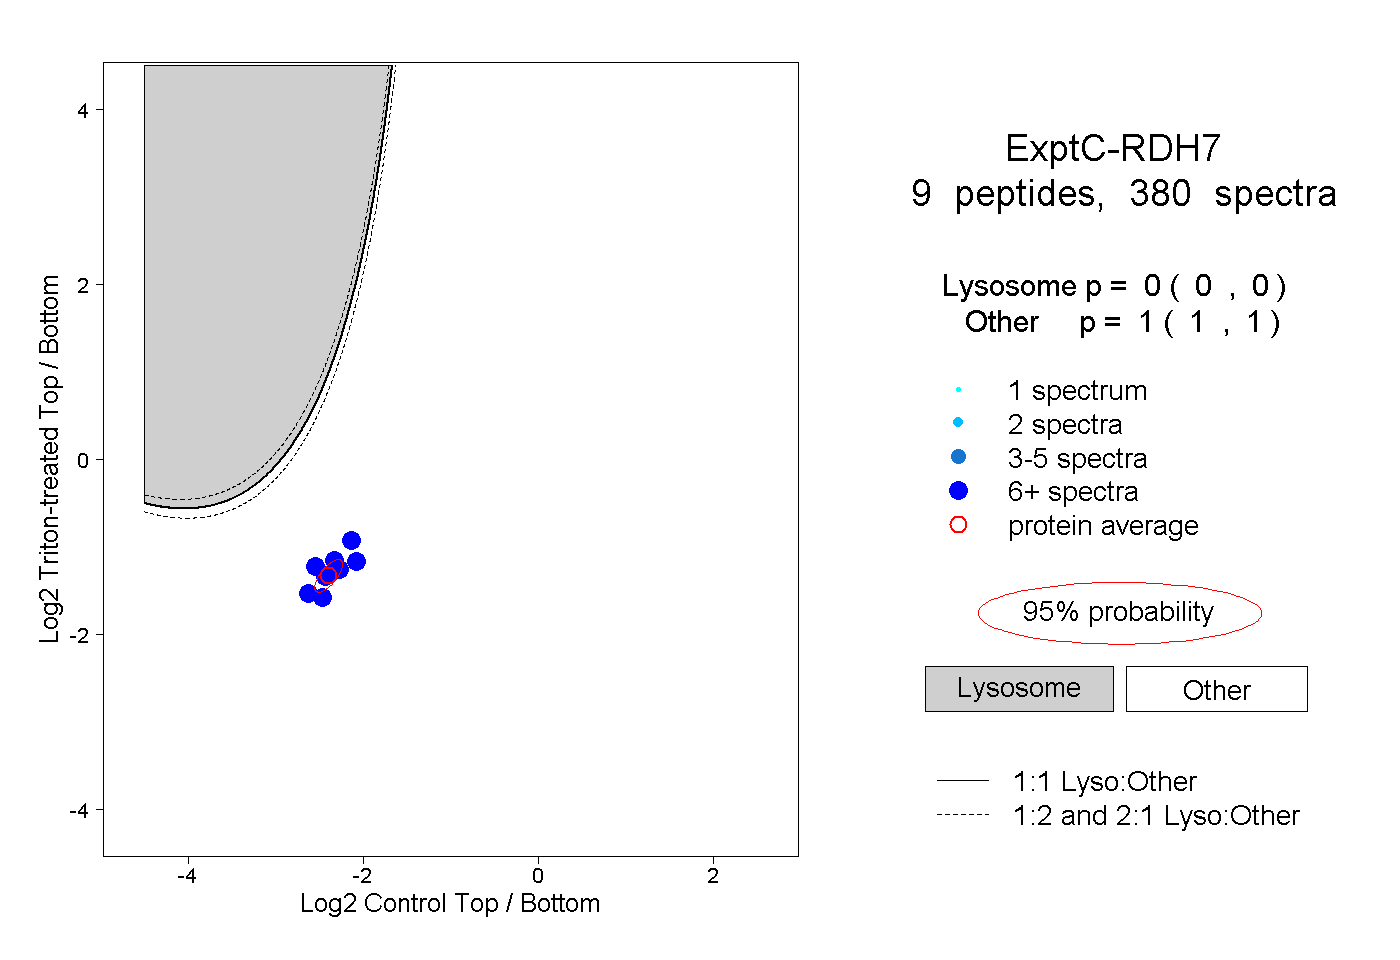 |
|
0.000
0.000 | 0.000 |
|
|
|
|
|
|
|
1.000
1.000 | 1.000 |
| 37 spectra, ELTYFGVK |
|
0.000 |
|
|
|
|
|
|
|
1.000 |
| 25 spectra, EIYGEK |
|
0.000 |
|
|
|
|
|
|
|
1.000 |
| 6 spectra, MSLLGGGYCISK |
|
0.000 |
|
|
|
|
|
|
|
1.000 |
| 13 spectra, LWDQATEEVK |
|
0.000 |
|
|
|
|
|
|
|
1.000 |
| 158 spectra, TNVTNMER |
|
0.000 |
|
|
|
|
|
|
|
1.000 |
| 30 spectra, VAIIEPGGFK |
|
0.000 |
|
|
|
|
|
|
|
1.000 |
| 53 spectra, VVNIASTMGR |
|
0.000 |
|
|
|
|
|
|
|
1.000 |
| 36 spectra, YSPGWDAK |
|
0.000 |
|
|
|
|
|
|
|
1.000 |
| 22 spectra, LSDNLK |
|
0.000 |
|
|
|
|
|
|
|
1.000 |
| | | Plot |
|
Lyso |
|
|
|
|
|
|
|
Other |
| Expt D |
9
peptides |
23
spectra |
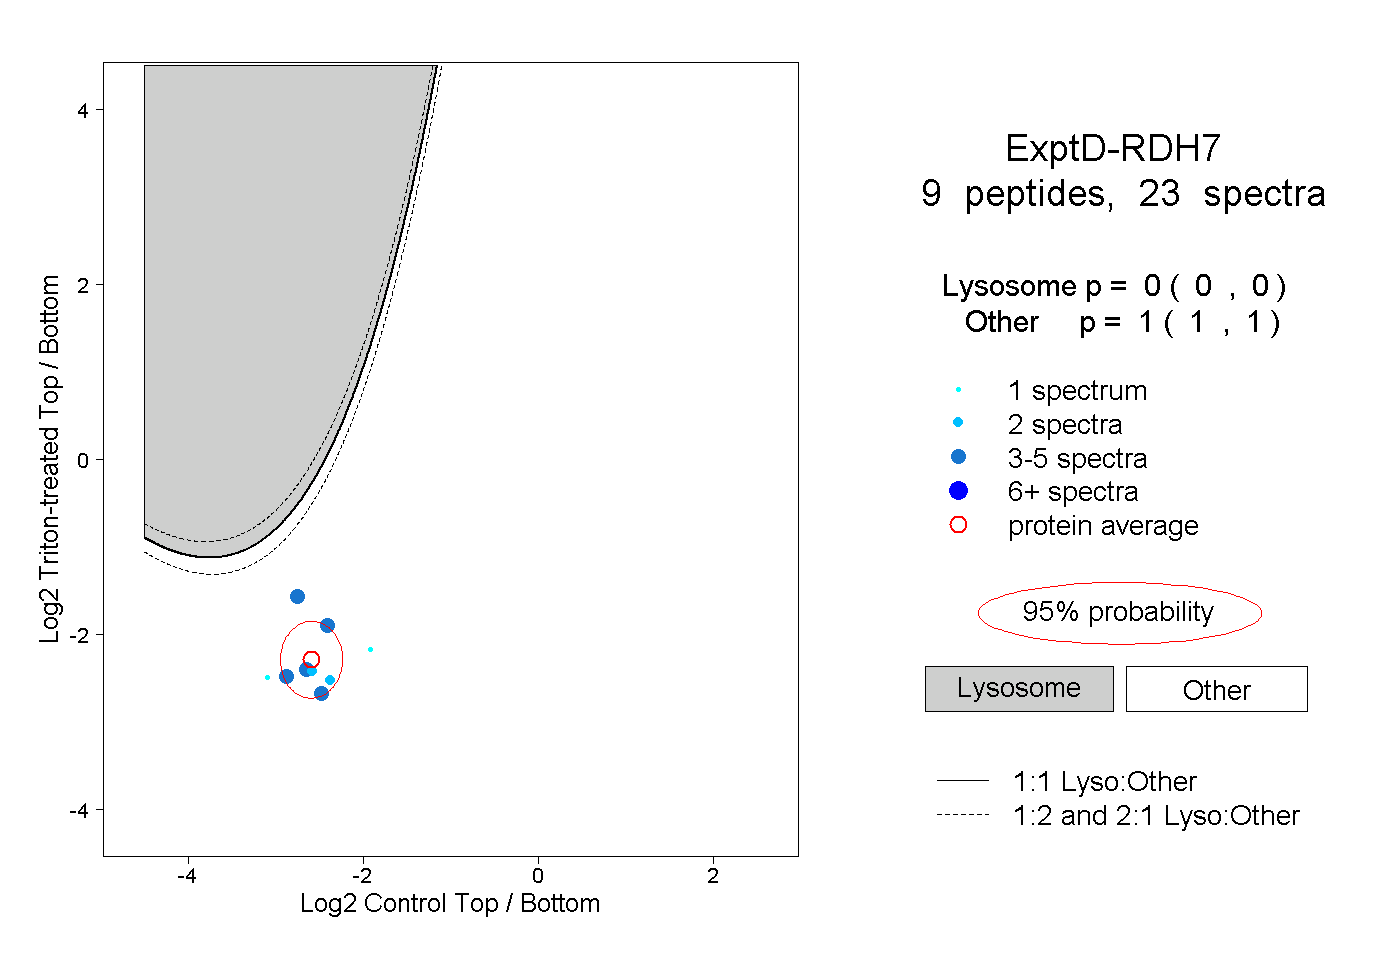 |
|
0.000
0.000 | 0.000 |
|
|
|
|
|
|
|
1.000
1.000 | 1.000 |