RDH7
[ENSRNOP00000005875]
Main page
| | | Plot |
Mito |
Lyso |
|
Perox |
ER |
Golgi |
PM |
Cytosol |
Nucleus |
|
| Expt A |
 8
8
peptides |
266
spectra |
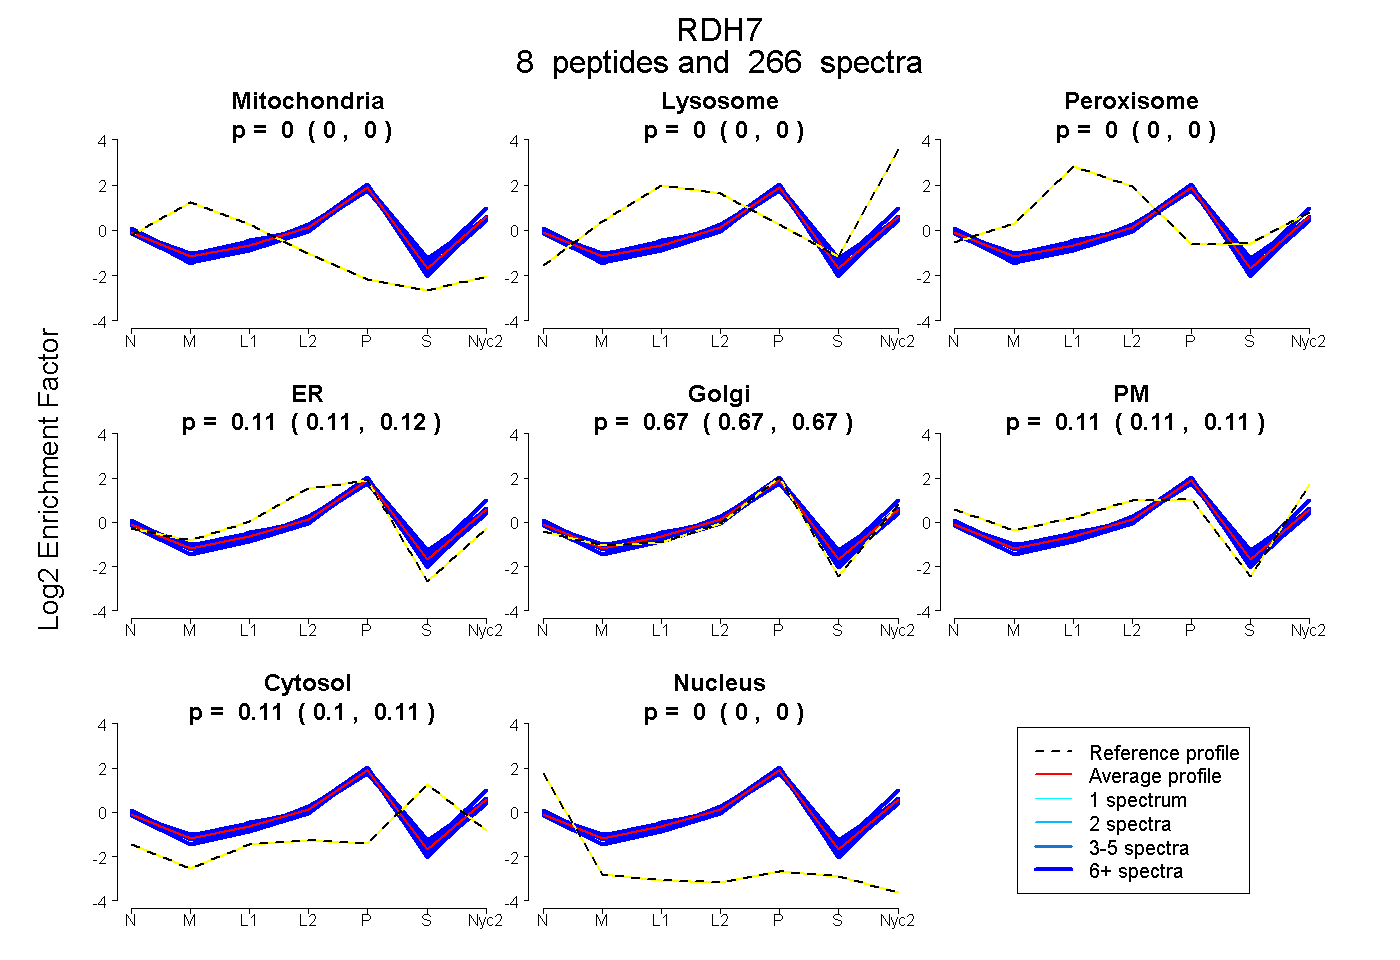 |
0.000
0.000 | 0.000 |
0.000
0.000 | 0.000 |
|
0.000
0.000 | 0.000 |
0.113
0.110 | 0.115 |
0.669
0.666 | 0.672 |
0.112
0.109 | 0.114 |
0.106
0.104 | 0.107 |
0.000
0.000 | 0.000 |
|
| | | Plot |
Mito |
|
Lyso or Perox |
|
ER |
Golgi |
PM |
Cytosol |
Nucleus |
|
| Expt B |
13
peptides |
140
spectra |
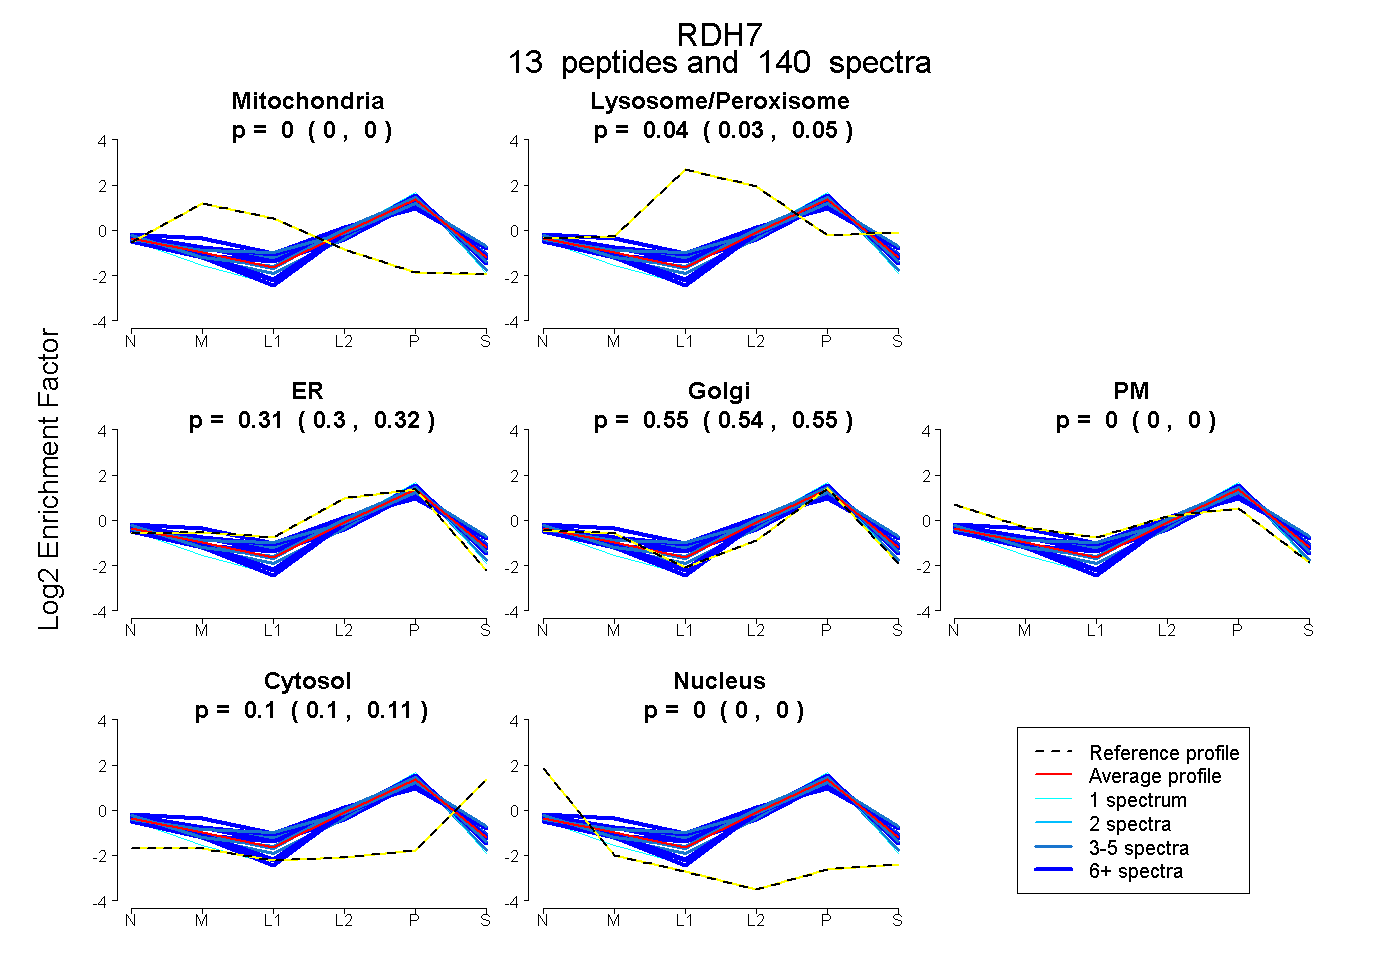 |
0.000
0.000 | 0.000 |
|
0.040
0.032 | 0.046 |
|
0.311
0.298 | 0.322 |
0.547
0.537 | 0.555 |
0.000
0.000 | 0.000 |
0.102
0.098 | 0.106 |
0.000
0.000 | 0.000 |
|
| 7 spectra, YGVEAFSDSLR |
0.000 |
|
0.000 |
|
0.232 |
0.650 |
0.000 |
0.118 |
0.000 |
|
| 7 spectra, TESIVAATQWVK |
0.000 |
|
0.247 |
|
0.000 |
0.585 |
0.111 |
0.056 |
0.000 |
|
| 8 spectra, ELTYFGVK |
0.000 |
|
0.165 |
|
0.000 |
0.773 |
0.004 |
0.059 |
0.000 |
|
| 4 spectra, EIYGEK |
0.000 |
|
0.173 |
|
0.101 |
0.695 |
0.000 |
0.030 |
0.000 |
|
| 9 spectra, LETVILDVTK |
0.000 |
|
0.065 |
|
0.349 |
0.504 |
0.000 |
0.082 |
0.000 |
|
| 4 spectra, MSLLGGGYCISK |
0.000 |
|
0.000 |
|
0.464 |
0.400 |
0.000 |
0.136 |
0.000 |
|
| 1 spectrum, LWDQATEEVK |
0.000 |
|
0.000 |
|
0.190 |
0.810 |
0.000 |
0.000 |
0.000 |
|
| 9 spectra, TNVTNMER |
0.000 |
|
0.000 |
|
0.270 |
0.635 |
0.000 |
0.095 |
0.000 |
|
| 3 spectra, YSAGWDAK |
0.000 |
|
0.000 |
|
0.438 |
0.445 |
0.030 |
0.088 |
0.000 |
|
| 6 spectra, VAIIEPGGFK |
0.000 |
|
0.237 |
|
0.000 |
0.689 |
0.000 |
0.074 |
0.000 |
|
| 74 spectra, VVNIASTMGR |
0.000 |
|
0.000 |
|
0.186 |
0.757 |
0.000 |
0.058 |
0.000 |
|
| 5 spectra, YSPGWDAK |
0.000 |
|
0.251 |
|
0.000 |
0.663 |
0.000 |
0.085 |
0.000 |
|
| 3 spectra, LSDNLK |
0.000 |
|
0.000 |
|
0.226 |
0.747 |
0.000 |
0.006 |
0.021 |
|
| | | Plot |
|
Lyso |
|
|
|
|
|
|
|
Other |
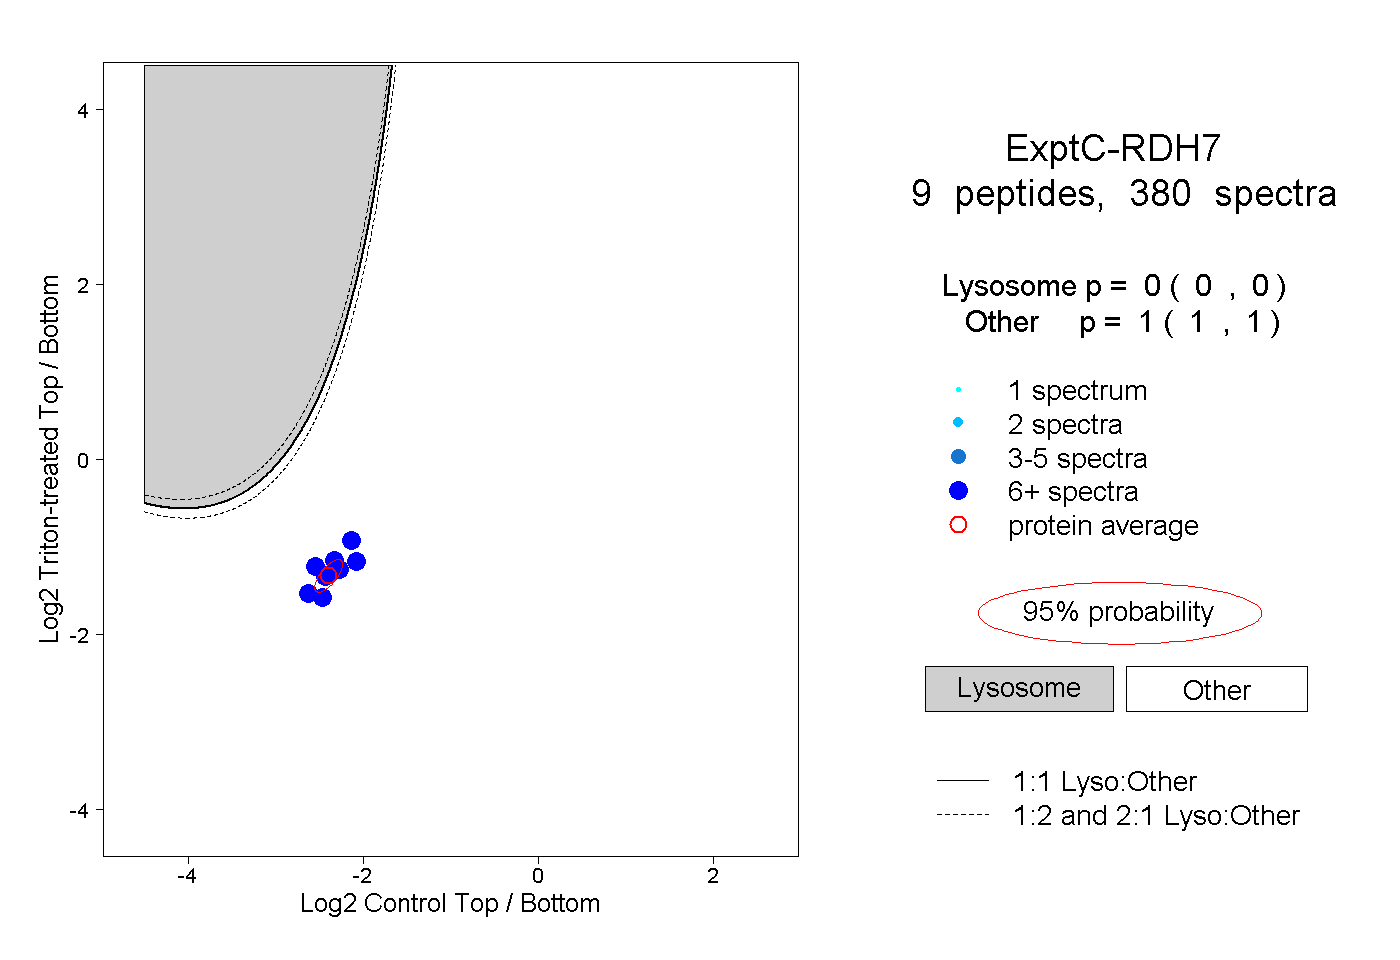
| Expt C |
9
peptides |
380
spectra |
 |
|
0.000
0.000 | 0.000 |
|
|
|
|
|
|
|
1.000
1.000 | 1.000 |
| | | Plot |
|
Lyso |
|
|
|
|
|
|
|
Other |
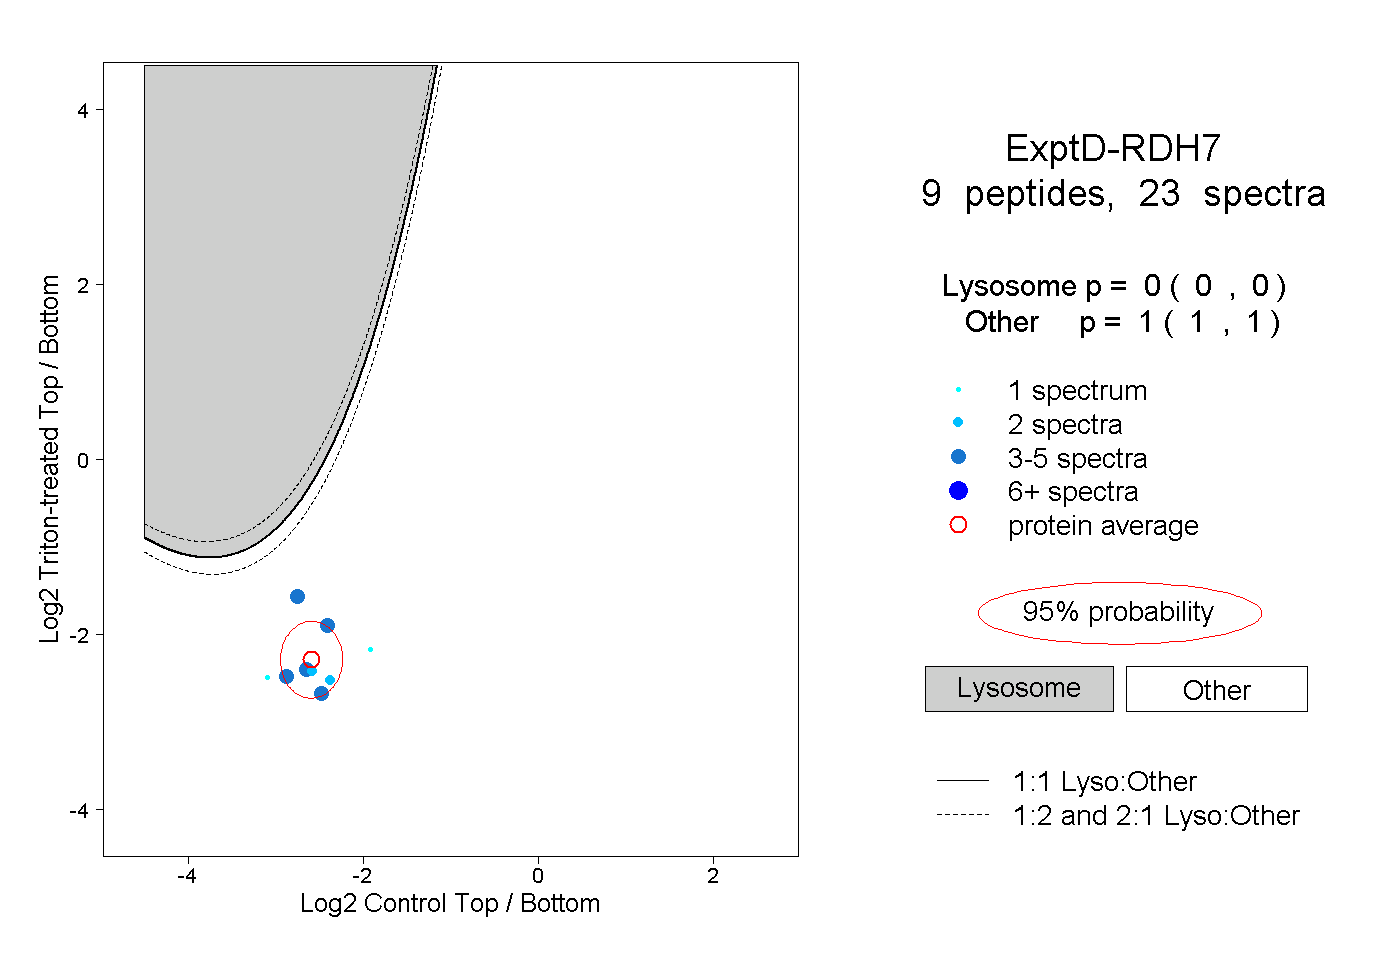
| Expt D |
9
peptides |
23
spectra |
 |
|
0.000
0.000 | 0.000 |
|
|
|
|
|
|
|
1.000
1.000 | 1.000 |