 8
8peptides
spectra
0.000 | 0.000
0.000 | 0.000
0.000 | 0.000
0.110 | 0.115
0.666 | 0.672
0.109 | 0.114
0.104 | 0.107
0.000 | 0.000
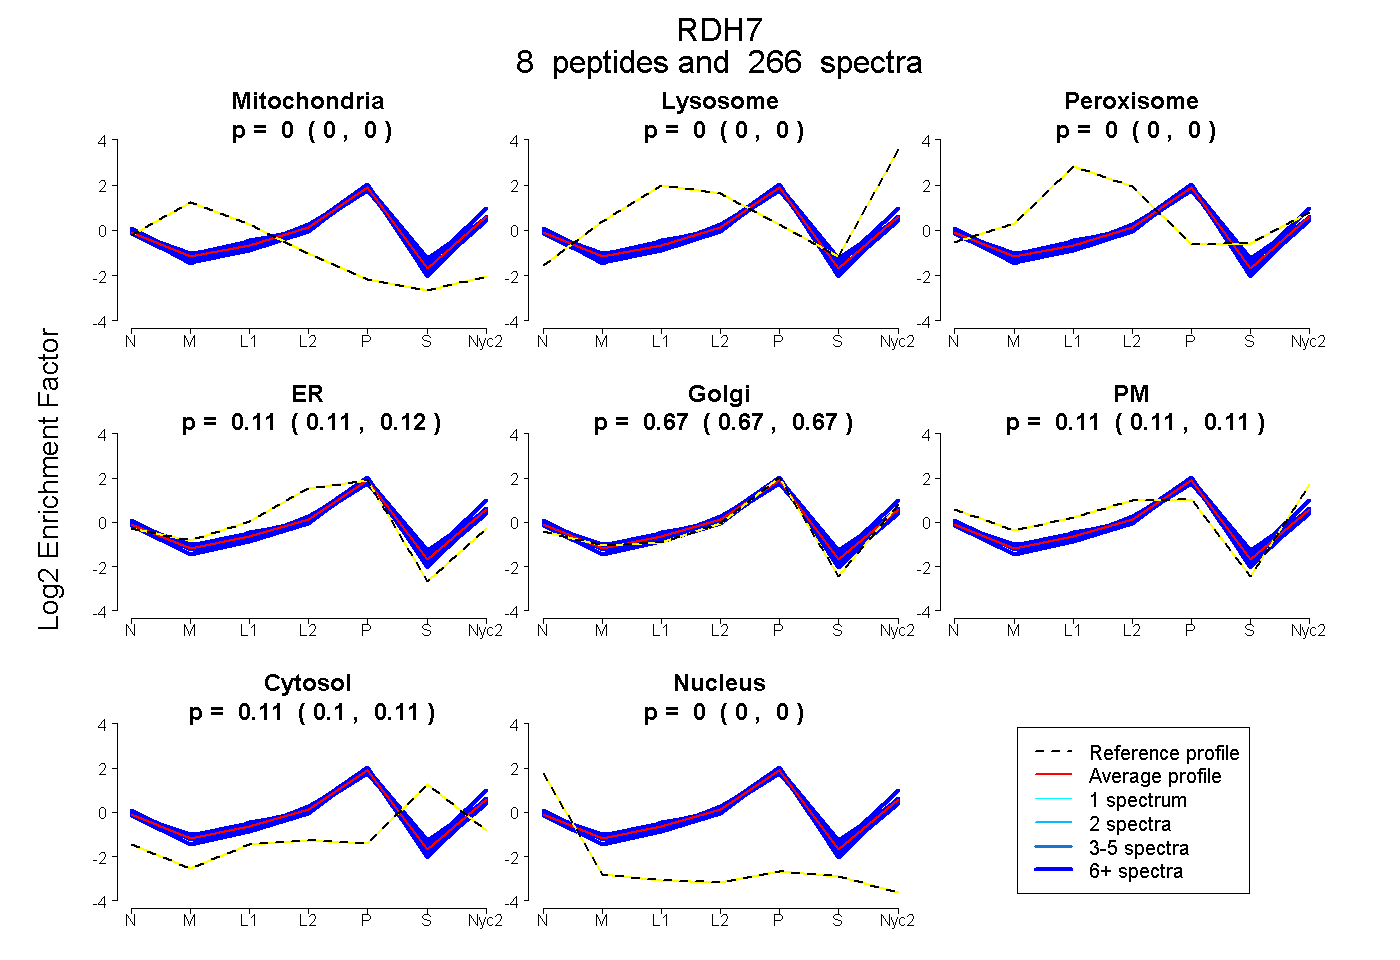
| Plot | Mito | Lyso | Perox | ER | Golgi | PM | Cytosol | Nucleus | |||||
| Expt A |
8 peptides |
266 spectra |
|
0.000 0.000 | 0.000 |
0.000 0.000 | 0.000 |
0.000 0.000 | 0.000 |
0.113 0.110 | 0.115 |
0.669 0.666 | 0.672 |
0.112 0.109 | 0.114 |
0.106 0.104 | 0.107 |
0.000 0.000 | 0.000 |
| 16 spectra, ELTYFGVK | 0.000 | 0.000 | 0.061 | 0.067 | 0.649 | 0.088 | 0.135 | 0.000 | ||
| 7 spectra, EIYGEK | 0.000 | 0.000 | 0.000 | 0.044 | 0.776 | 0.014 | 0.166 | 0.000 | ||
| 11 spectra, LWDQATEEVK | 0.000 | 0.000 | 0.000 | 0.000 | 0.633 | 0.257 | 0.110 | 0.000 | ||
| 88 spectra, TNVTNMER | 0.000 | 0.000 | 0.008 | 0.138 | 0.652 | 0.103 | 0.098 | 0.000 | ||
| 6 spectra, VAIIEPGGFK | 0.000 | 0.000 | 0.046 | 0.058 | 0.713 | 0.050 | 0.134 | 0.000 | ||
| 121 spectra, VVNIASTMGR | 0.000 | 0.000 | 0.000 | 0.131 | 0.768 | 0.051 | 0.050 | 0.000 | ||
| 11 spectra, YSPGWDAK | 0.000 | 0.000 | 0.000 | 0.159 | 0.713 | 0.042 | 0.085 | 0.001 | ||
| 6 spectra, LSDNLK | 0.000 | 0.000 | 0.000 | 0.140 | 0.709 | 0.089 | 0.058 | 0.004 |
| Plot | Mito | Lyso or Perox | ER | Golgi | PM | Cytosol | Nucleus | ||||||
| Expt B |
13 peptides |
140 spectra |
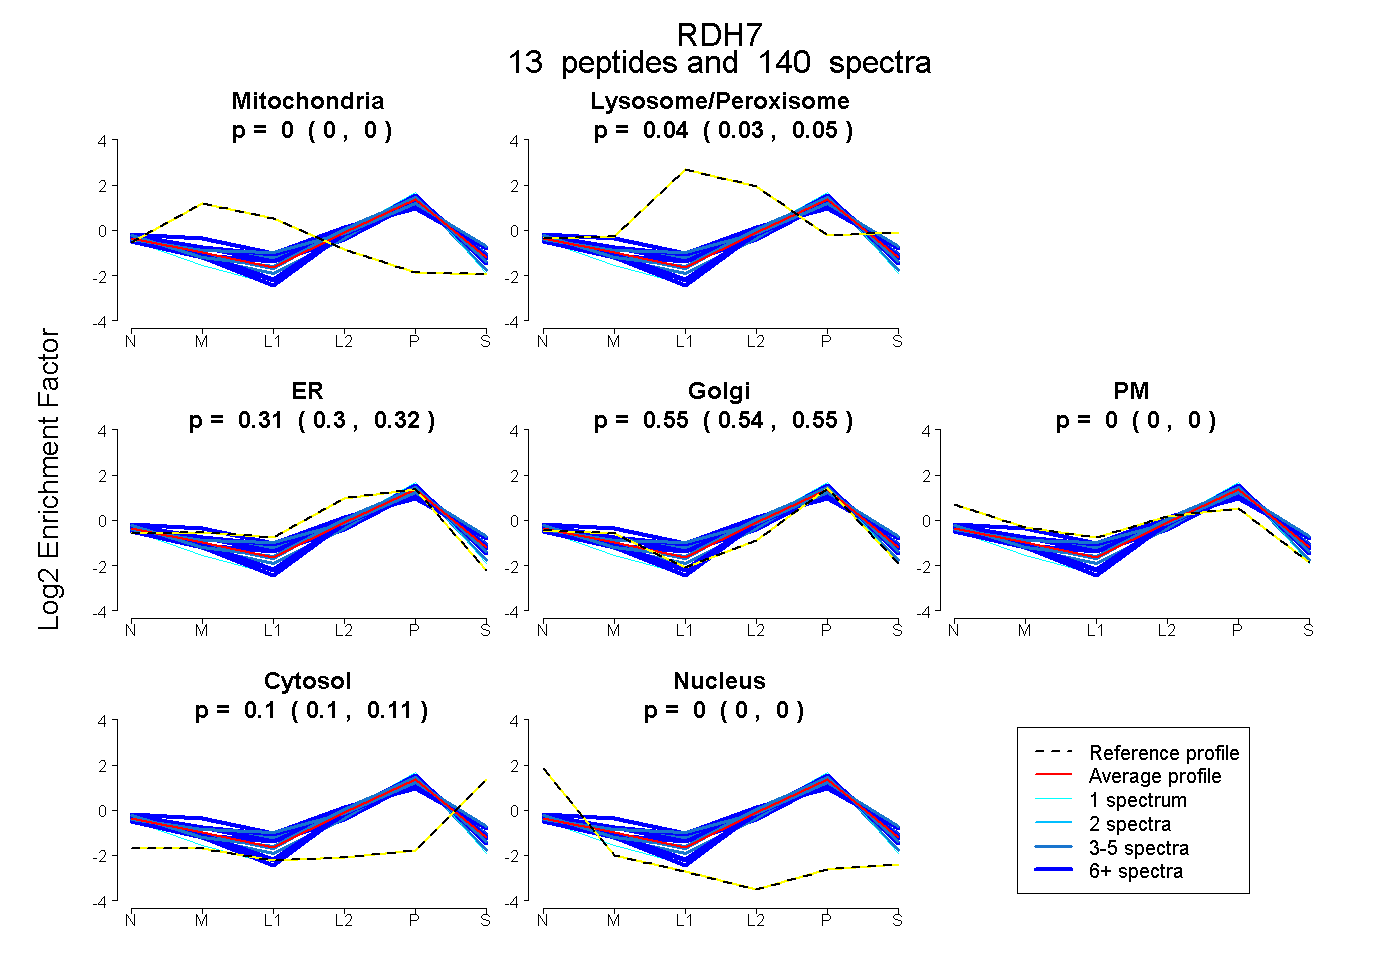 |
0.000 0.000 | 0.000 |
0.040 0.032 | 0.046 |
0.311 0.298 | 0.322 |
0.547 0.537 | 0.555 |
0.000 0.000 | 0.000 |
0.102 0.098 | 0.106 |
0.000 0.000 | 0.000 |
|||
| Plot | Lyso | Other | |||||||||||
| Expt C |
9 peptides |
380 spectra |
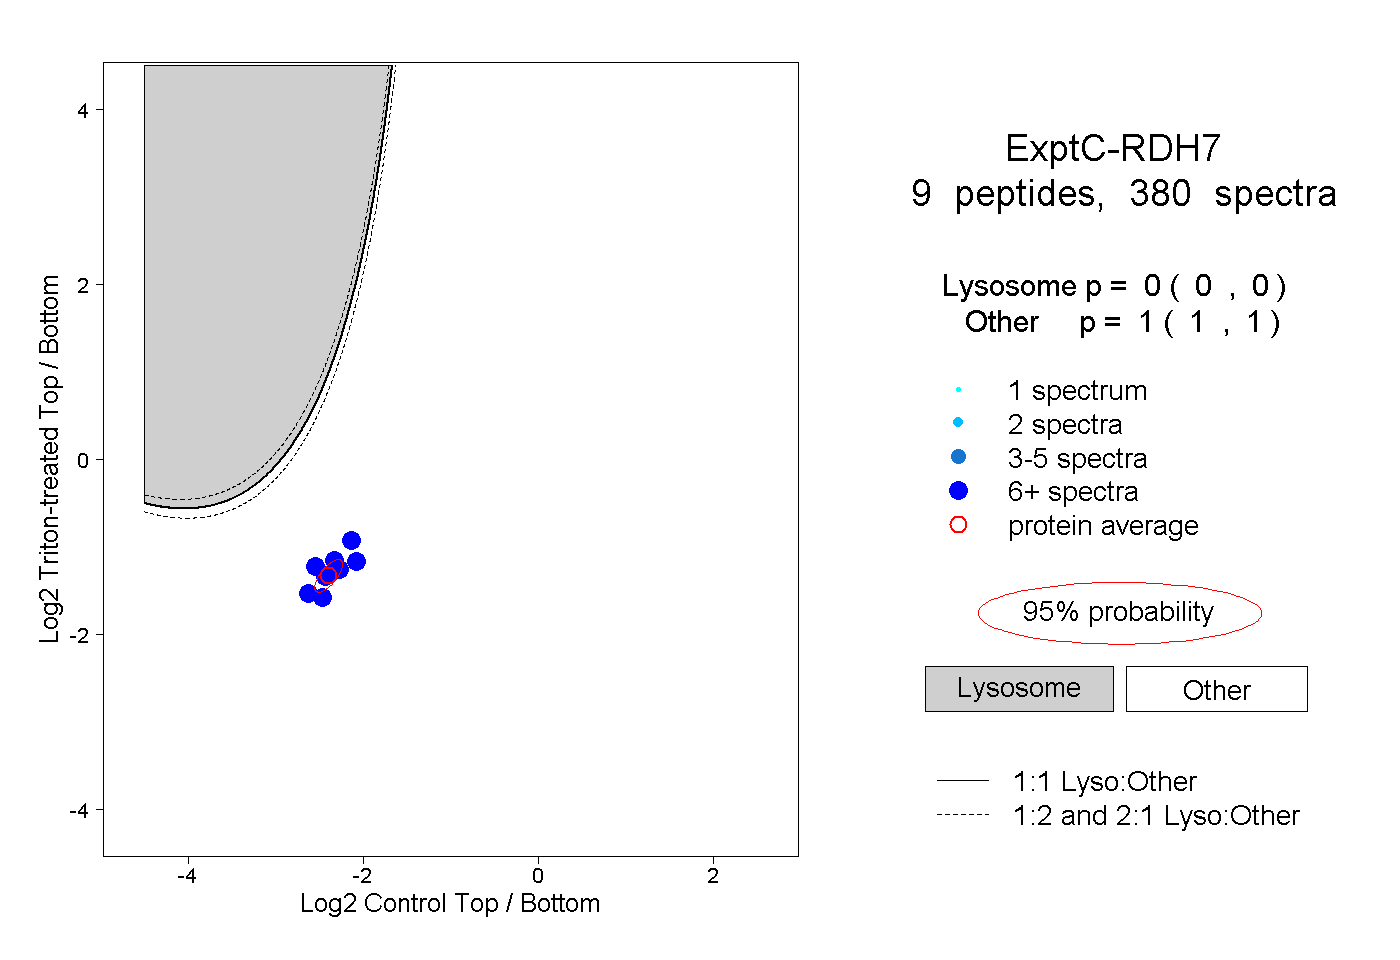 |
0.000 0.000 | 0.000 |
1.000 1.000 | 1.000 |
||||||||
| Plot | Lyso | Other | |||||||||||
| Expt D |
9 peptides |
23 spectra |
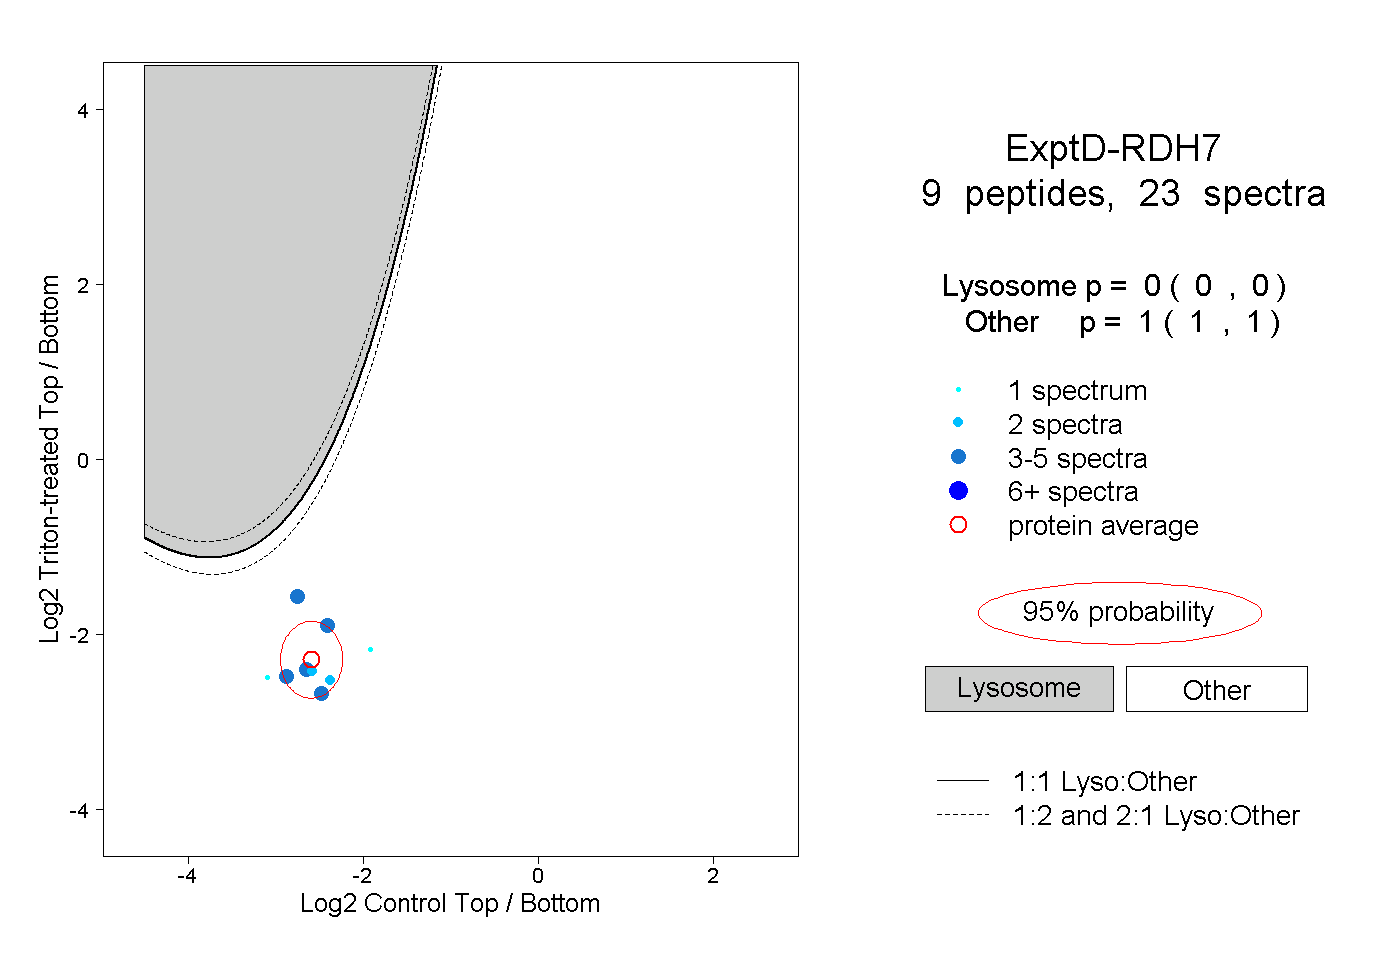 |
0.000 0.000 | 0.000 |
1.000 1.000 | 1.000 |