 13
13peptides
spectra
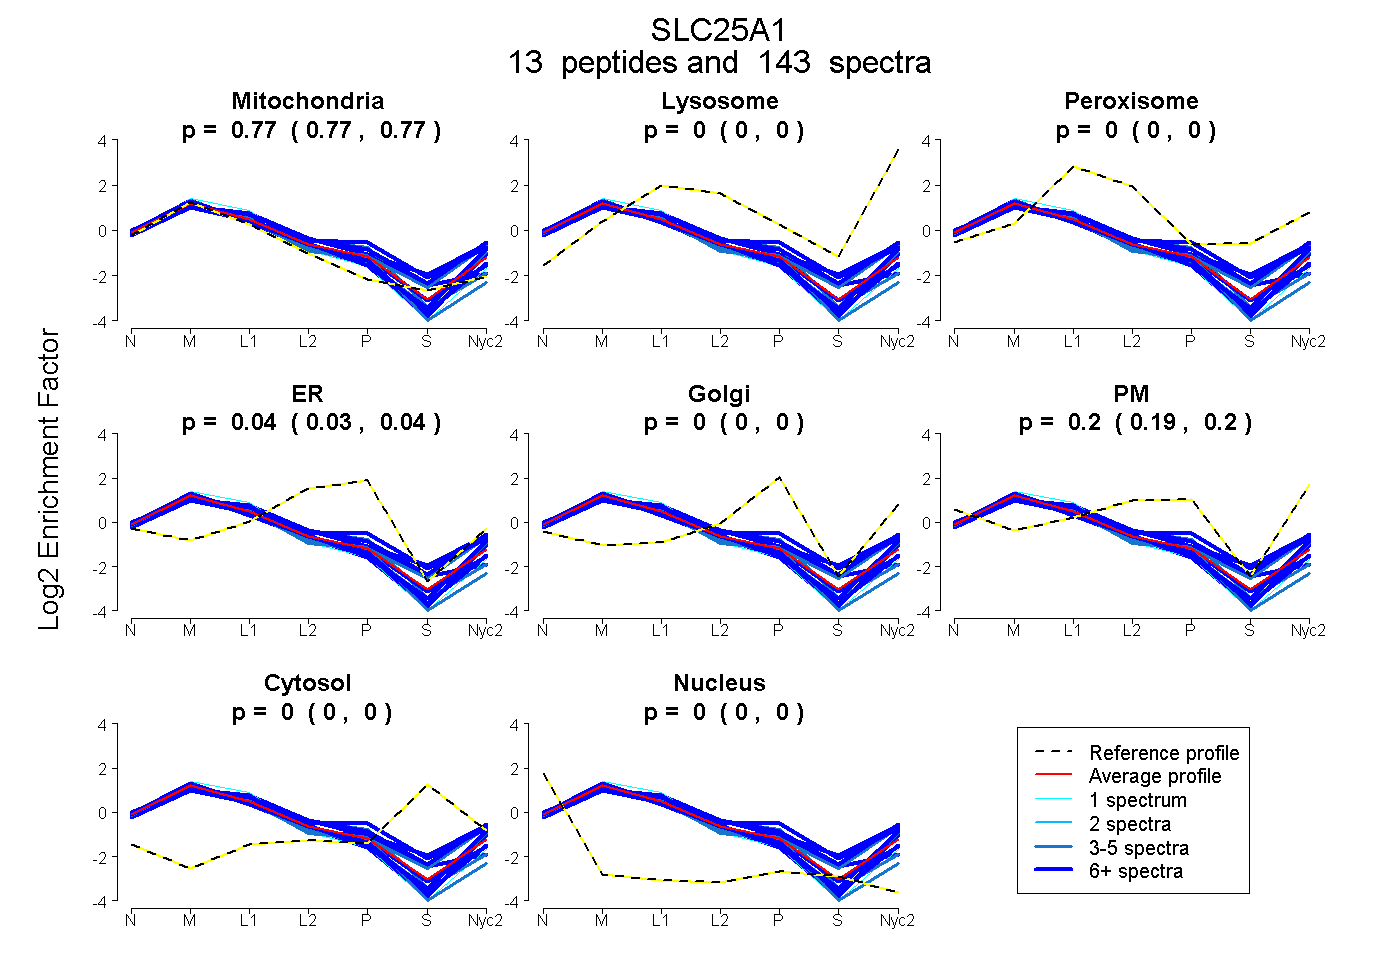
0.766 | 0.771
0.000 | 0.000
0.000 | 0.000
0.027 | 0.042
0.000 | 0.000
0.186 | 0.204
0.000 | 0.000
0.000 | 0.000
12peptides
spectra
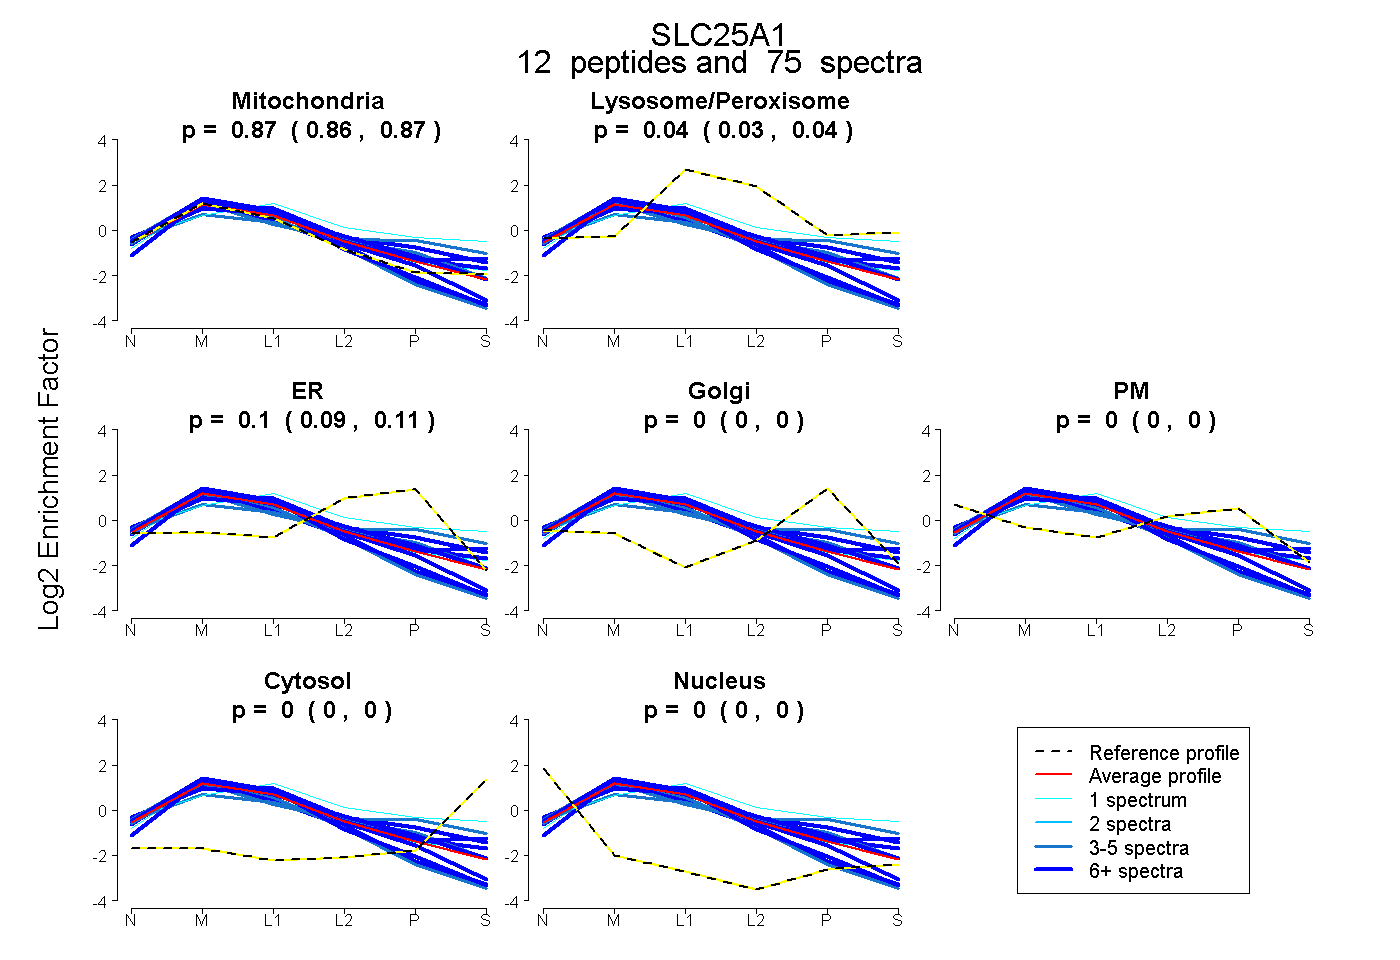
0.857 | 0.873
0.027 | 0.044
0.088 | 0.107
0.000 | 0.000
0.000 | 0.000
0.000 | 0.000
0.000 | 0.000
15peptides
spectra
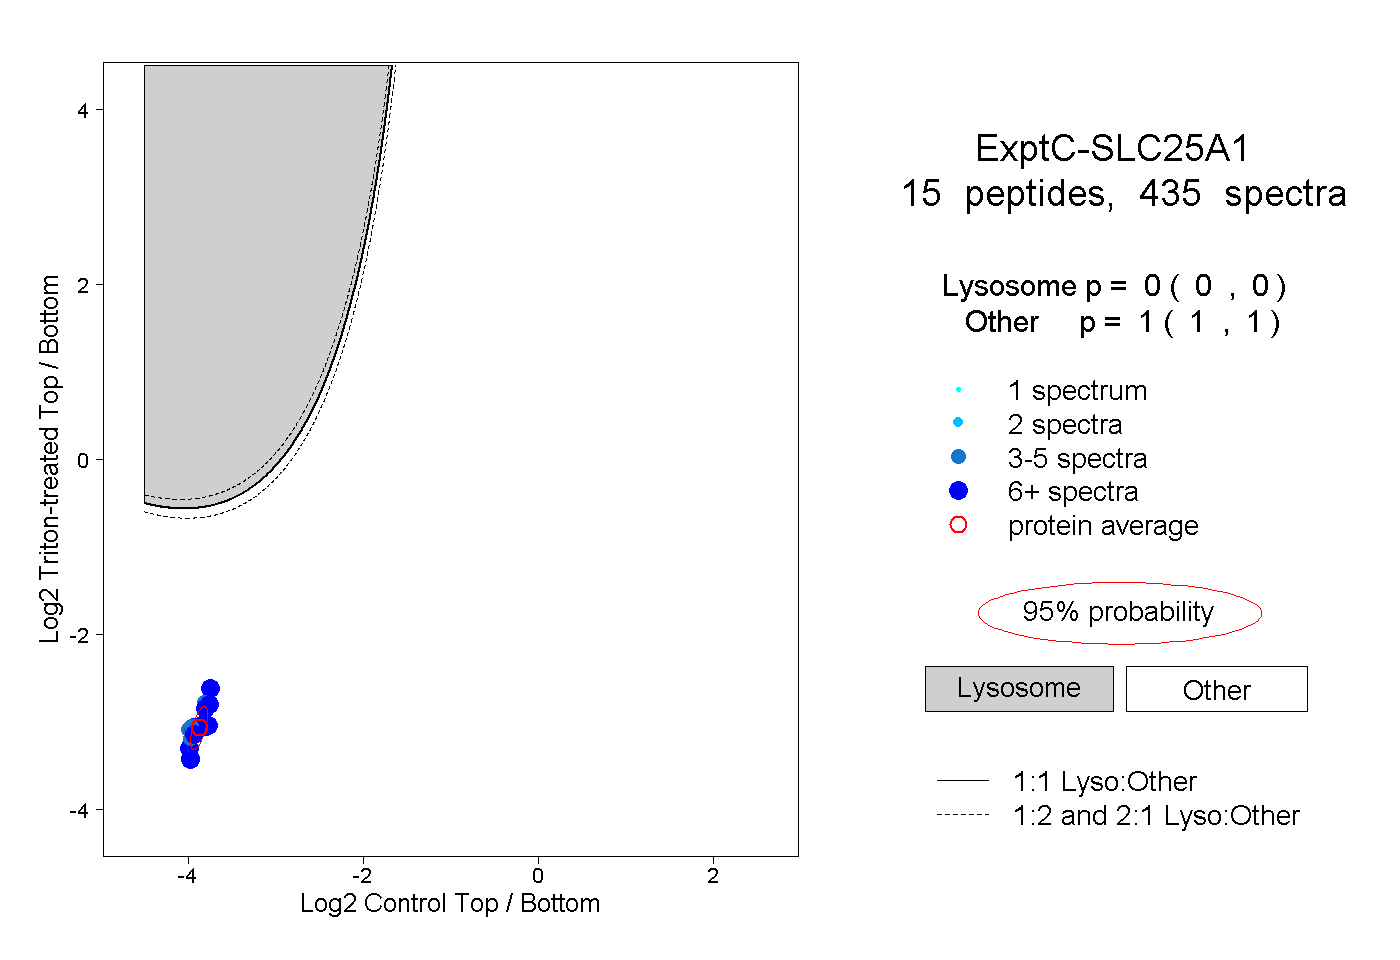
0.000 | 0.000
1.000 | 1.000
8peptides
spectra
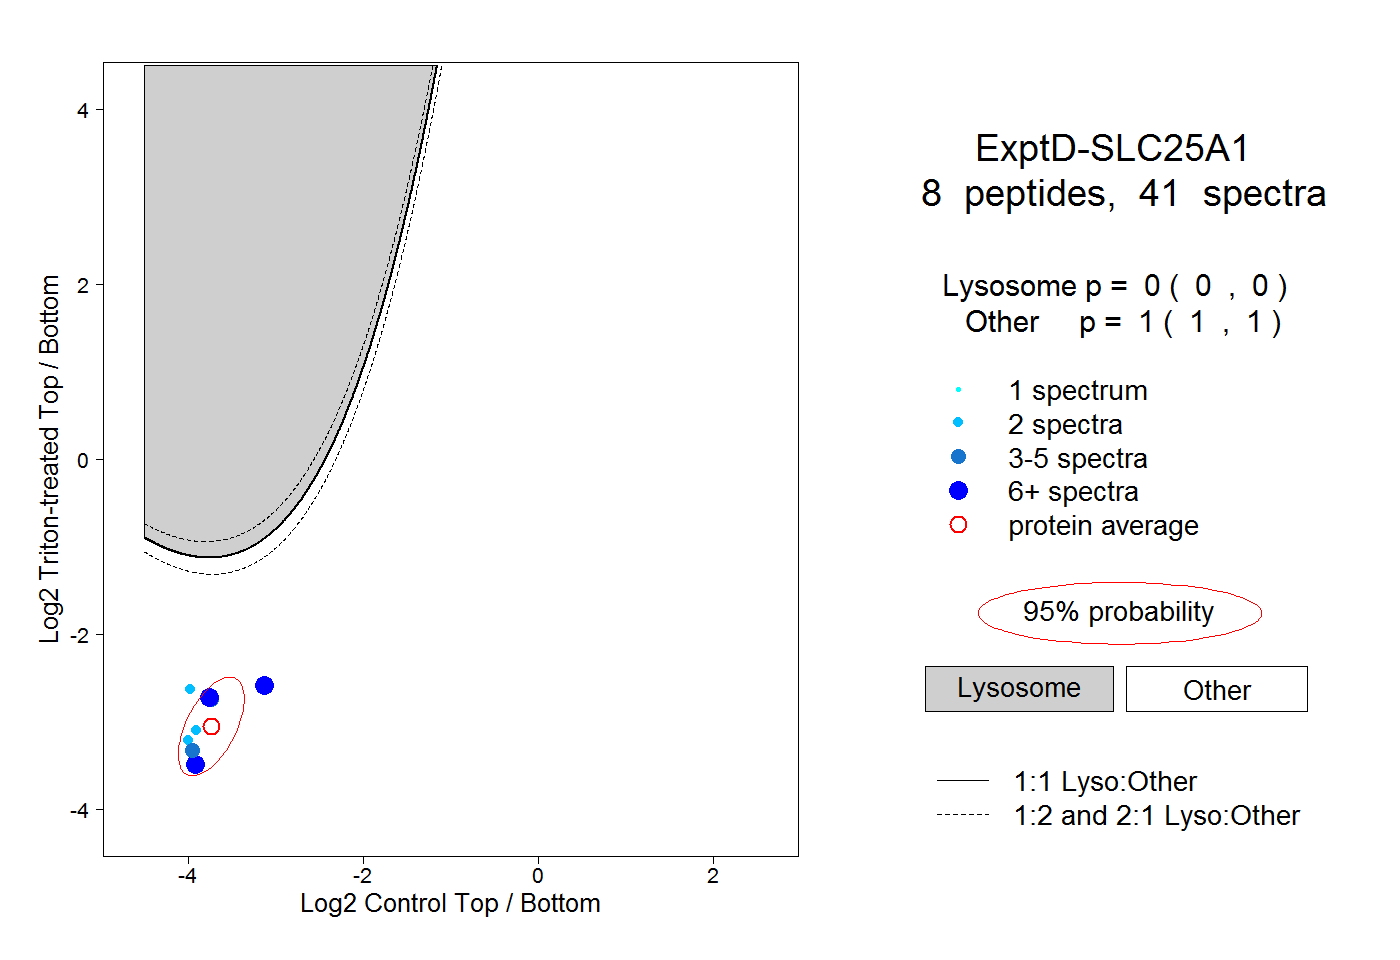
0.000 | 0.000
1.000 | 1.000