SLC25A1
[ENSRNOP00000000306]
Main page
| | | Plot |
Mito |
Lyso |
|
Perox |
ER |
Golgi |
PM |
Cytosol |
Nucleus |
|
| Expt A |
 13
13
peptides |
143
spectra |
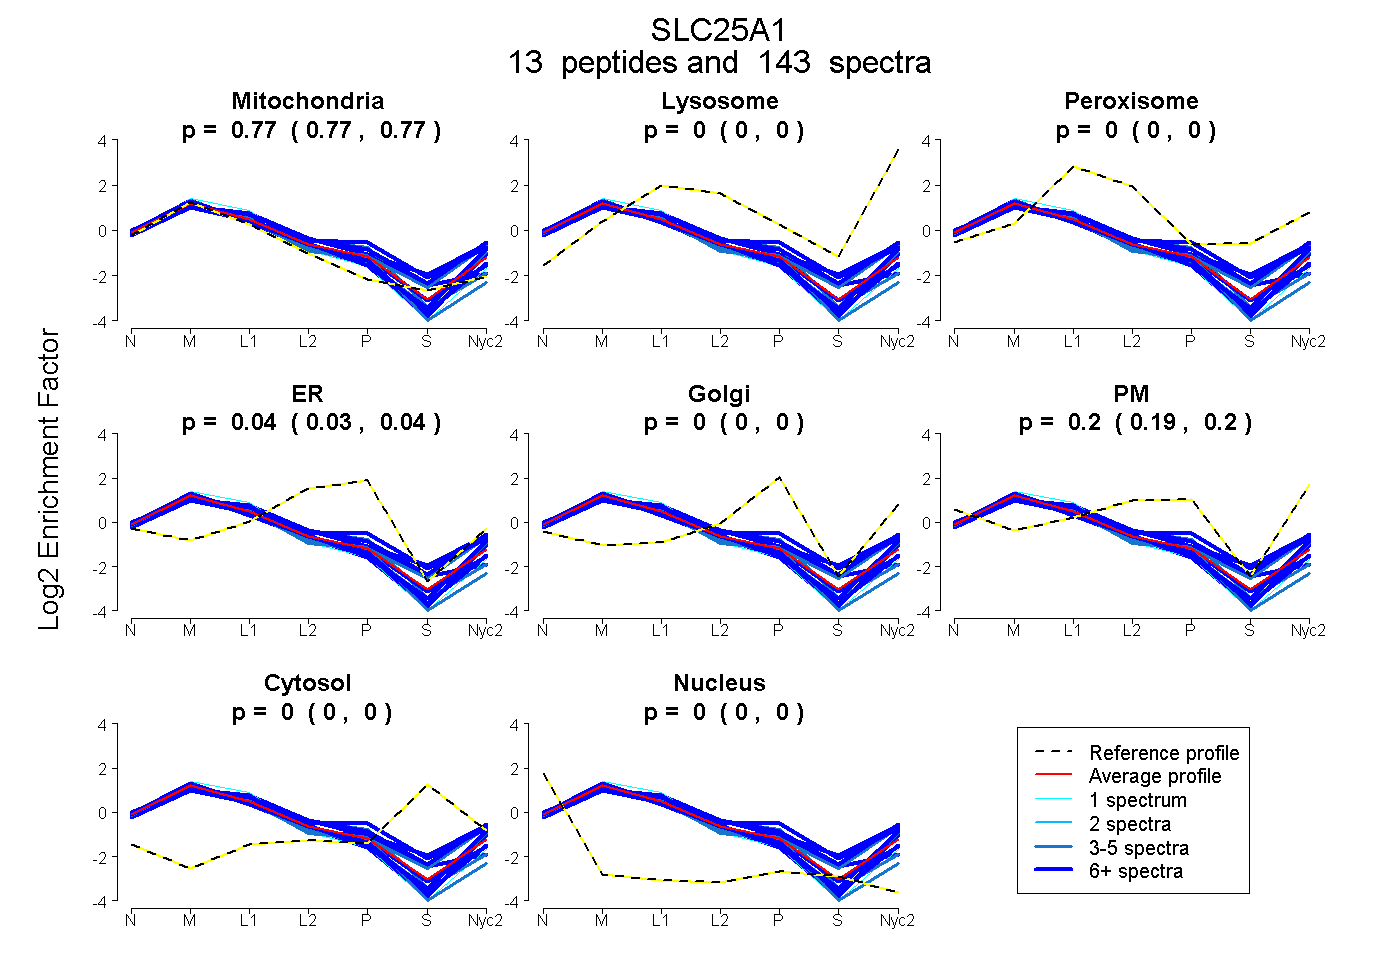 |
0.769
0.766 | 0.771 |
0.000
0.000 | 0.000 |
|
0.000
0.000 | 0.000 |
0.035
0.027 | 0.042 |
0.000
0.000 | 0.000 |
0.196
0.186 | 0.204 |
0.000
0.000 | 0.000 |
0.000
0.000 | 0.000 |
|
| | | Plot |
Mito |
|
Lyso or Perox |
|
ER |
Golgi |
PM |
Cytosol |
Nucleus |
|
| Expt B |
12
peptides |
75
spectra |
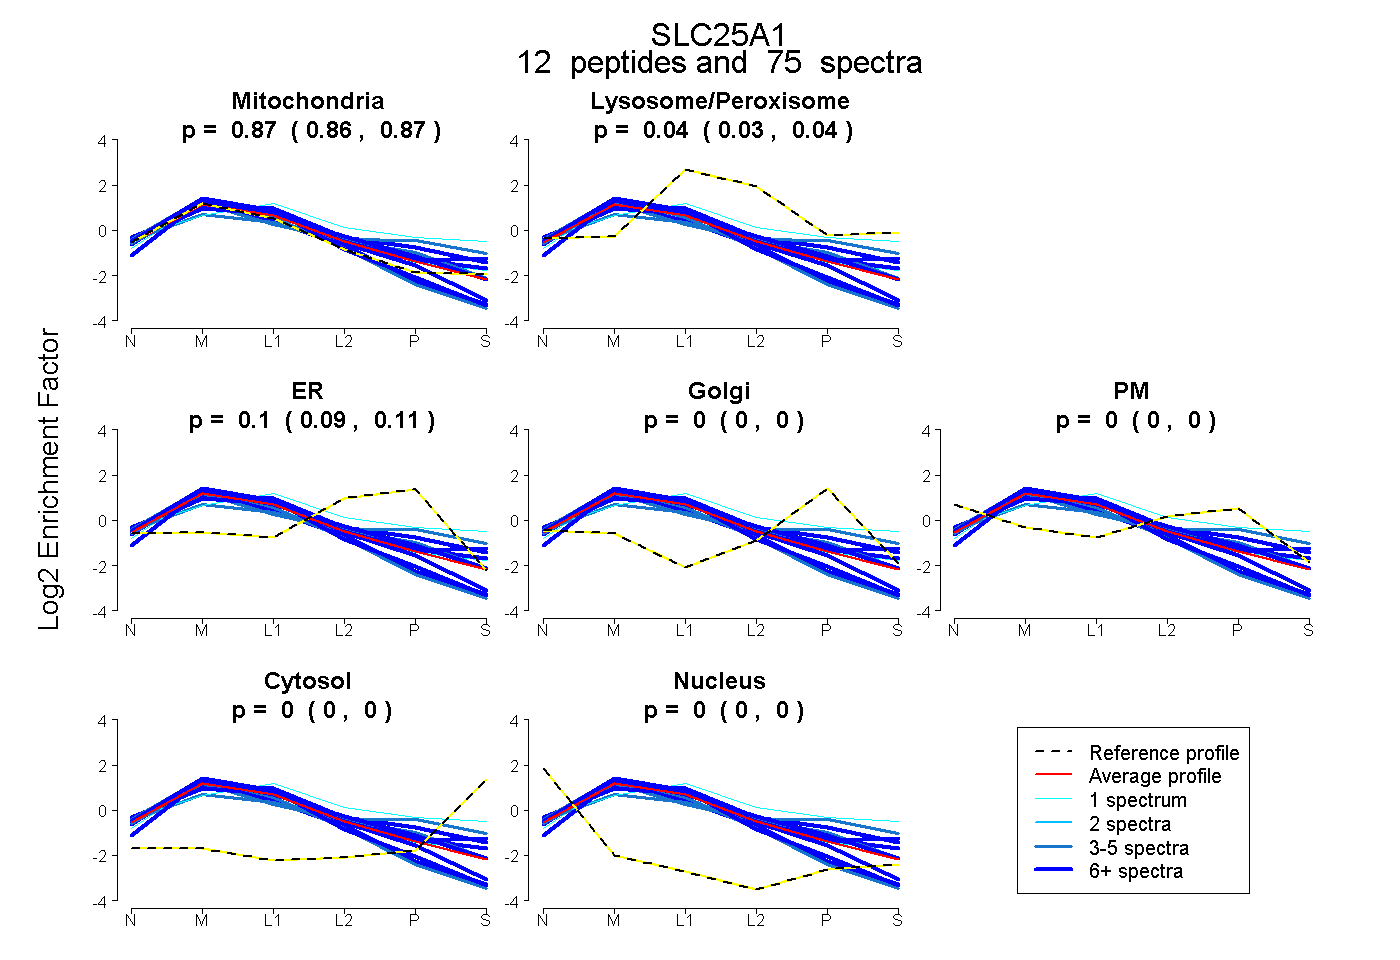 |
0.866
0.857 | 0.873 |
|
0.036
0.027 | 0.044 |
|
0.098
0.088 | 0.107 |
0.000
0.000 | 0.000 |
0.000
0.000 | 0.000 |
0.000
0.000 | 0.000 |
0.000
0.000 | 0.000 |
|
| | | Plot |
|
Lyso |
|
|
|
|
|
|
|
Other |
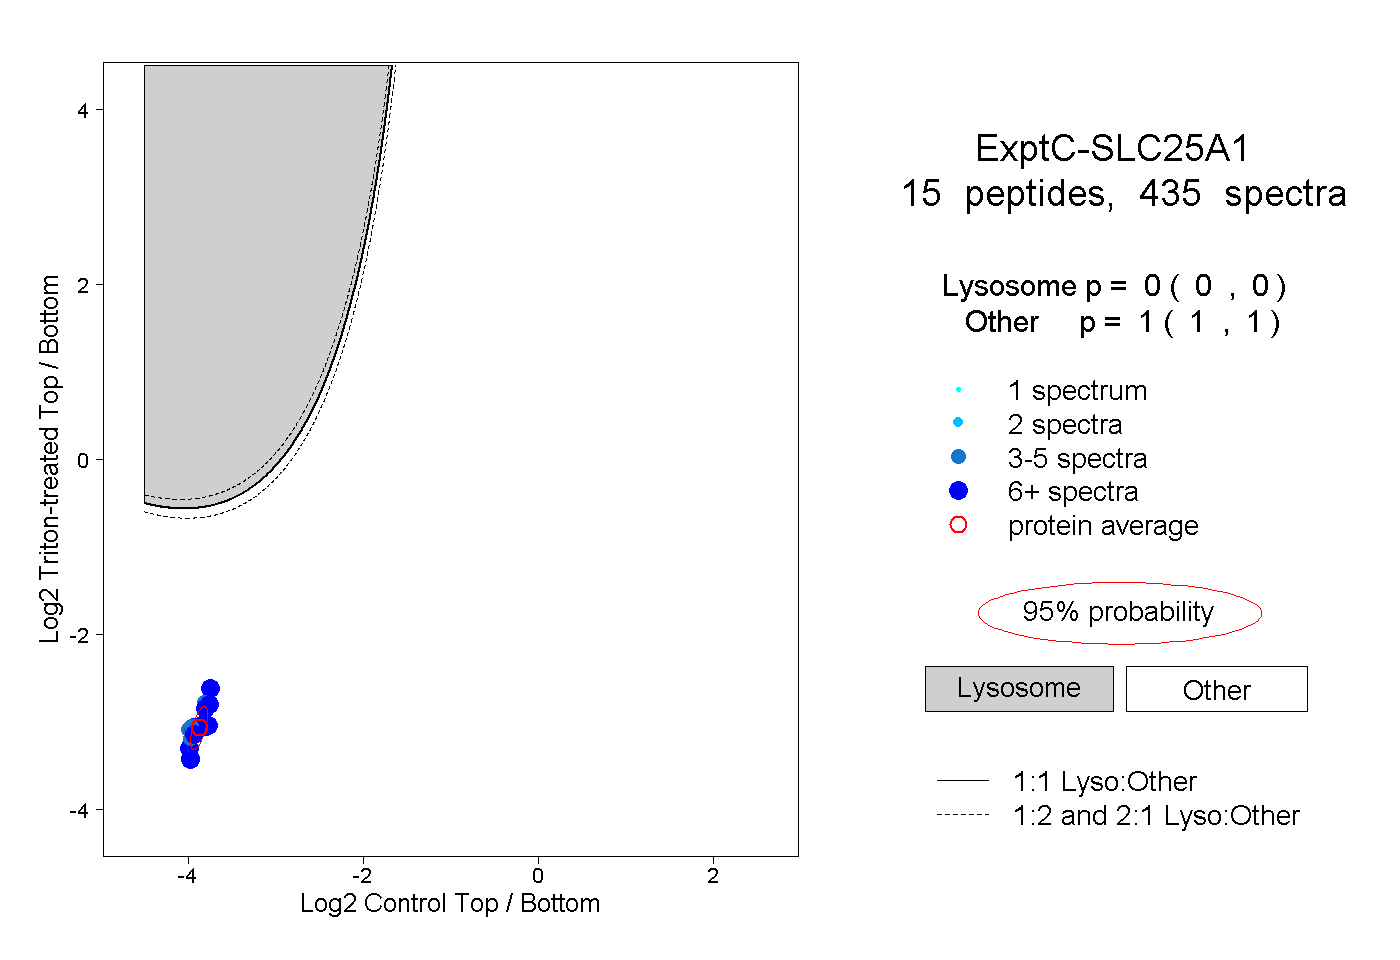
| Expt C |
15
peptides |
435
spectra |
 |
|
0.000
0.000 | 0.000 |
|
|
|
|
|
|
|
1.000
1.000 | 1.000 |
| 83 spectra, TQLQLDER |
|
0.000 |
|
|
|
|
|
|
|
1.000 |
| 4 spectra, GLSSLLYGSIPK |
|
0.000 |
|
|
|
|
|
|
|
1.000 |
| 58 spectra, GFFHGVR |
|
0.000 |
|
|
|
|
|
|
|
1.000 |
| 24 spectra, SHGVLGLYR |
|
0.000 |
|
|
|
|
|
|
|
1.000 |
| 93 spectra, MQGLEAHK |
|
0.000 |
|
|
|
|
|
|
|
1.000 |
| 5 spectra, LTHPGK |
|
0.000 |
|
|
|
|
|
|
|
1.000 |
| 30 spectra, IQGLEAHK |
|
0.000 |
|
|
|
|
|
|
|
1.000 |
| 32 spectra, GIGDCVR |
|
0.000 |
|
|
|
|
|
|
|
1.000 |
| 22 spectra, FGMFEFLSNHMR |
|
0.000 |
|
|
|
|
|
|
|
1.000 |
| 16 spectra, GTYQGLTATVLK |
|
0.000 |
|
|
|
|
|
|
|
1.000 |
| 5 spectra, FIHDQTSSNPK |
|
0.000 |
|
|
|
|
|
|
|
1.000 |
| 7 spectra, ALTAAAPGSGK |
|
0.000 |
|
|
|
|
|
|
|
1.000 |
| 24 spectra, NTLDCGVQILK |
|
0.000 |
|
|
|
|
|
|
|
1.000 |
| 27 spectra, FFVMTSLR |
|
0.000 |
|
|
|
|
|
|
|
1.000 |
| 5 spectra, QGSNQAIR |
|
0.000 |
|
|
|
|
|
|
|
1.000 |
| | | Plot |
|
Lyso |
|
|
|
|
|
|
|
Other |
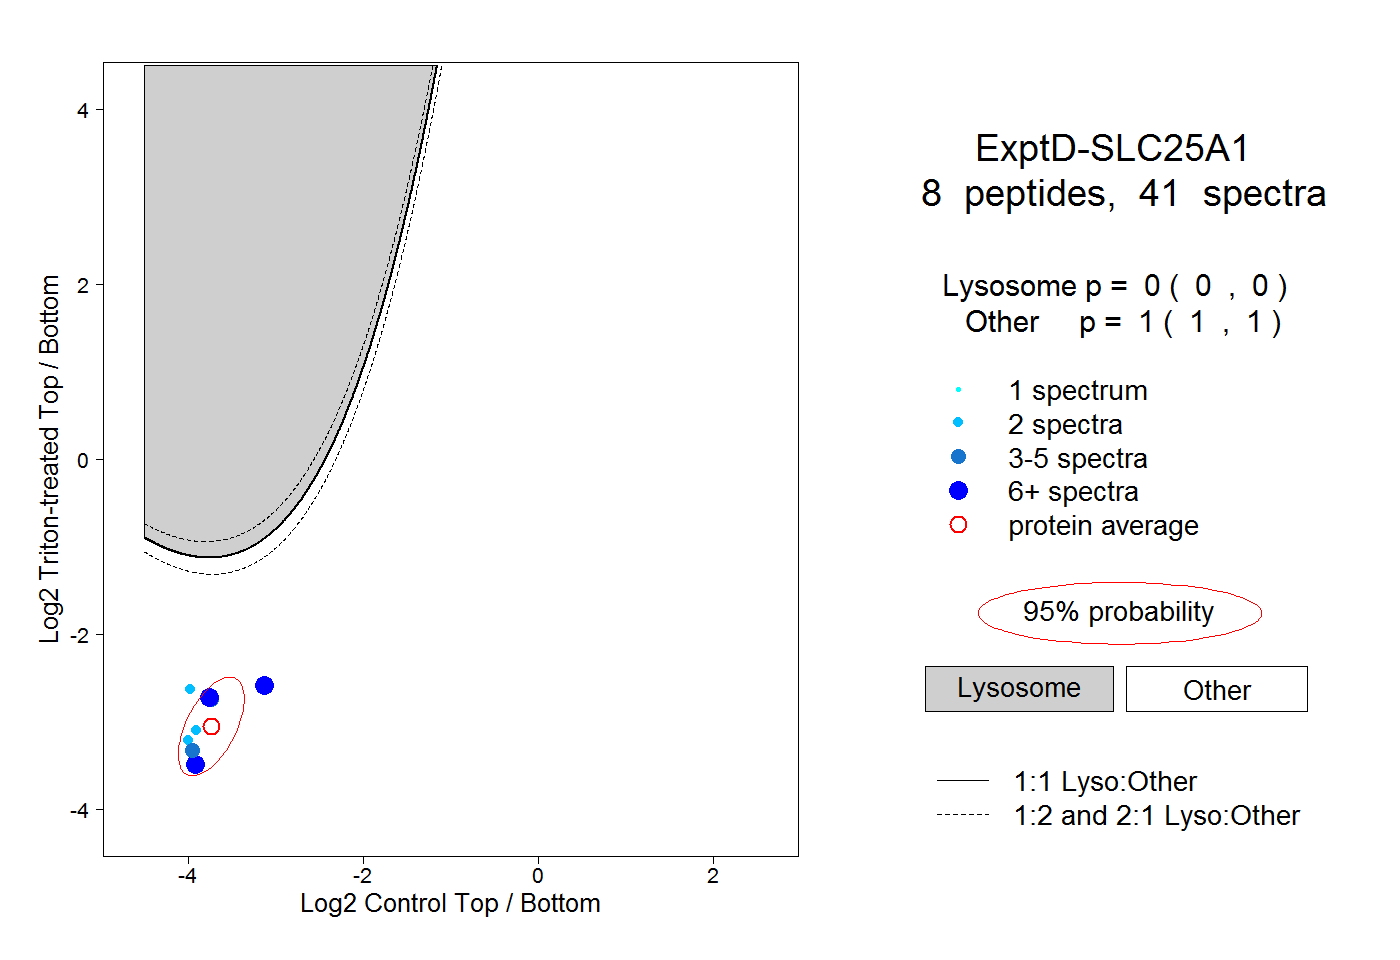
| Expt D |
8
peptides |
41
spectra |
 |
|
0.000
0.000 | 0.000 |
|
|
|
|
|
|
|
1.000
1.000 | 1.000 |