 13
13peptides
spectra
0.766 | 0.771
0.000 | 0.000
0.000 | 0.000
0.027 | 0.042
0.000 | 0.000
0.186 | 0.204
0.000 | 0.000
0.000 | 0.000
| Plot | Mito | Lyso | Perox | ER | Golgi | PM | Cytosol | Nucleus | |||||
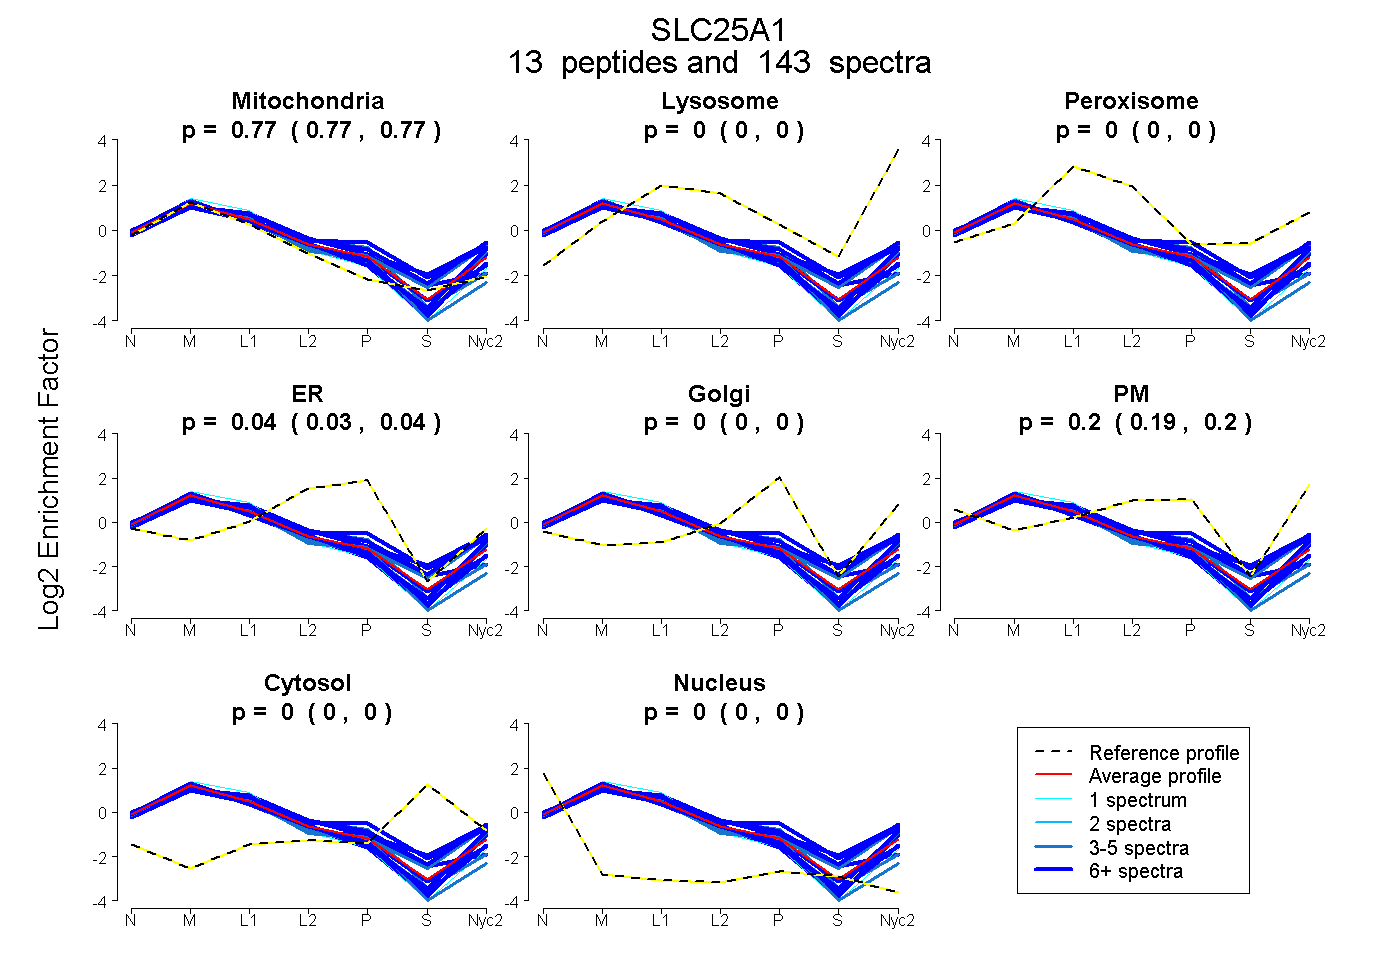
| Expt A |
13 peptides |
143 spectra |
|
0.769 0.766 | 0.771 |
0.000 0.000 | 0.000 |
0.000 0.000 | 0.000 |
0.035 0.027 | 0.042 |
0.000 0.000 | 0.000 |
0.196 0.186 | 0.204 |
0.000 0.000 | 0.000 |
0.000 0.000 | 0.000 |
| 12 spectra, TQLQLDER | 0.820 | 0.000 | 0.000 | 0.084 | 0.000 | 0.096 | 0.000 | 0.000 | ||
| 1 spectrum, GLSSLLYGSIPK | 0.902 | 0.000 | 0.000 | 0.064 | 0.000 | 0.034 | 0.000 | 0.000 | ||
| 26 spectra, GFFHGVR | 0.806 | 0.000 | 0.000 | 0.105 | 0.000 | 0.089 | 0.000 | 0.000 | ||
| 16 spectra, SHGVLGLYR | 0.624 | 0.078 | 0.049 | 0.000 | 0.000 | 0.249 | 0.000 | 0.000 | ||
| 3 spectra, LTHPGK | 0.876 | 0.000 | 0.000 | 0.124 | 0.000 | 0.000 | 0.000 | 0.000 | ||
| 6 spectra, IQGLEAHK | 0.586 | 0.047 | 0.116 | 0.000 | 0.233 | 0.018 | 0.000 | 0.000 | ||
| 16 spectra, GIGDCVR | 0.825 | 0.000 | 0.007 | 0.160 | 0.009 | 0.000 | 0.000 | 0.000 | ||
| 6 spectra, FGMFEFLSNHMR | 0.631 | 0.093 | 0.138 | 0.000 | 0.045 | 0.093 | 0.000 | 0.000 | ||
| 4 spectra, GTYQGLTATVLK | 0.730 | 0.091 | 0.000 | 0.000 | 0.032 | 0.148 | 0.000 | 0.000 | ||
| 4 spectra, FIHDQTSSNPK | 0.683 | 0.000 | 0.000 | 0.099 | 0.000 | 0.218 | 0.000 | 0.000 | ||
| 4 spectra, NTLDCGVQILK | 0.859 | 0.000 | 0.000 | 0.141 | 0.000 | 0.000 | 0.000 | 0.000 | ||
| 29 spectra, FFVMTSLR | 0.803 | 0.000 | 0.000 | 0.000 | 0.000 | 0.197 | 0.000 | 0.000 | ||
| 16 spectra, QGSNQAIR | 0.768 | 0.000 | 0.000 | 0.000 | 0.000 | 0.232 | 0.000 | 0.000 |
| Plot | Mito | Lyso or Perox | ER | Golgi | PM | Cytosol | Nucleus | ||||||
| Expt B |
12 peptides |
75 spectra |
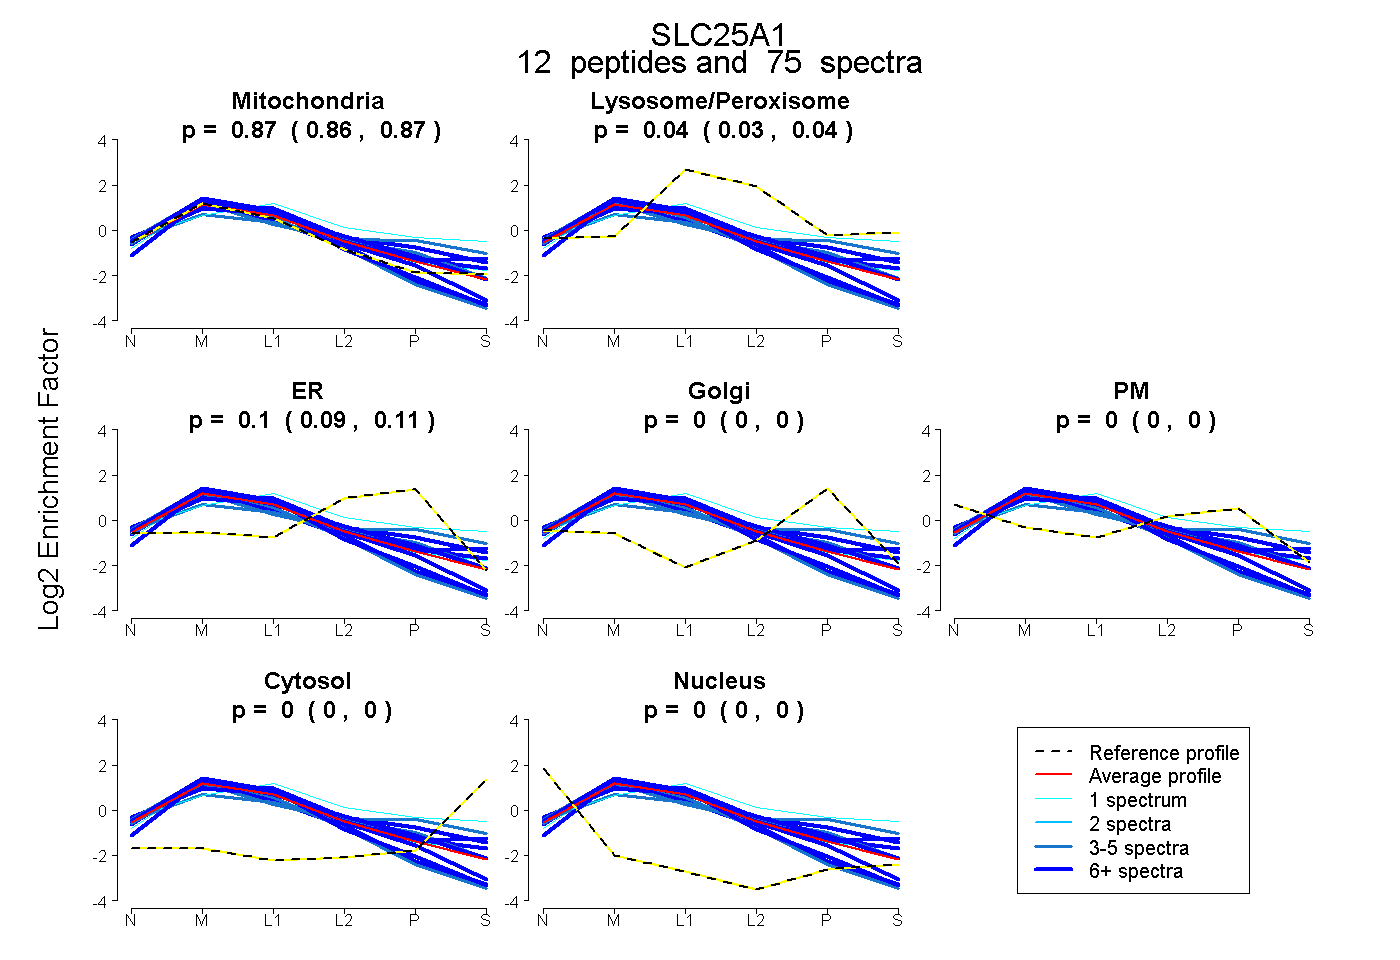 |
0.866 0.857 | 0.873 |
0.036 0.027 | 0.044 |
0.098 0.088 | 0.107 |
0.000 0.000 | 0.000 |
0.000 0.000 | 0.000 |
0.000 0.000 | 0.000 |
0.000 0.000 | 0.000 |
|||
| Plot | Lyso | Other | |||||||||||
| Expt C |
15 peptides |
435 spectra |
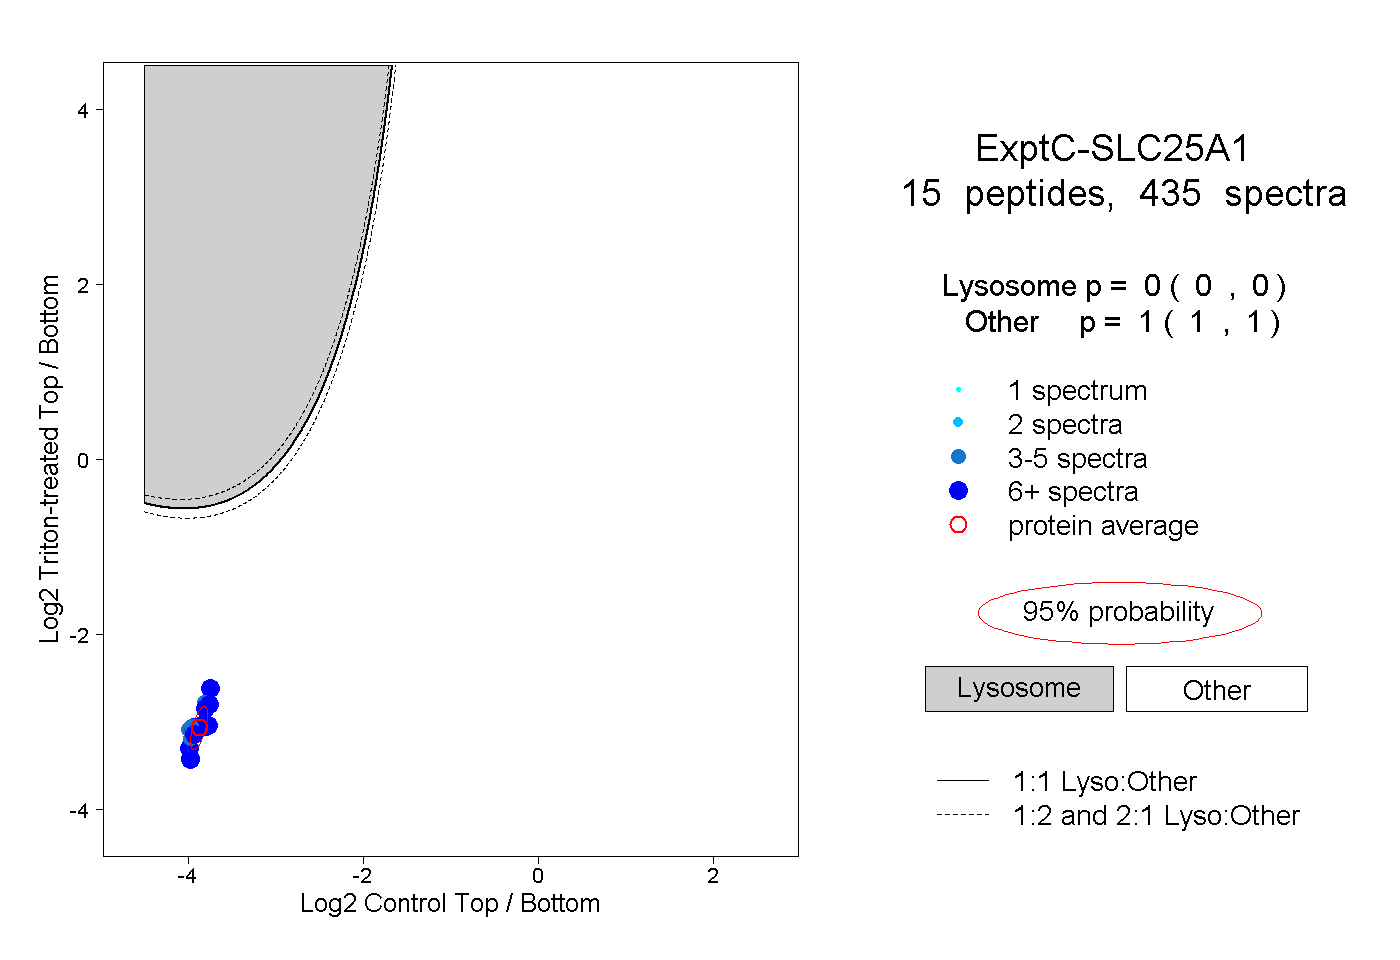 |
0.000 0.000 | 0.000 |
1.000 1.000 | 1.000 |
||||||||
| Plot | Lyso | Other | |||||||||||
| Expt D |
8 peptides |
41 spectra |
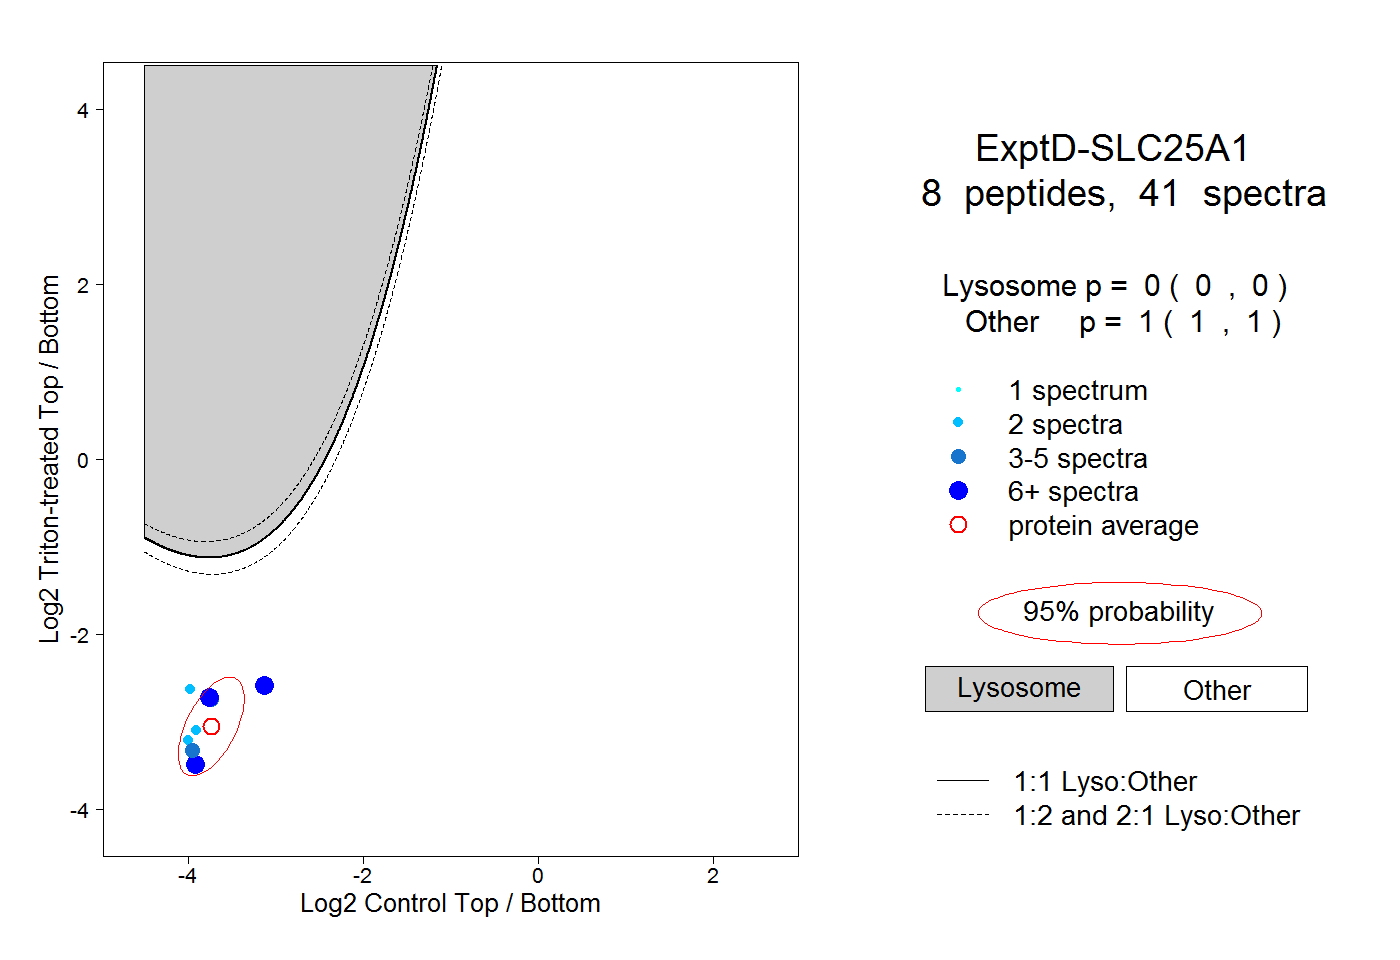 |
0.000 0.000 | 0.000 |
1.000 1.000 | 1.000 |