 5
5peptides
spectra
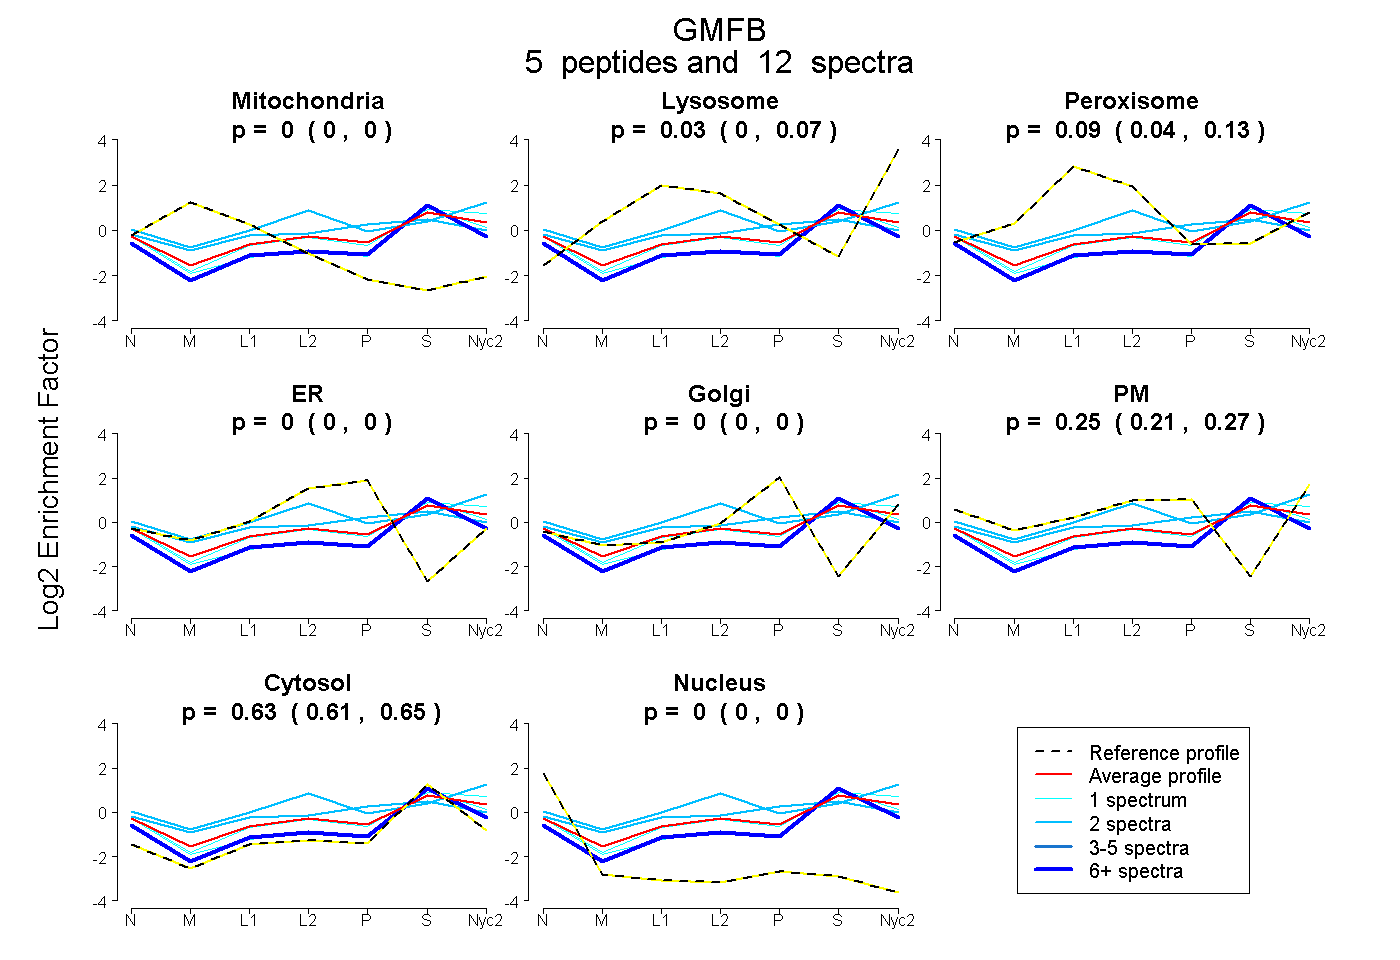
0.000 | 0.000
0.000 | 0.071
0.038 | 0.133
0.000 | 0.000
0.000 | 0.000
0.212 | 0.271
0.609 | 0.653
0.000 | 0.000
3peptides
spectra
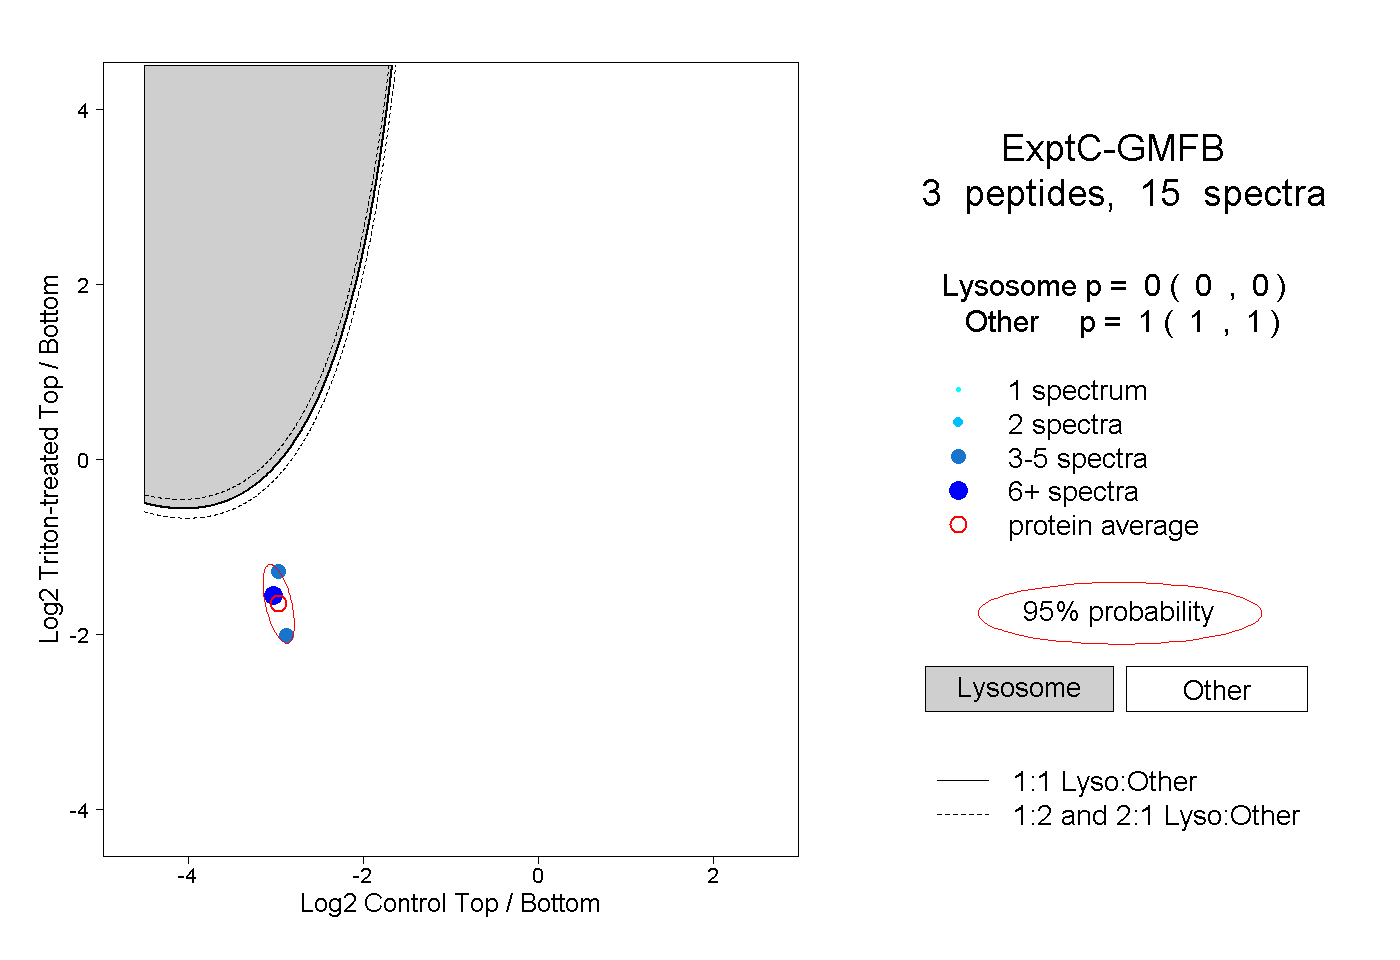
0.000 | 0.000
1.000 | 1.000
1peptide
spectra
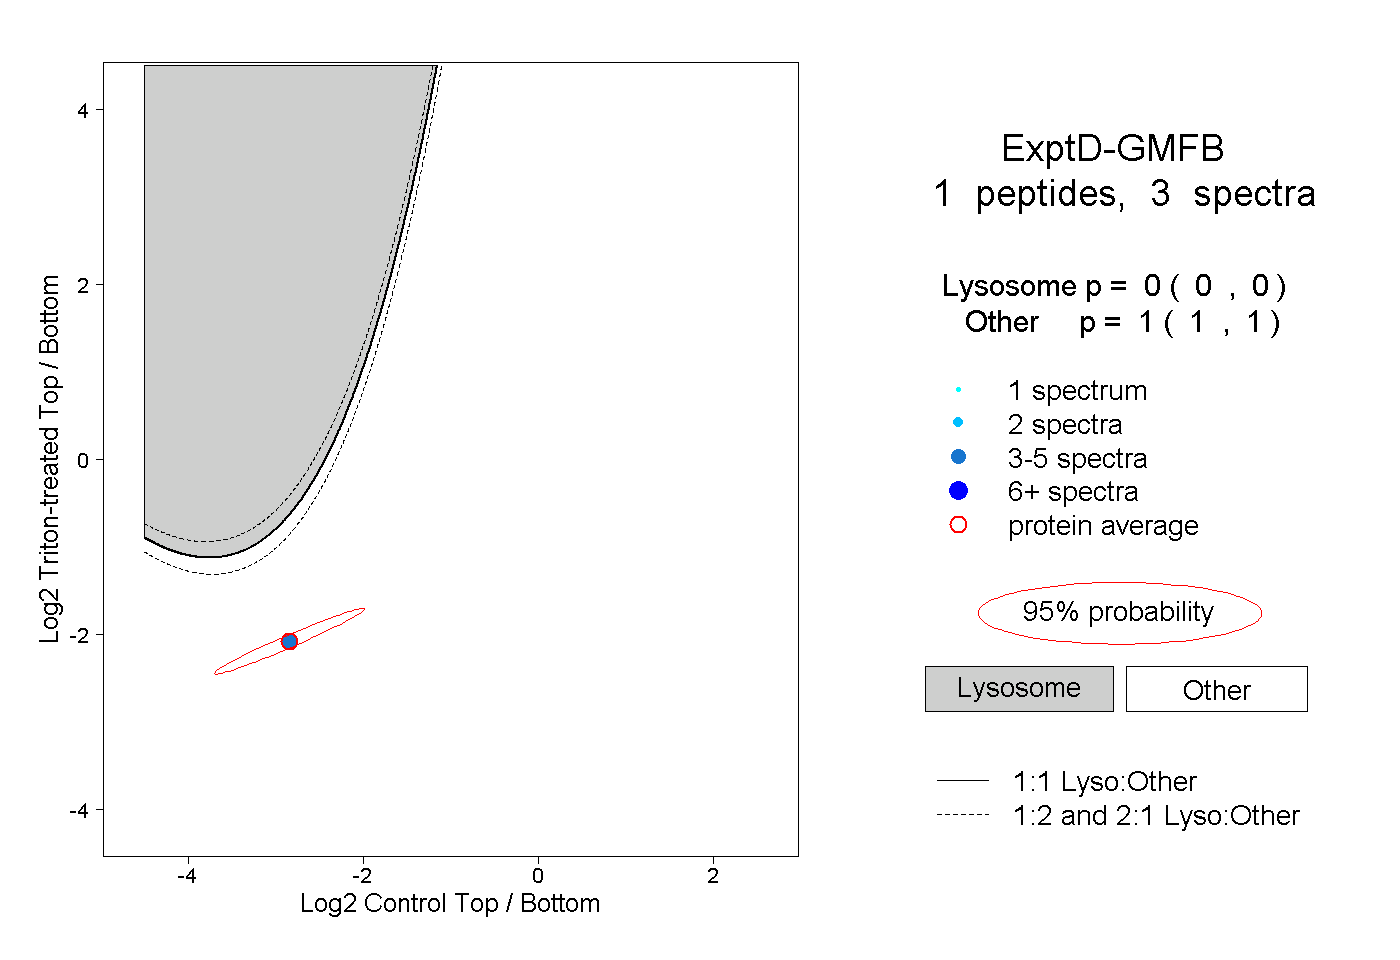
0.000 | 0.000
1.000 | 1.000