 5
5peptides
spectra
0.000 | 0.000
0.000 | 0.071
0.038 | 0.133
0.000 | 0.000
0.000 | 0.000
0.212 | 0.271
0.609 | 0.653
0.000 | 0.000
| Plot | Mito | Lyso | Perox | ER | Golgi | PM | Cytosol | Nucleus | |||||
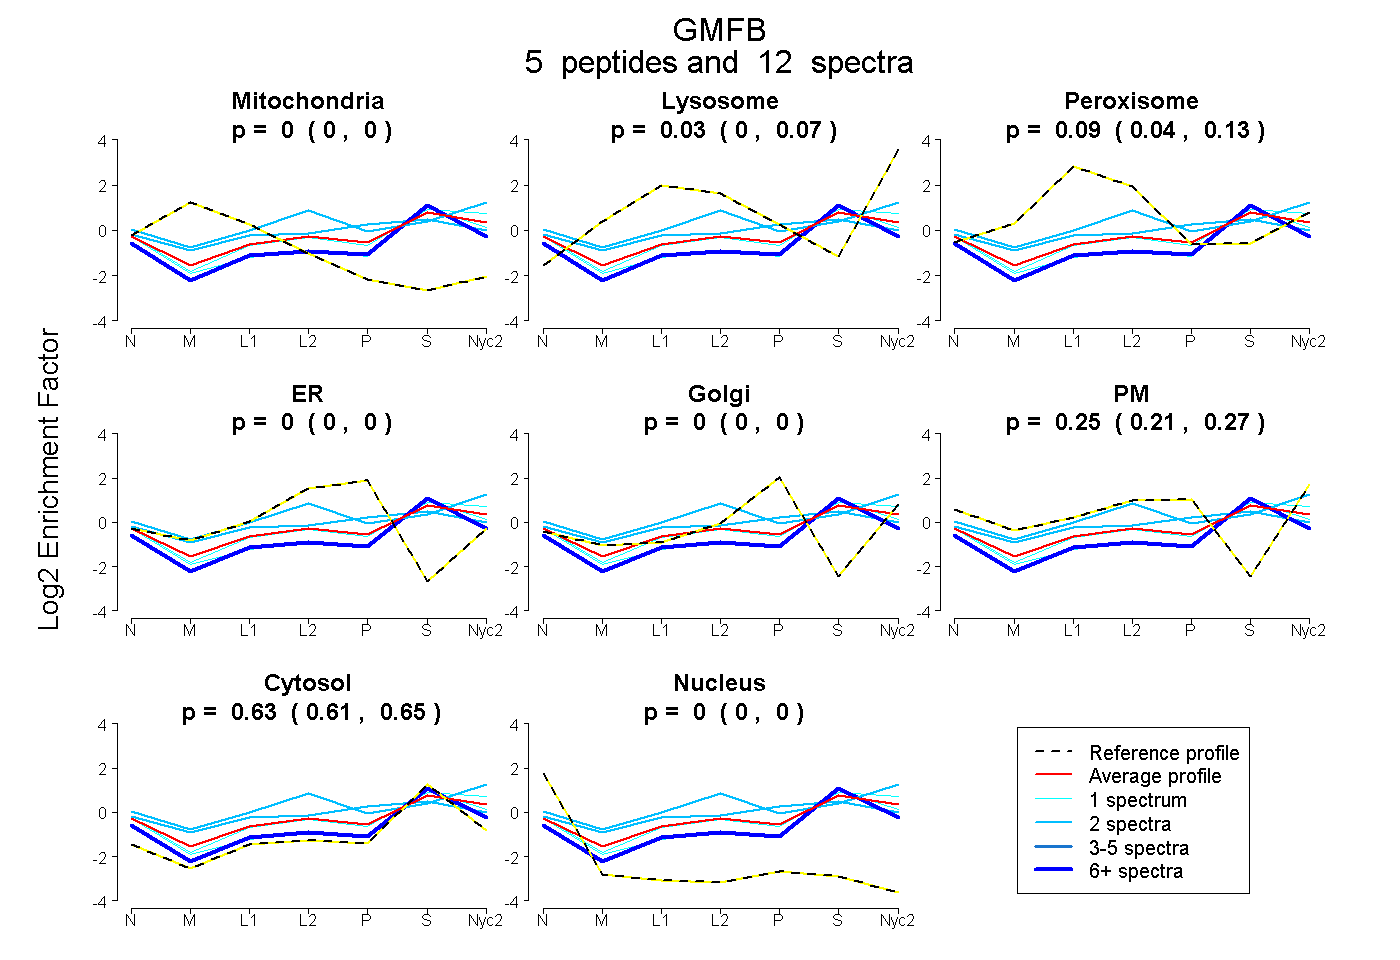
| Expt A |
5 peptides |
12 spectra |
|
0.000 0.000 | 0.000 |
0.031 0.000 | 0.071 |
0.091 0.038 | 0.133 |
0.000 0.000 | 0.000 |
0.000 0.000 | 0.000 |
0.246 0.212 | 0.271 |
0.633 0.609 | 0.653 |
0.000 0.000 | 0.000 |
| 1 spectrum, LVQTAELTK | 0.000 | 0.000 | 0.000 | 0.000 | 0.000 | 0.208 | 0.792 | 0.000 | ||
| 6 spectra, NTEDLTEEWLR | 0.000 | 0.000 | 0.017 | 0.000 | 0.000 | 0.139 | 0.844 | 0.000 | ||
| 2 spectra, YQHDDGR | 0.000 | 0.159 | 0.167 | 0.000 | 0.000 | 0.309 | 0.365 | 0.000 | ||
| 2 spectra, ETHNAAIIMK | 0.000 | 0.000 | 0.225 | 0.000 | 0.158 | 0.145 | 0.473 | 0.000 | ||
| 1 spectrum, DELPER | 0.000 | 0.139 | 0.000 | 0.000 | 0.000 | 0.198 | 0.663 | 0.000 |
| Plot | Lyso | Other | |||||||||||
| Expt C |
3 peptides |
15 spectra |
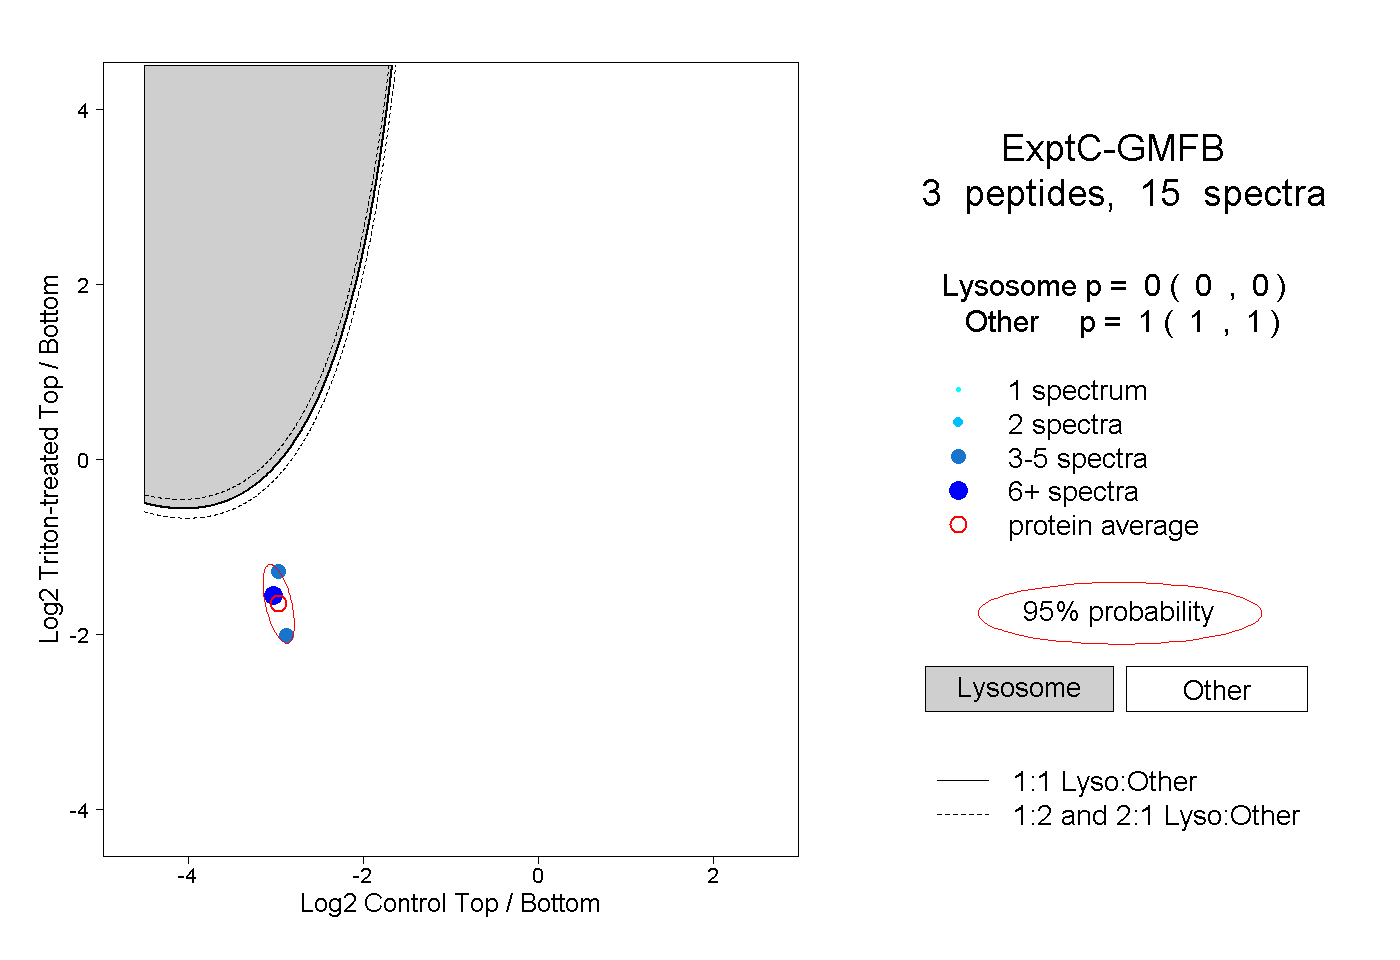 |
0.000 0.000 | 0.000 |
1.000 1.000 | 1.000 |
||||||||
| Plot | Lyso | Other | |||||||||||
| Expt D |
1 peptide |
3 spectra |
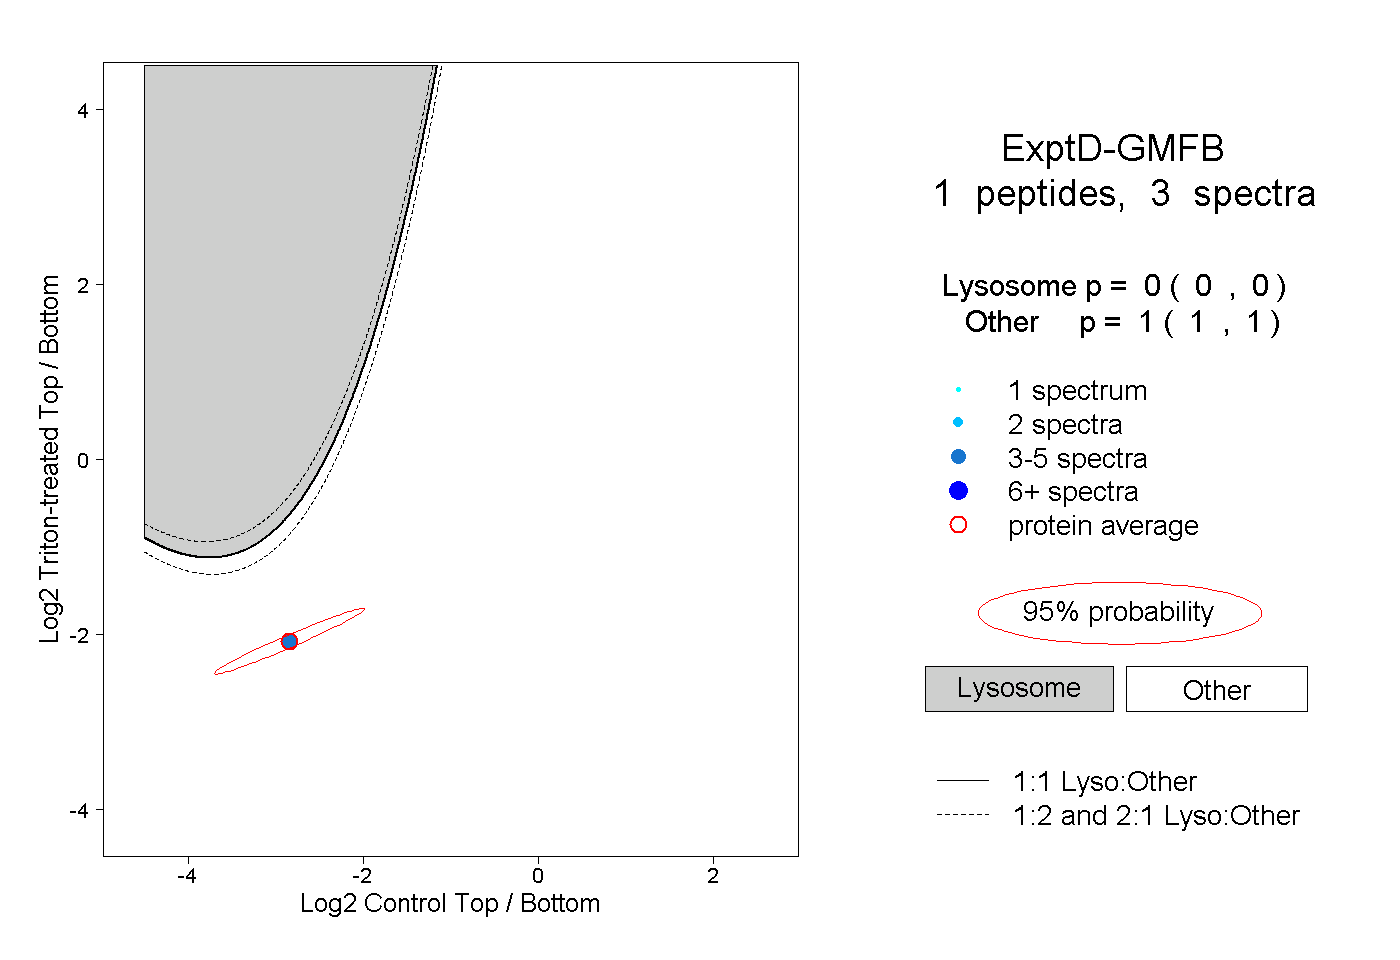 |
0.000 0.000 | 0.000 |
1.000 1.000 | 1.000 |