 5
5peptides
spectra
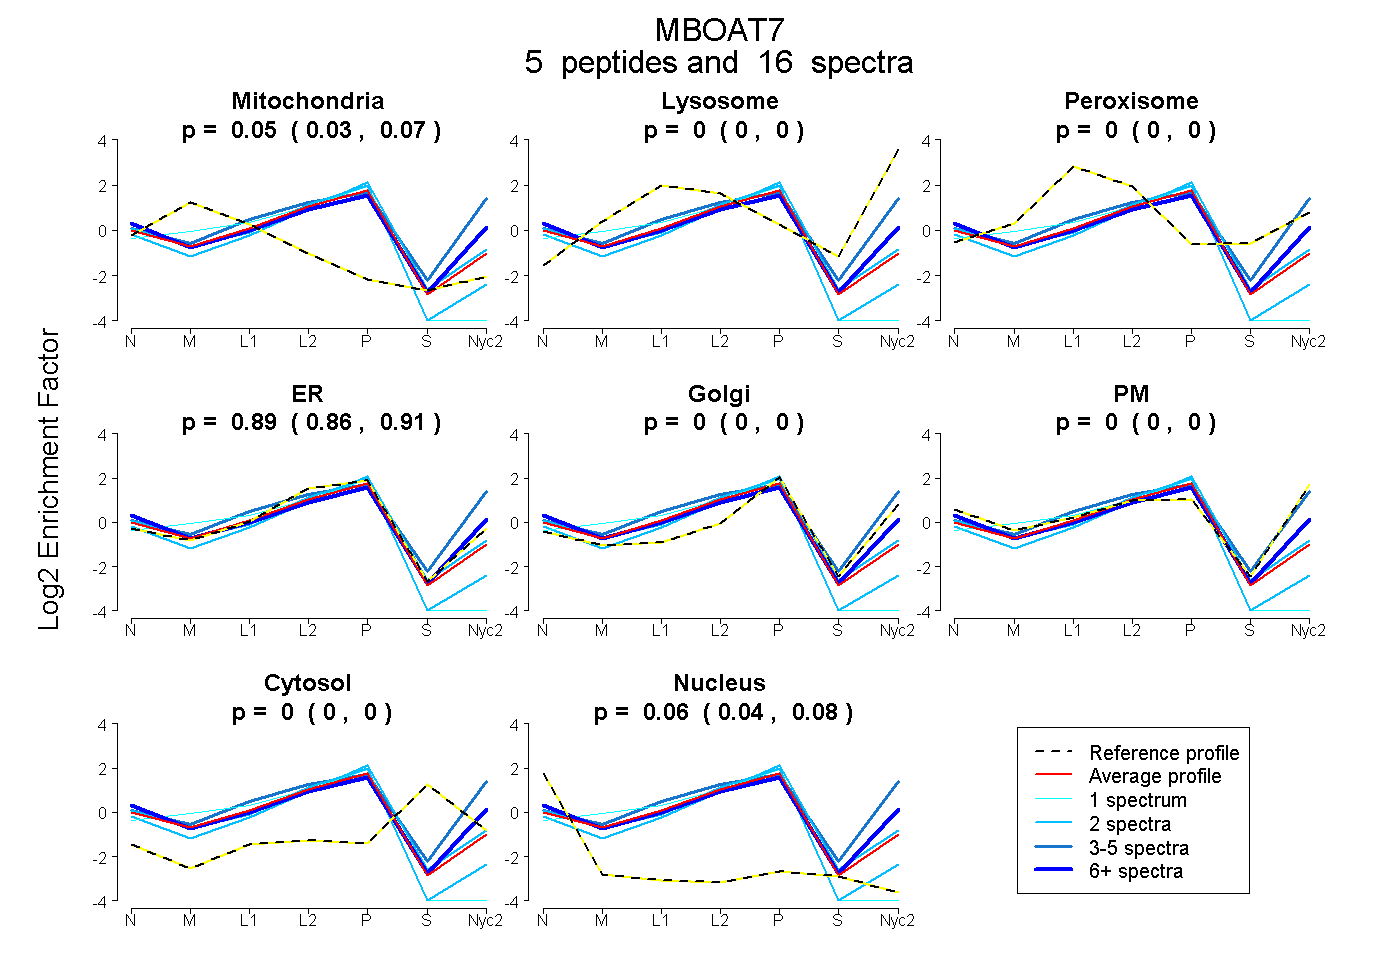
0.032 | 0.065
0.000 | 0.000
0.000 | 0.000
0.861 | 0.912
0.000 | 0.000
0.000 | 0.000
0.000 | 0.000
0.038 | 0.076
3peptides
spectra
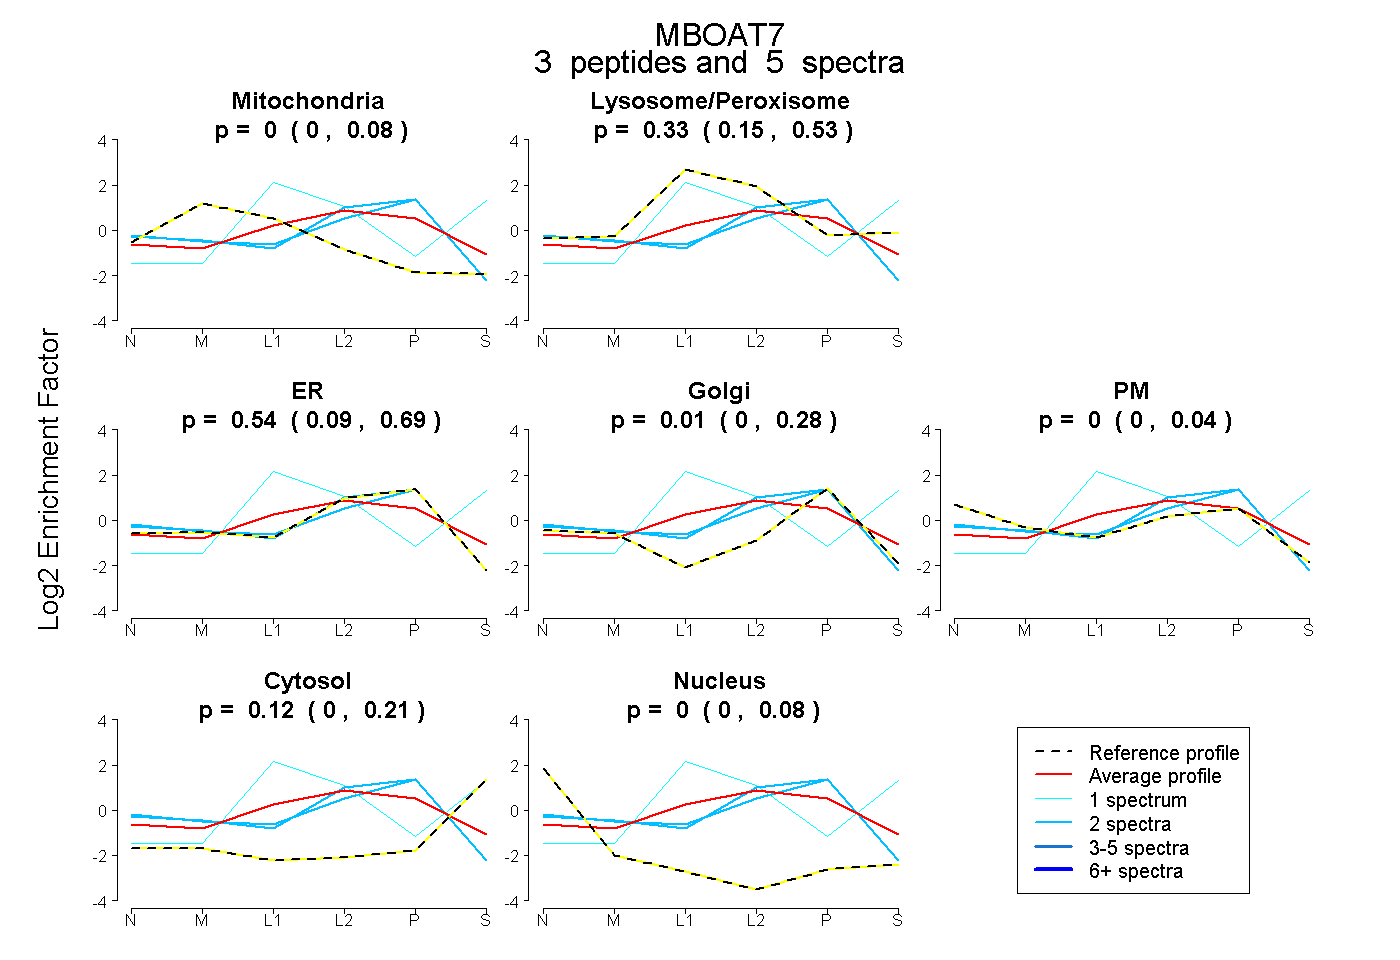
0.000 | 0.082
0.151 | 0.527
0.095 | 0.695
0.000 | 0.285
0.000 | 0.041
0.000 | 0.211
0.000 | 0.080
6peptides
spectra
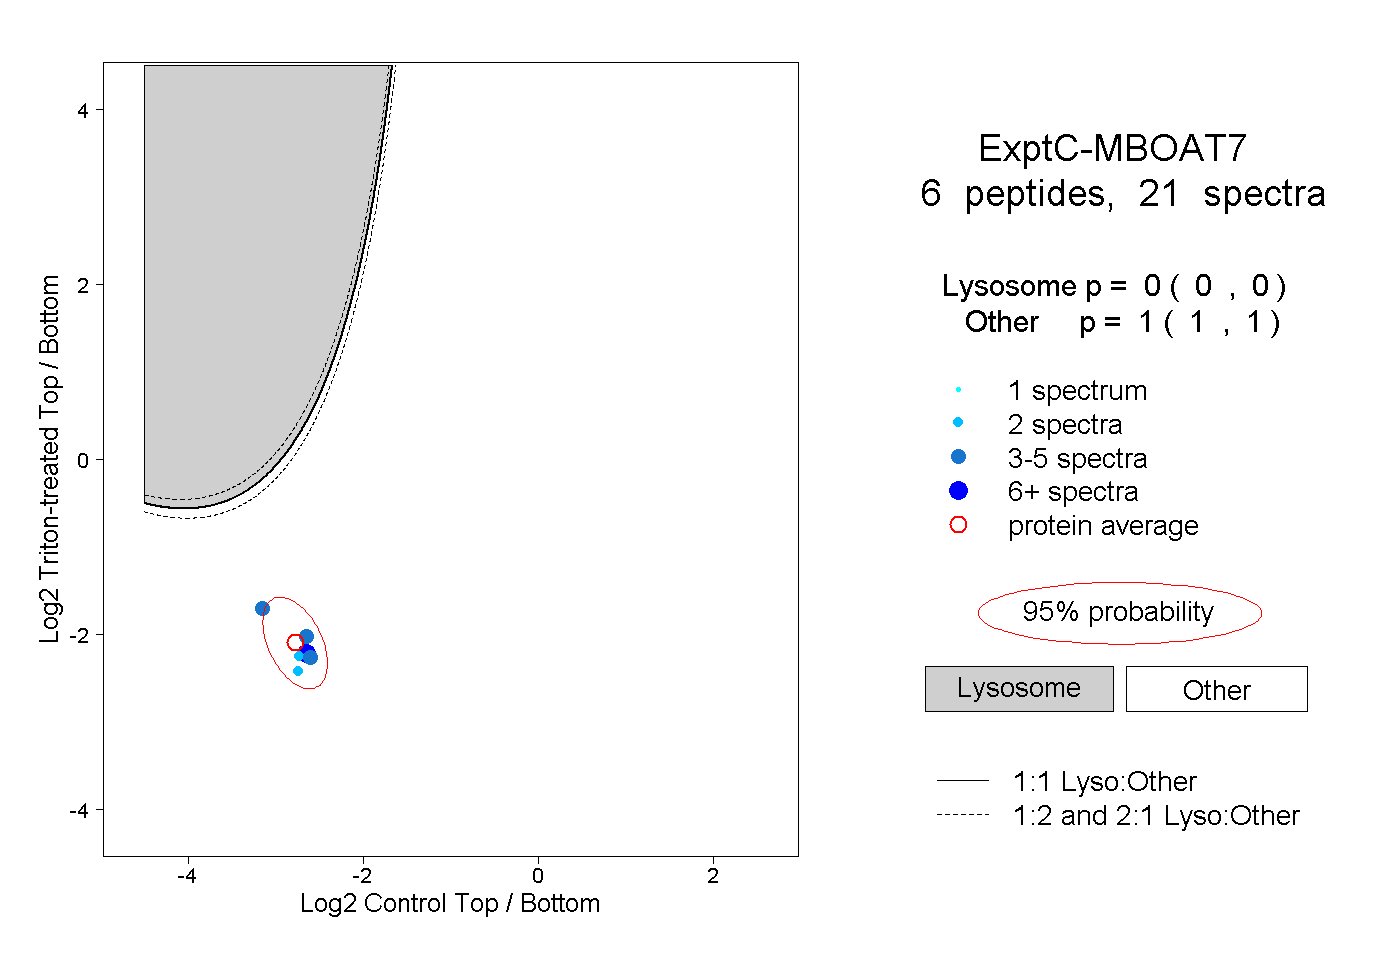
0.000 | 0.000
1.000 | 1.000
1peptide
spectra
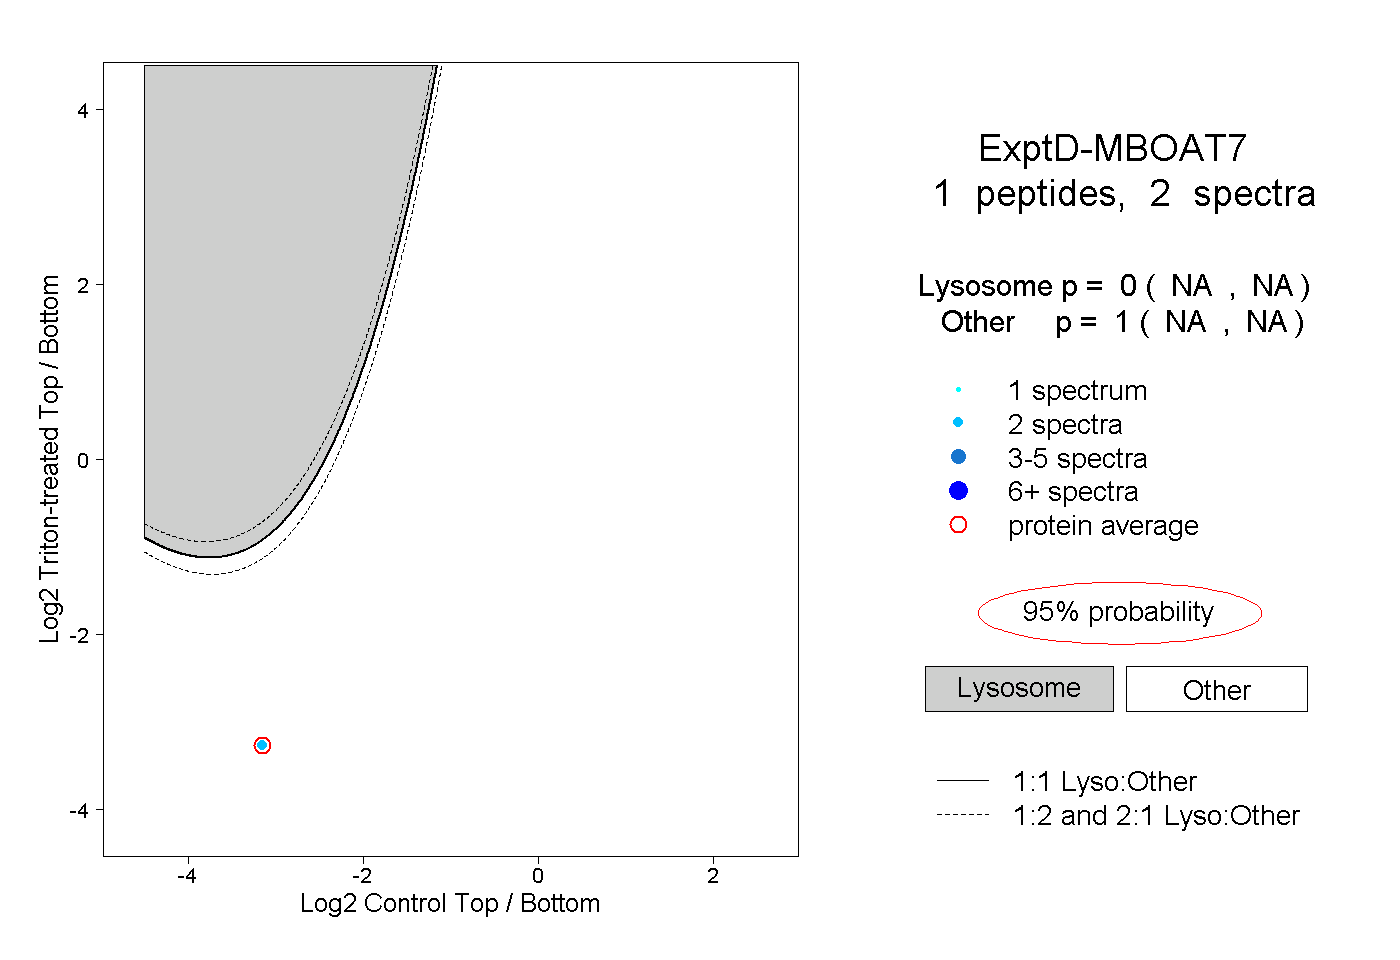
NA | NA
NA | NA