 5
5peptides
spectra
0.032 | 0.065
0.000 | 0.000
0.000 | 0.000
0.861 | 0.912
0.000 | 0.000
0.000 | 0.000
0.000 | 0.000
0.038 | 0.076
| Plot | Mito | Lyso | Perox | ER | Golgi | PM | Cytosol | Nucleus | |||||
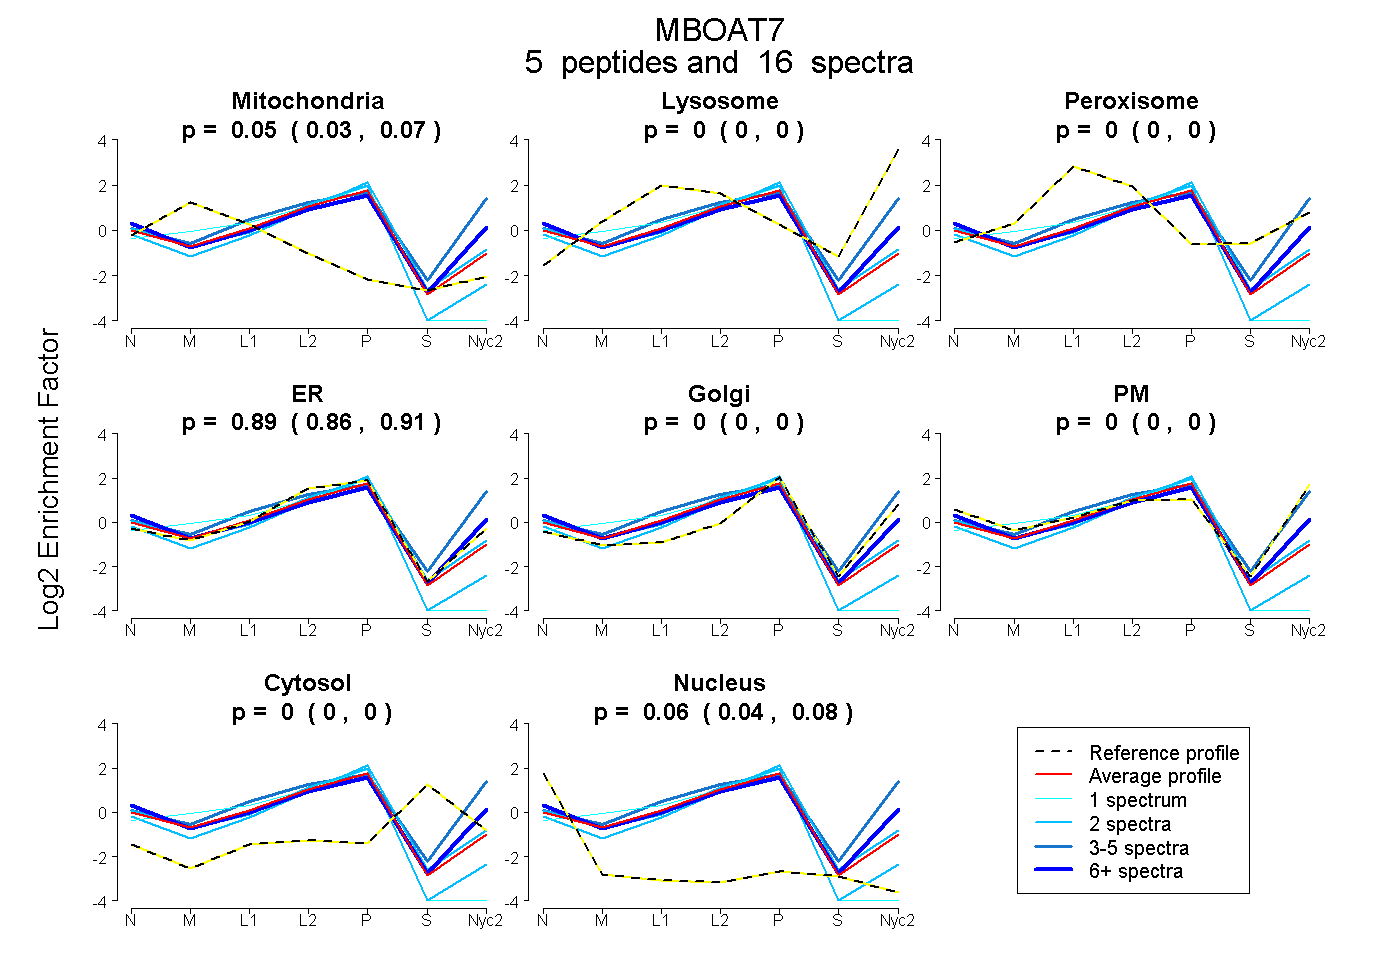
| Expt A |
5 peptides |
16 spectra |
|
0.050 0.032 | 0.065 |
0.000 0.000 | 0.000 |
0.000 0.000 | 0.000 |
0.891 0.861 | 0.912 |
0.000 0.000 | 0.000 |
0.000 0.000 | 0.000 |
0.000 0.000 | 0.000 |
0.059 0.038 | 0.076 |
| 1 spectrum, LVSLASEVQDLHLAQR | 0.234 | 0.000 | 0.000 | 0.697 | 0.000 | 0.000 | 0.000 | 0.069 | ||
| 2 spectra, EMASGFSK | 0.000 | 0.000 | 0.000 | 0.874 | 0.053 | 0.000 | 0.000 | 0.073 | ||
| 7 spectra, TPSQATTSQAK | 0.000 | 0.000 | 0.000 | 0.600 | 0.030 | 0.310 | 0.000 | 0.060 | ||
| 4 spectra, EDAFYARPLPTR | 0.000 | 0.141 | 0.000 | 0.325 | 0.069 | 0.465 | 0.000 | 0.000 | ||
| 2 spectra, NIDCYGTDFCVR | 0.010 | 0.000 | 0.000 | 0.857 | 0.000 | 0.000 | 0.000 | 0.133 |
| Plot | Mito | Lyso or Perox | ER | Golgi | PM | Cytosol | Nucleus | ||||||
| Expt B |
3 peptides |
5 spectra |
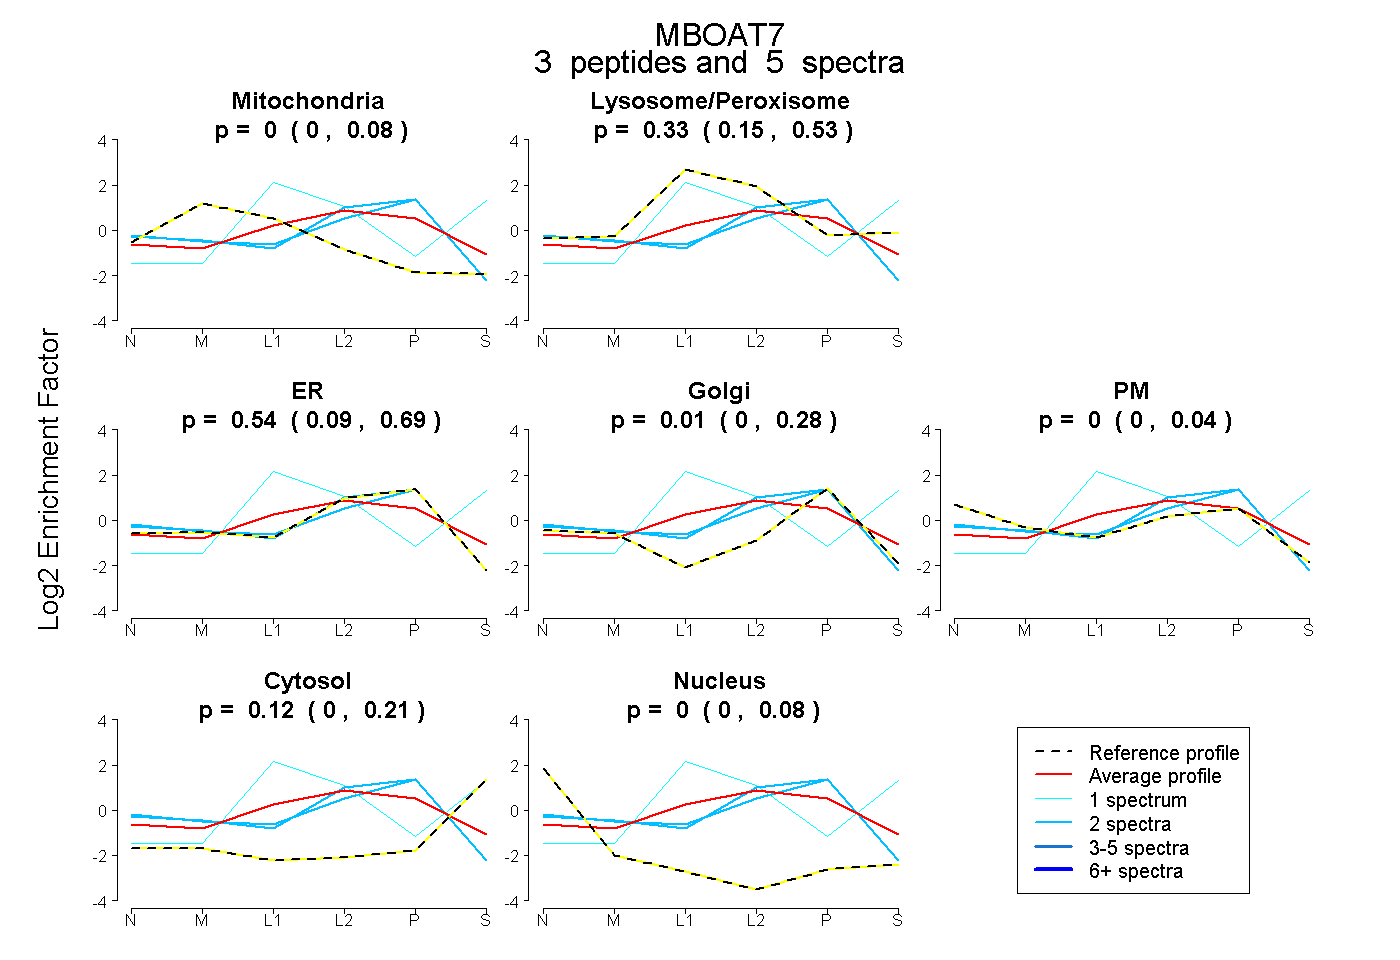 |
0.000 0.000 | 0.082 |
0.328 0.151 | 0.527 |
0.537 0.095 | 0.695 |
0.009 0.000 | 0.285 |
0.000 0.000 | 0.041 |
0.123 0.000 | 0.211 |
0.002 0.000 | 0.080 |
|||
| Plot | Lyso | Other | |||||||||||
| Expt C |
6 peptides |
21 spectra |
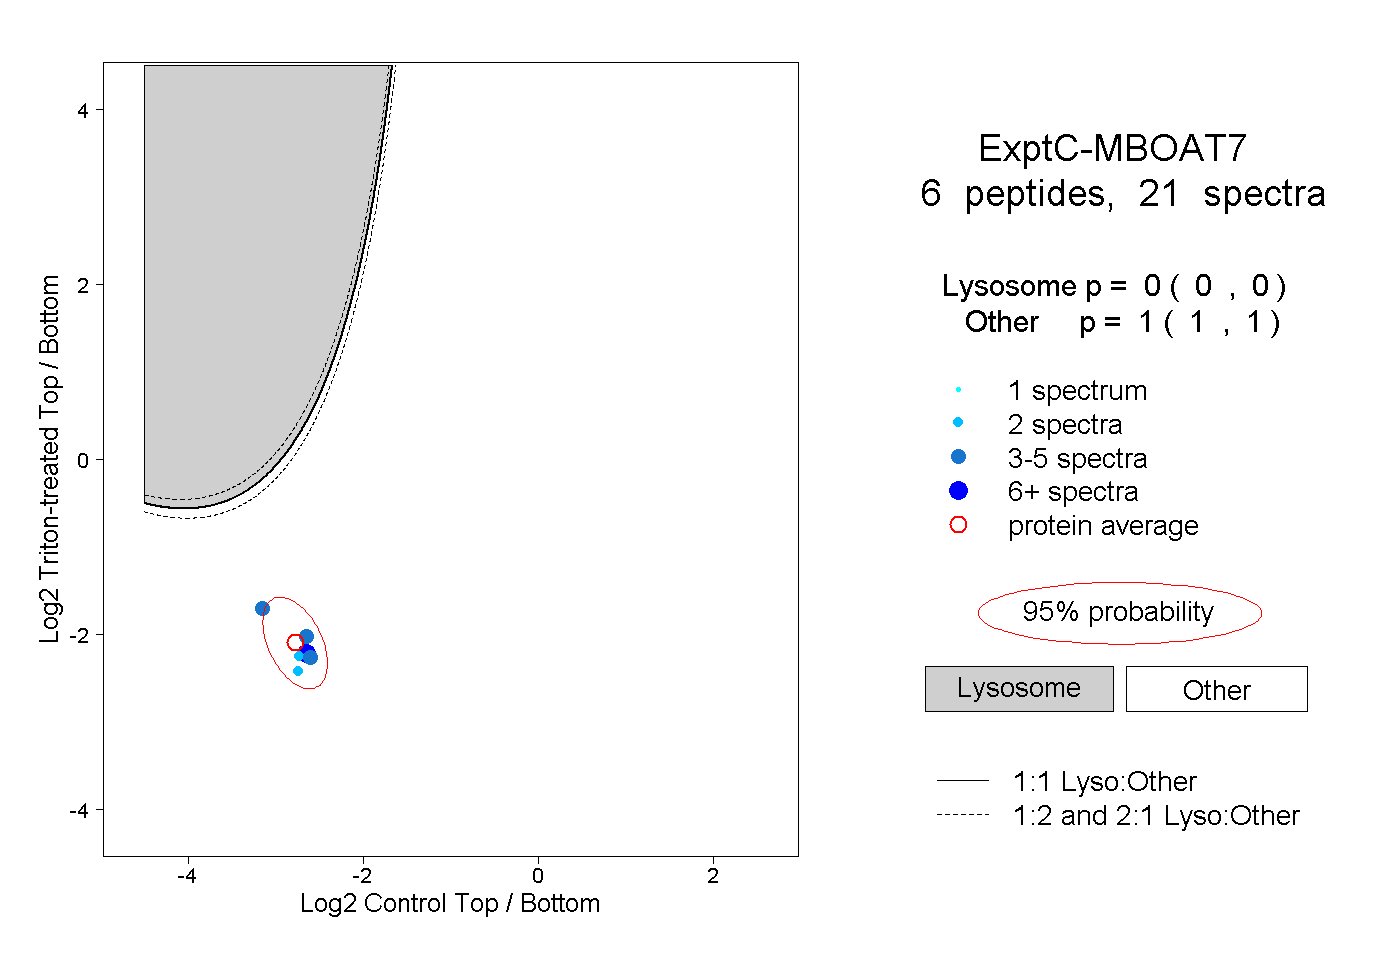 |
0.000 0.000 | 0.000 |
1.000 1.000 | 1.000 |
||||||||
| Plot | Lyso | Other | |||||||||||
| Expt D |
1 peptide |
2 spectra |
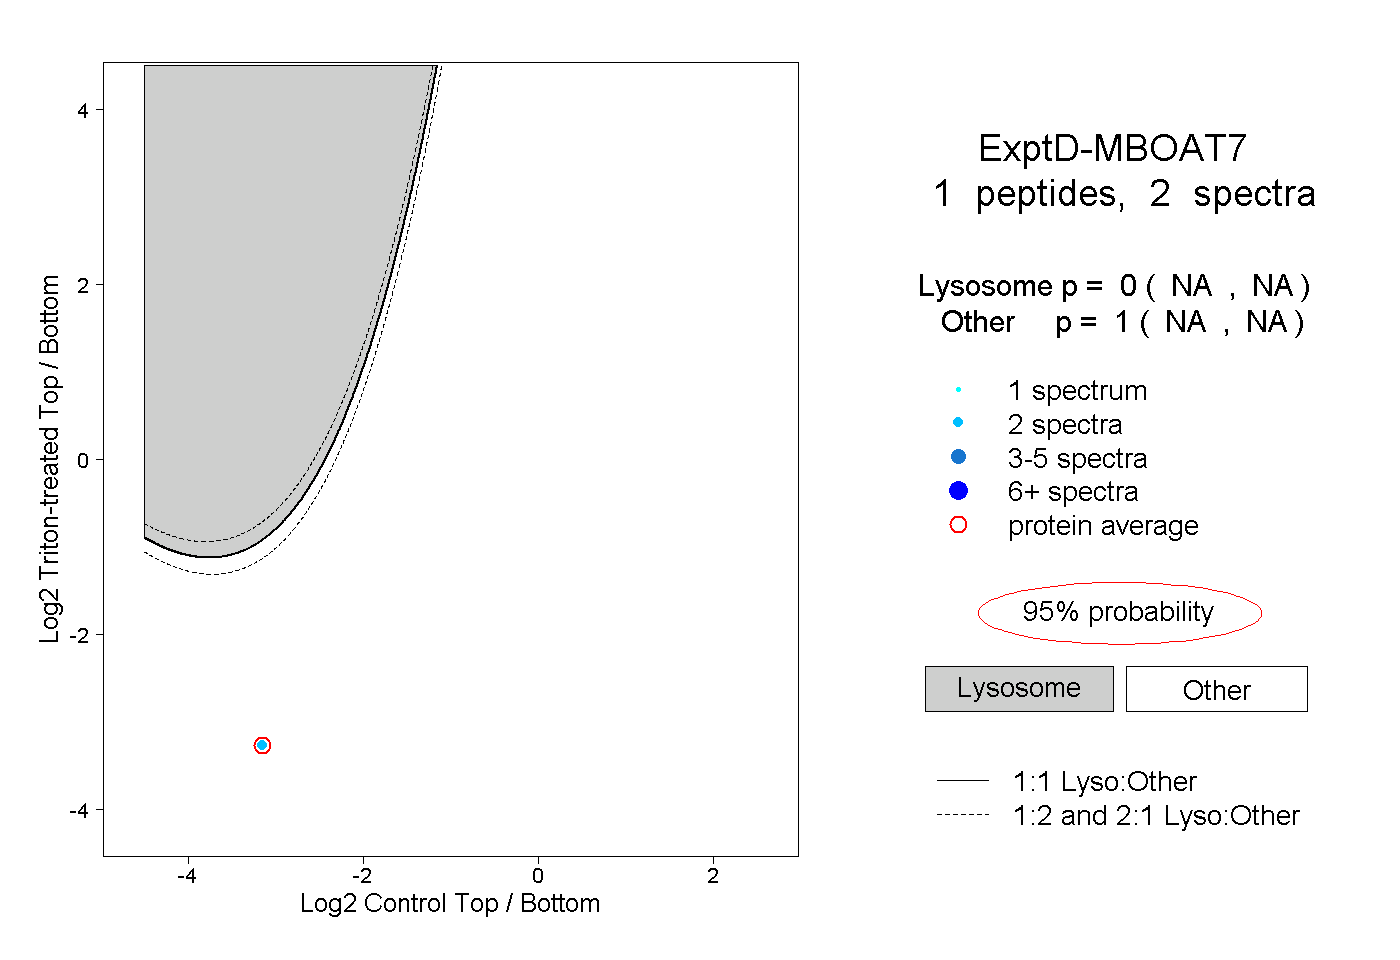 |
0.000 NA | NA |
1.000 NA | NA |