 5
5peptides
spectra
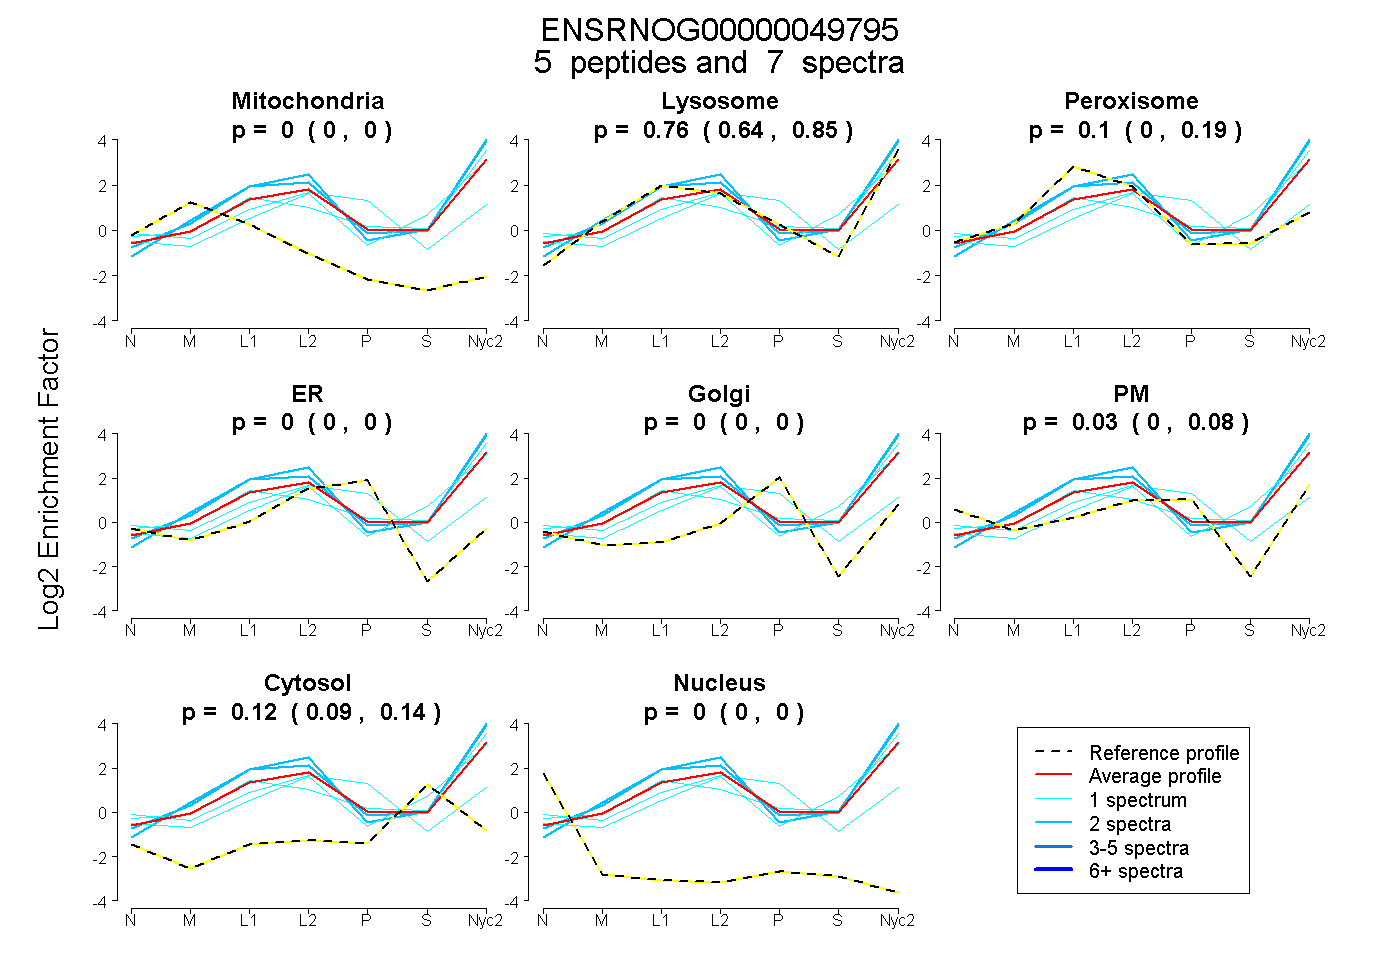
0.000 | 0.000
0.636 | 0.849
0.001 | 0.187
0.000 | 0.000
0.000 | 0.000
0.000 | 0.079
0.086 | 0.139
0.000 | 0.000
3peptides
spectra

0.000 | 0.000
1.000 | 1.000
1peptide
spectrum
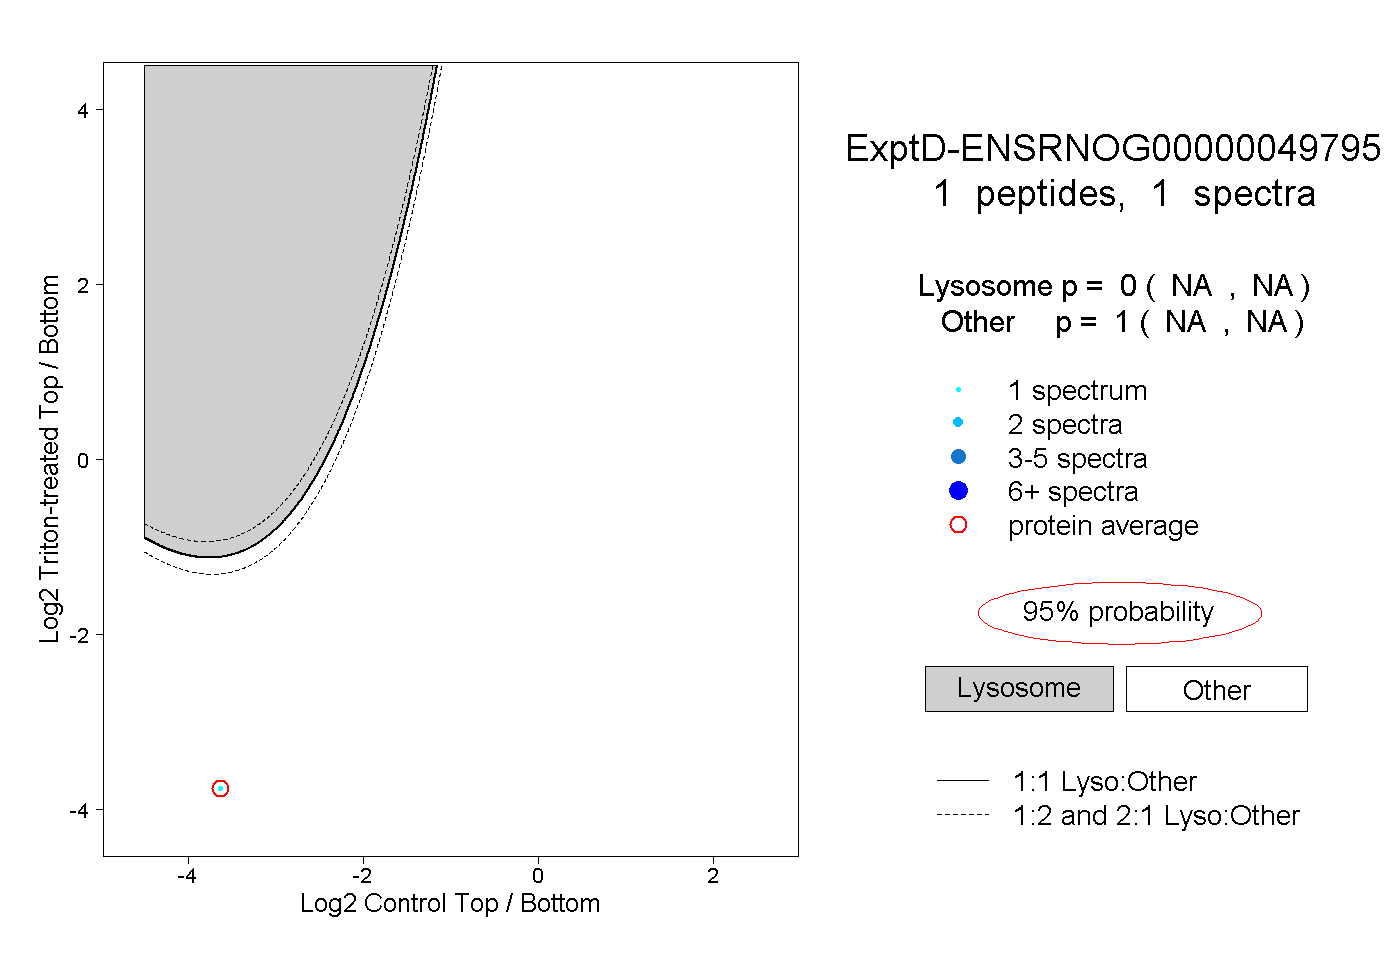
NA | NA
NA | NA