 5
5peptides
spectra
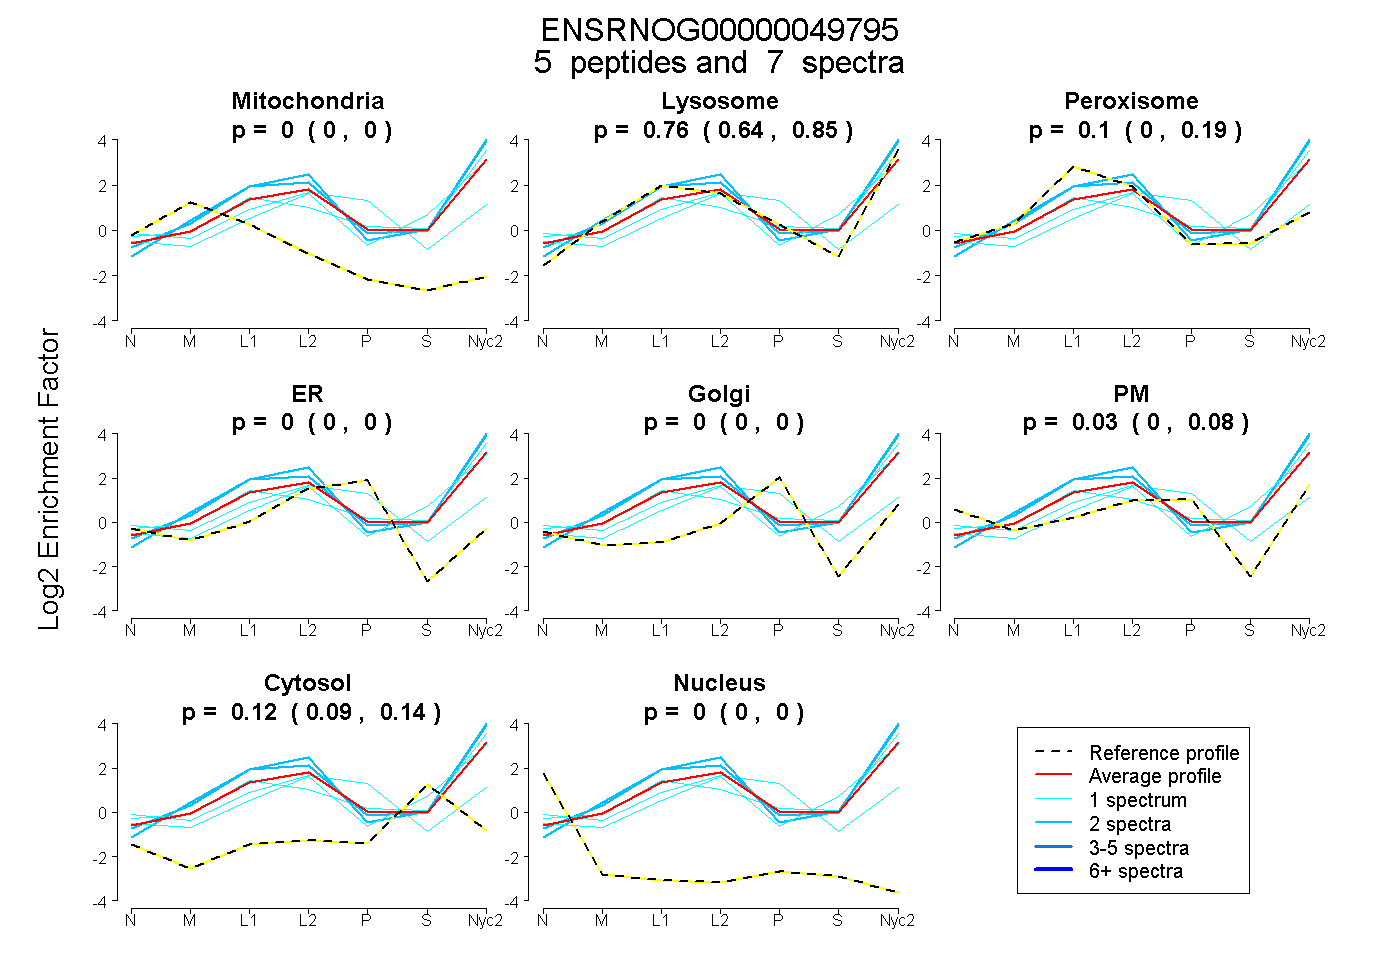
0.000 | 0.000
0.636 | 0.849
0.001 | 0.187
0.000 | 0.000
0.000 | 0.000
0.000 | 0.079
0.086 | 0.139
0.000 | 0.000
| Plot | Mito | Lyso | Perox | ER | Golgi | PM | Cytosol | Nucleus | |||||
| Expt A |
5 peptides |
7 spectra |
|
0.000 0.000 | 0.000 |
0.758 0.636 | 0.849 |
0.099 0.001 | 0.187 |
0.000 0.000 | 0.000 |
0.000 0.000 | 0.000 |
0.027 0.000 | 0.079 |
0.116 0.086 | 0.139 |
0.000 0.000 | 0.000 |
| 2 spectra, IDGDGNFQVLMSDR | 0.000 | 0.934 | 0.066 | 0.000 | 0.000 | 0.000 | 0.000 | 0.000 | ||
| 1 spectrum, GLYVEHEAGYYK | 0.000 | 0.810 | 0.000 | 0.000 | 0.000 | 0.058 | 0.131 | 0.000 | ||
| 1 spectrum, CHPLVDPEPFVALCEK | 0.000 | 0.191 | 0.225 | 0.355 | 0.000 | 0.175 | 0.054 | 0.000 | ||
| 1 spectrum, TASVFAR | 0.000 | 0.710 | 0.000 | 0.000 | 0.000 | 0.000 | 0.290 | 0.000 | ||
| 2 spectra, ECVSPCTR | 0.000 | 0.920 | 0.080 | 0.000 | 0.000 | 0.000 | 0.000 | 0.000 |
| Plot | Lyso | Other | |||||||||||
| Expt C |
3 peptides |
10 spectra |
 |
0.000 0.000 | 0.000 |
1.000 1.000 | 1.000 |
||||||||
| Plot | Lyso | Other | |||||||||||
| Expt D |
1 peptide |
1 spectrum |
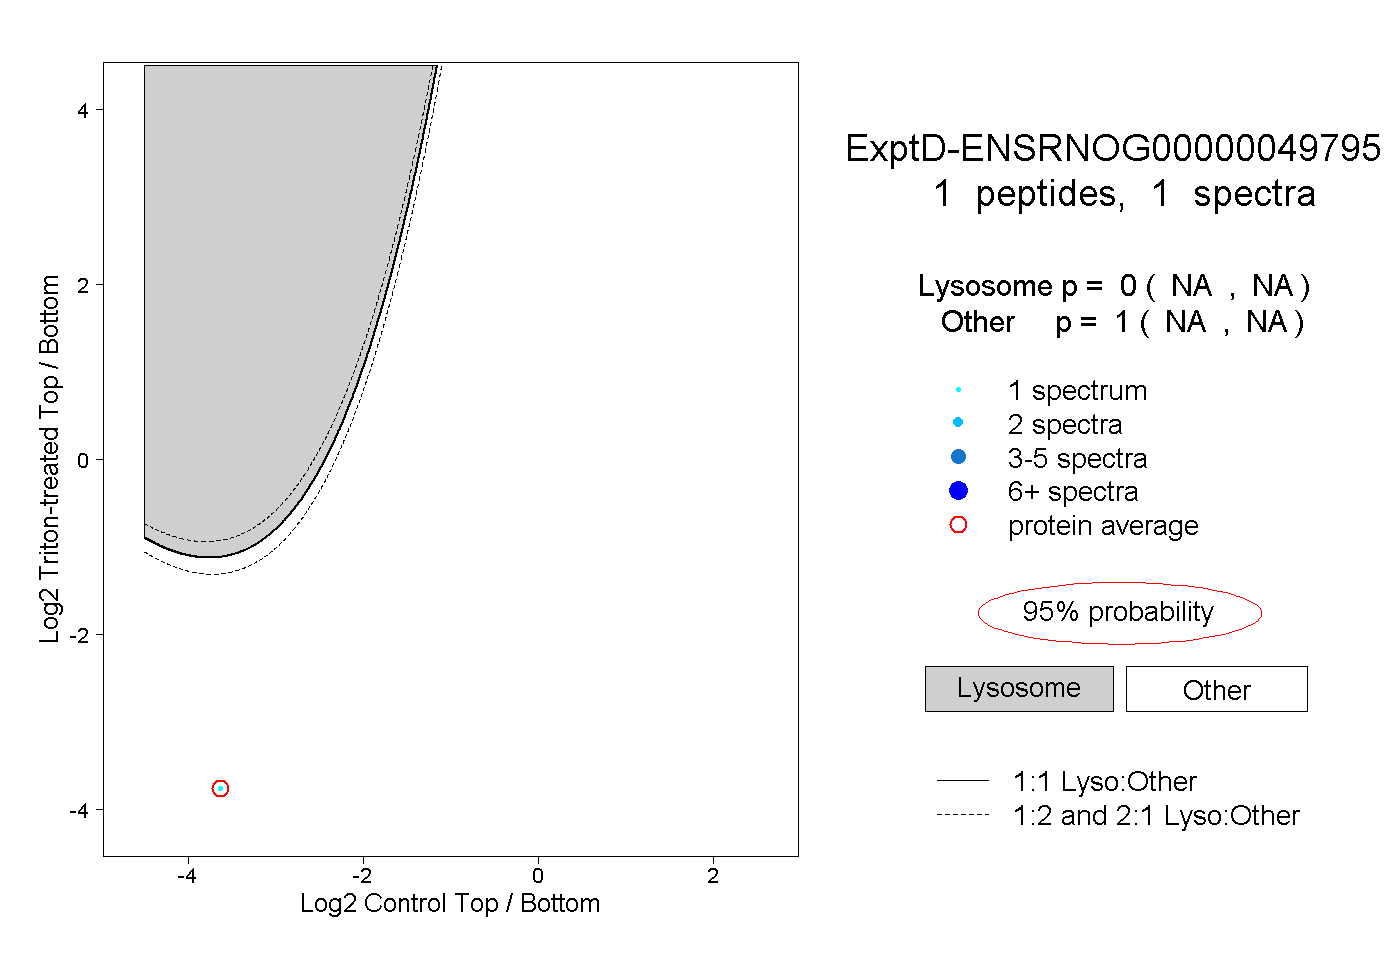 |
0.000 NA | NA |
1.000 NA | NA |