 6
6peptides
spectra
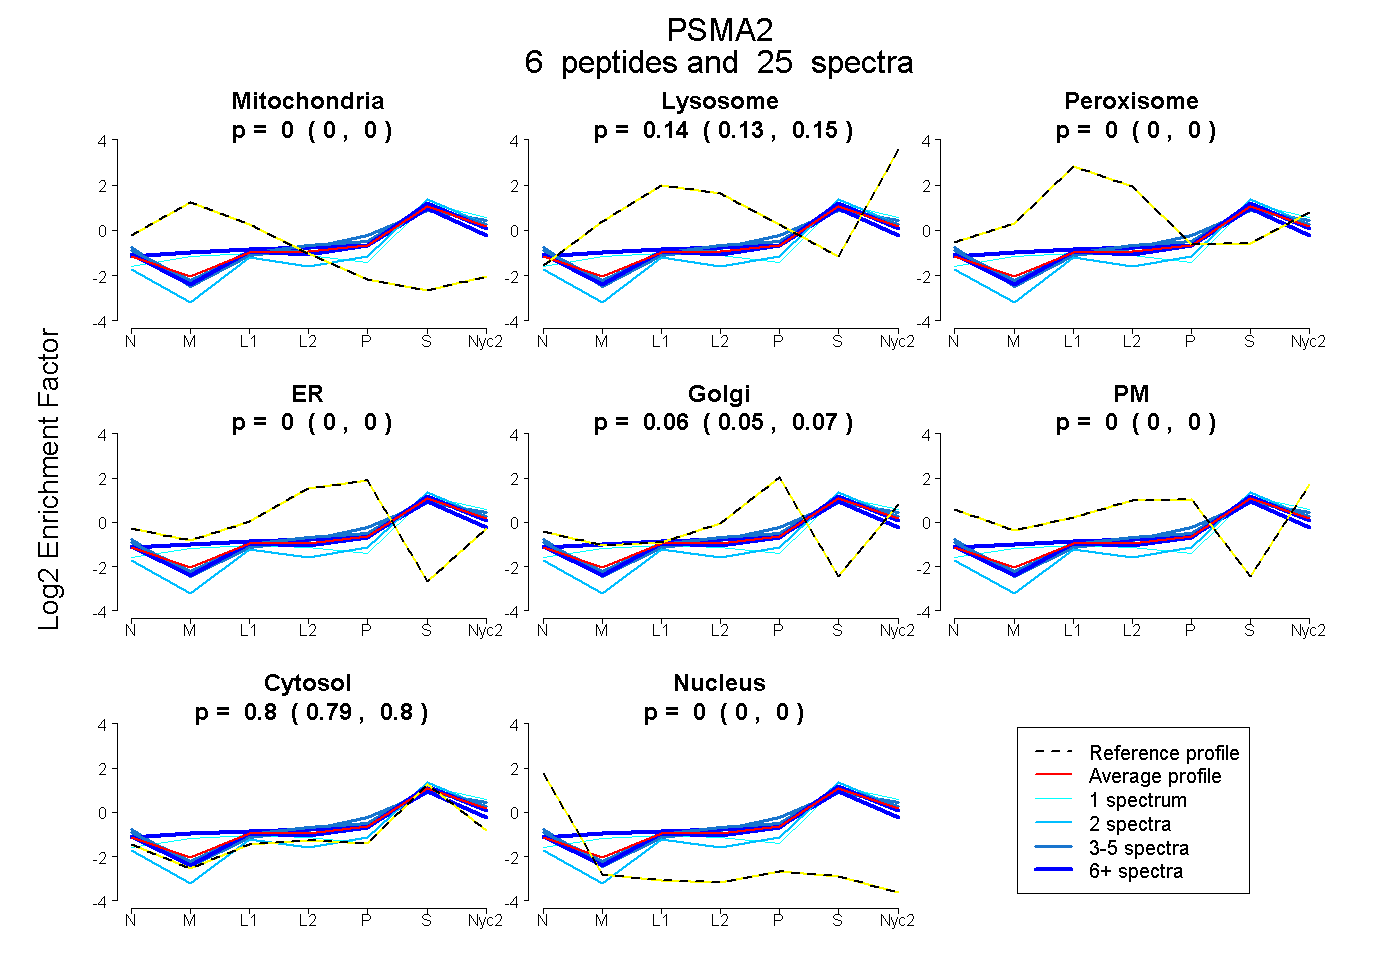
0.000 | 0.000
0.134 | 0.153
0.000 | 0.000
0.000 | 0.000
0.050 | 0.066
0.000 | 0.001
0.787 | 0.804
0.000 | 0.000
3peptides
spectra
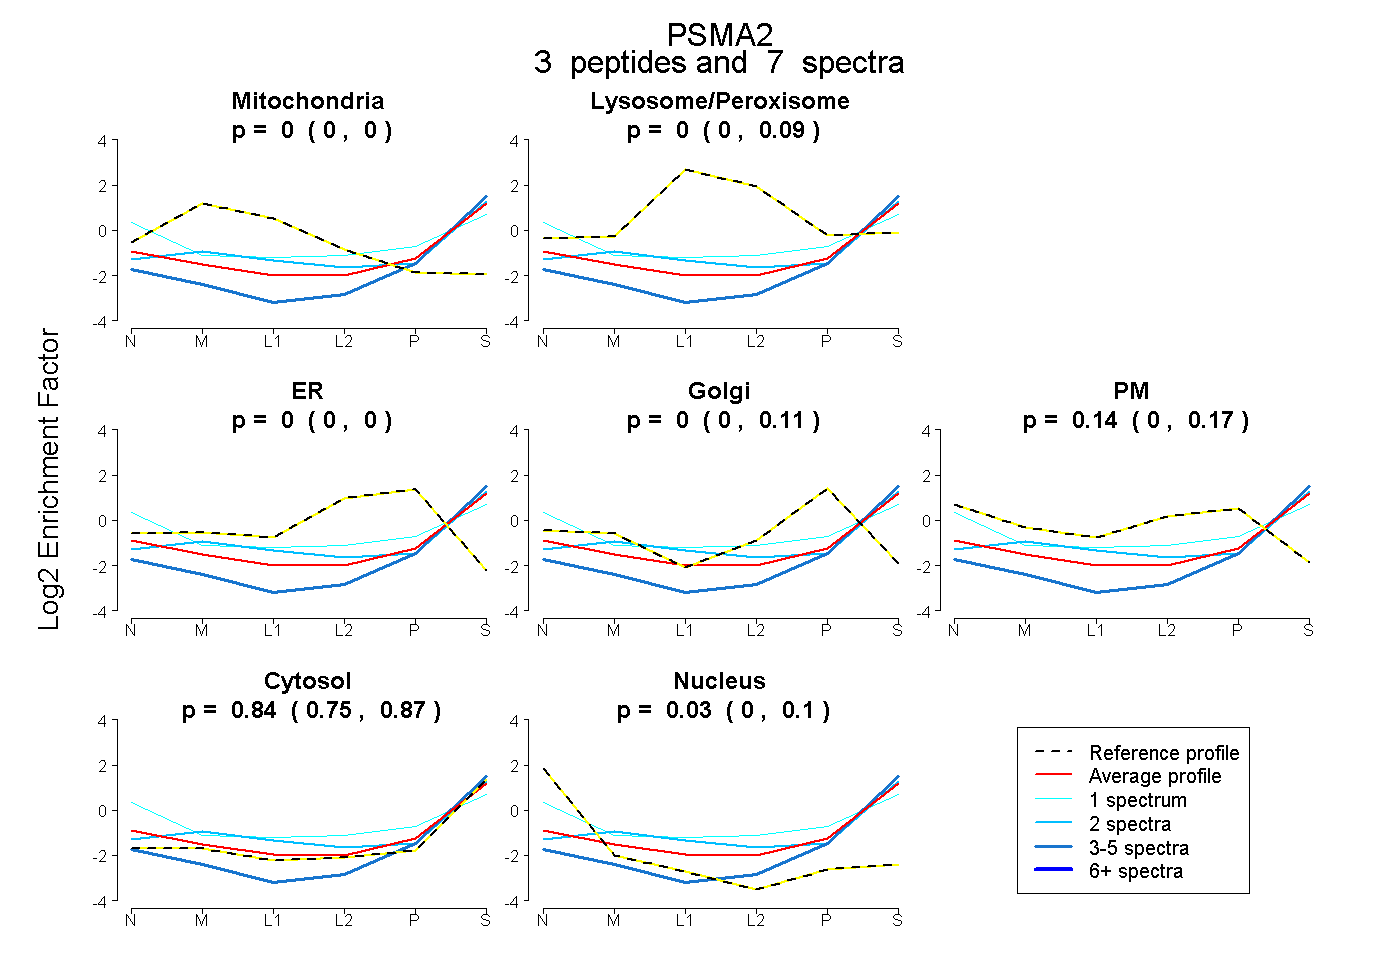
0.000 | 0.000
0.000 | 0.095
0.000 | 0.000
0.000 | 0.113
0.000 | 0.168
0.748 | 0.873
0.000 | 0.103
7peptides
spectra
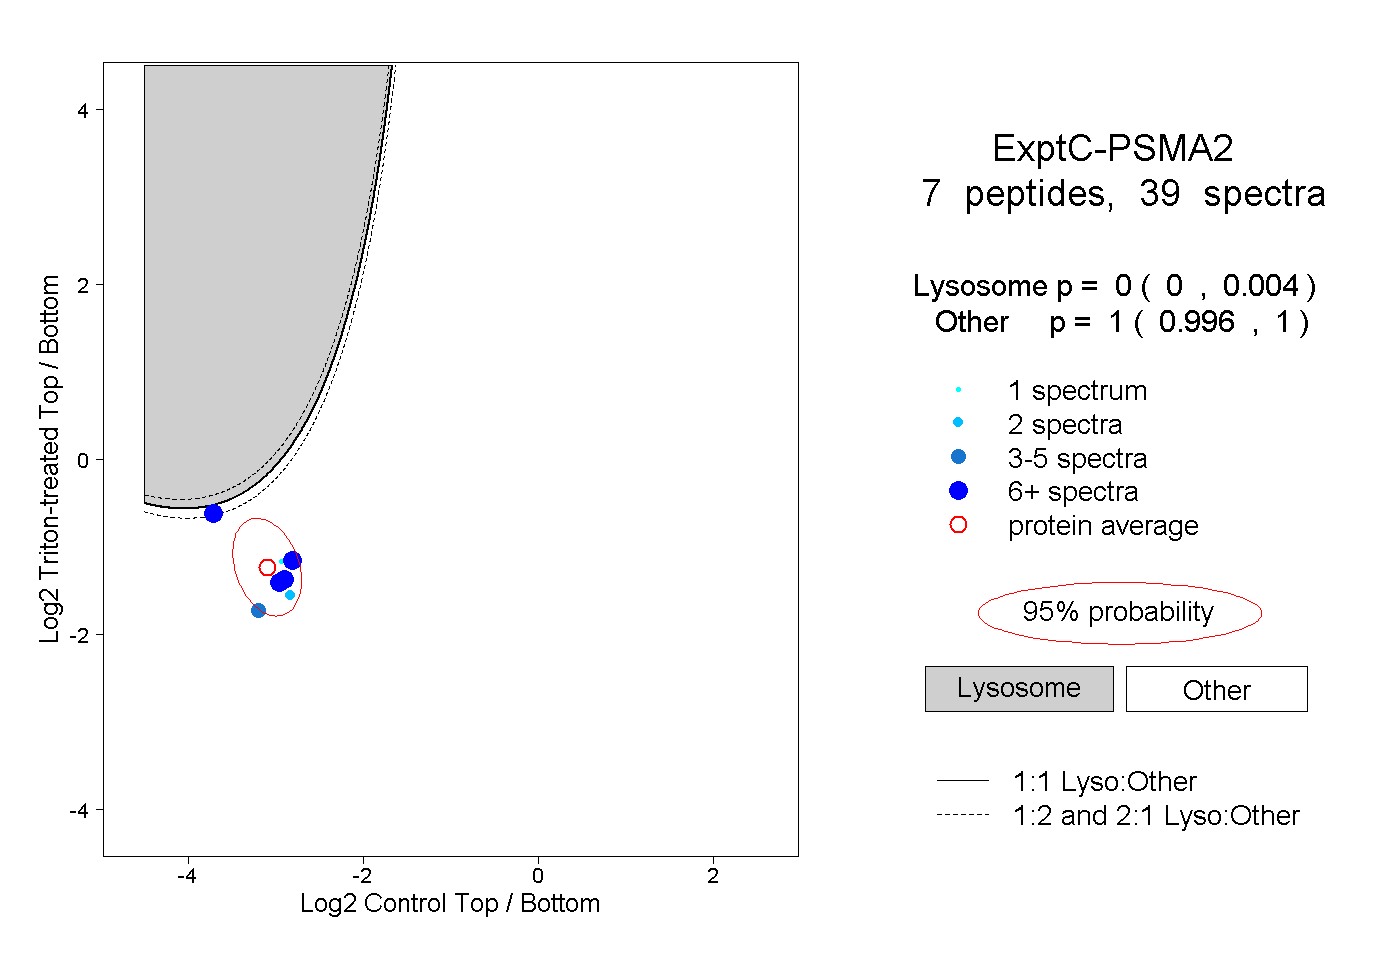
0.000 | 0.004
0.996 | 1.000
1peptide
spectrum
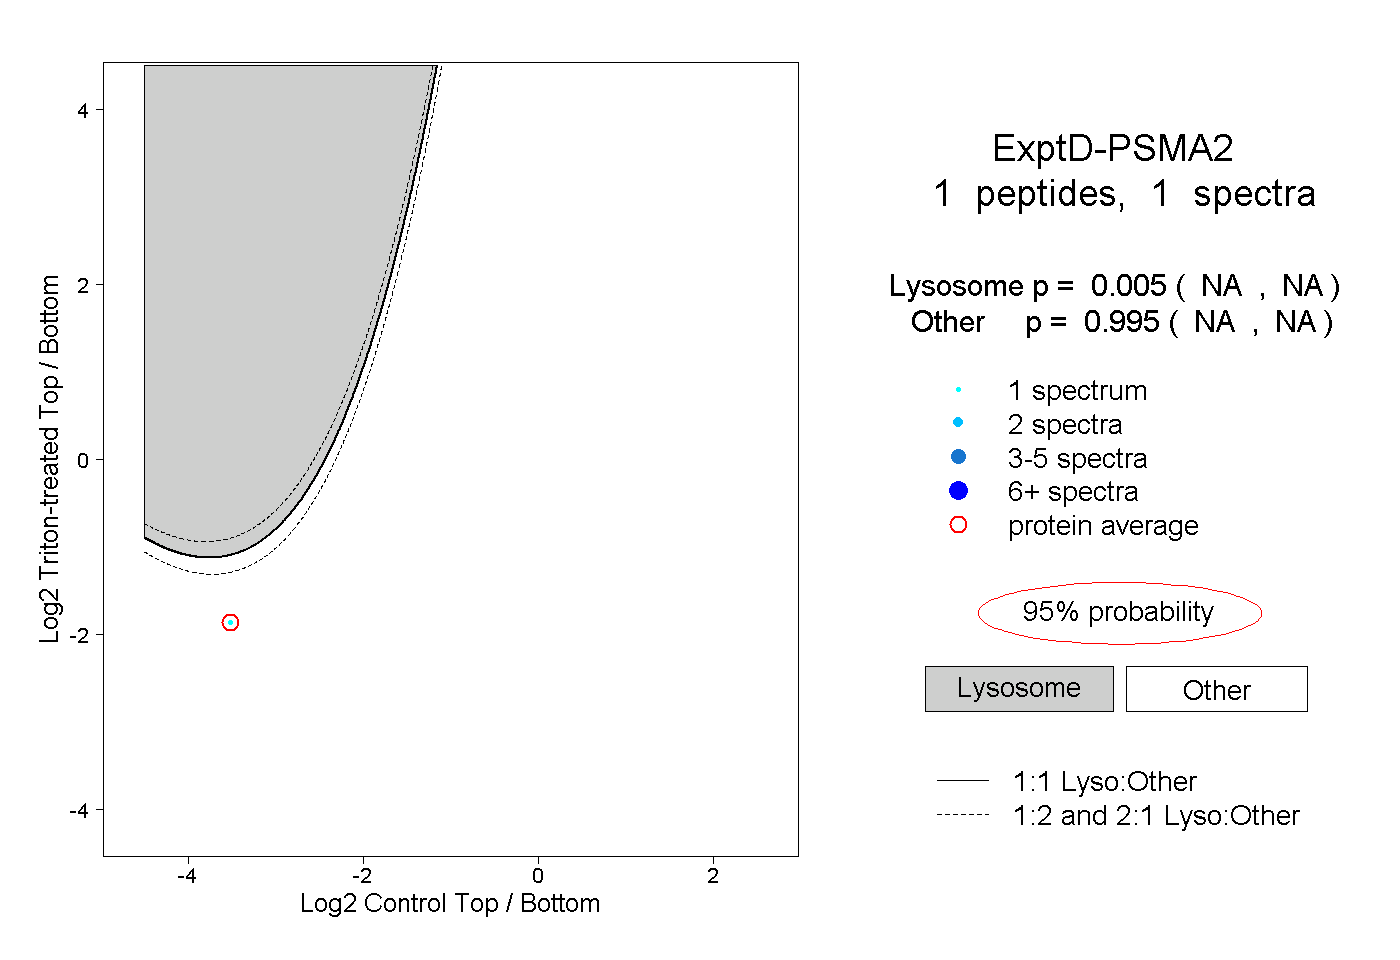
NA | NA
NA | NA