 6
6peptides
spectra
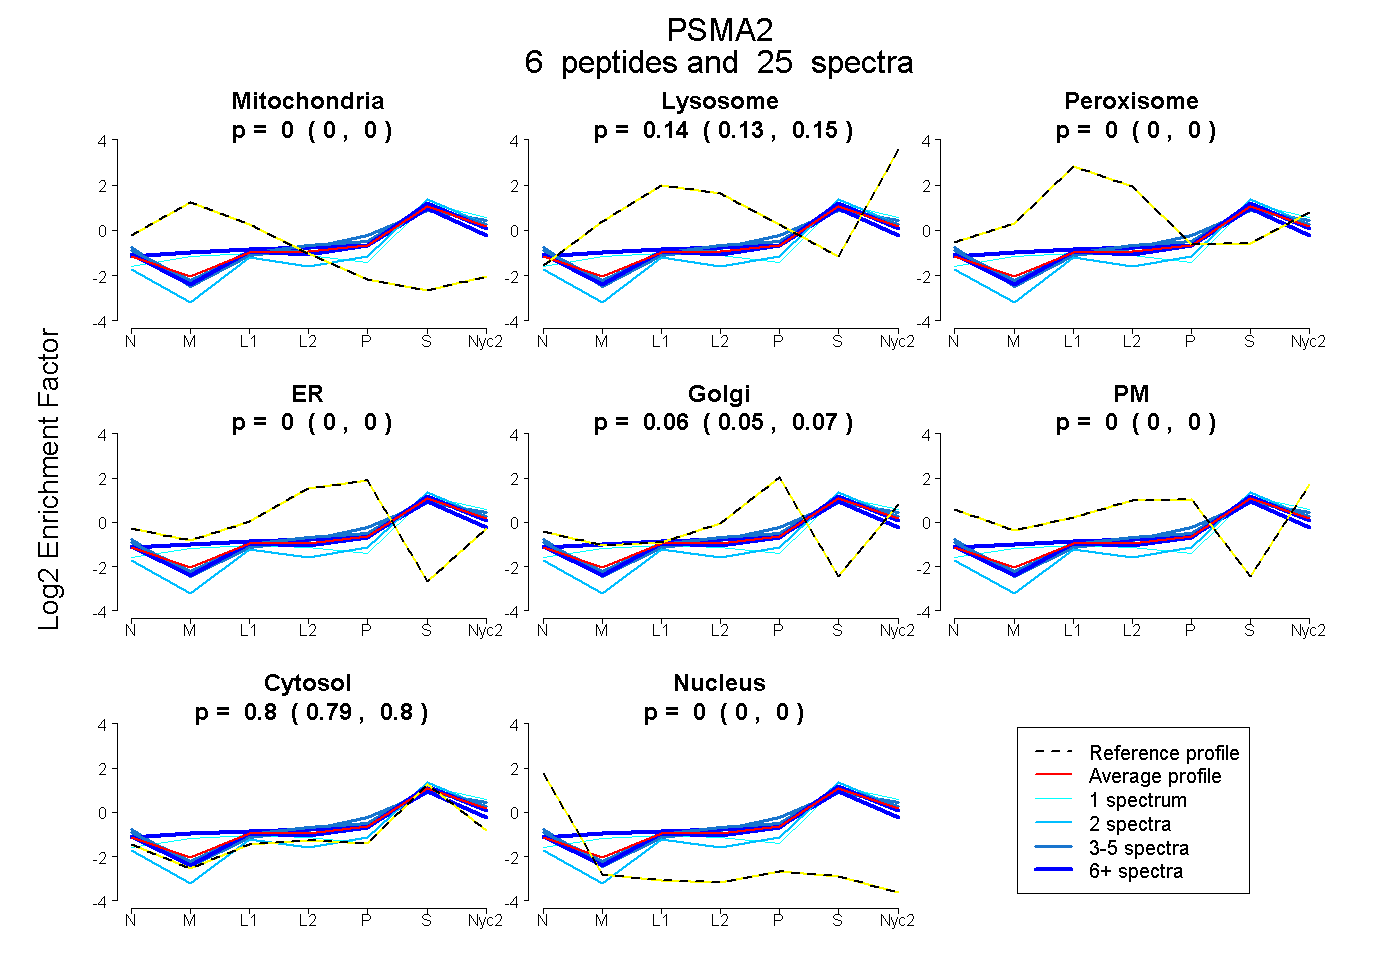
0.000 | 0.000
0.134 | 0.153
0.000 | 0.000
0.000 | 0.000
0.050 | 0.066
0.000 | 0.001
0.787 | 0.804
0.000 | 0.000
| Plot | Mito | Lyso | Perox | ER | Golgi | PM | Cytosol | Nucleus | |||||
| Expt A |
6 peptides |
25 spectra |
|
0.000 0.000 | 0.000 |
0.144 0.134 | 0.153 |
0.000 0.000 | 0.000 |
0.000 0.000 | 0.000 |
0.059 0.050 | 0.066 |
0.000 0.000 | 0.001 |
0.796 0.787 | 0.804 |
0.000 0.000 | 0.000 |
| 3 spectra, NYVNGK | 0.000 | 0.104 | 0.000 | 0.000 | 0.015 | 0.101 | 0.779 | 0.000 | ||
| 2 spectra, LTPTEVR | 0.000 | 0.051 | 0.000 | 0.000 | 0.000 | 0.000 | 0.949 | 0.000 | ||
| 9 spectra, HIGLVYSGMGPDYR | 0.072 | 0.130 | 0.046 | 0.000 | 0.053 | 0.000 | 0.699 | 0.000 | ||
| 1 spectrum, AANGVVLATEK | 0.000 | 0.215 | 0.000 | 0.000 | 0.000 | 0.000 | 0.785 | 0.000 | ||
| 7 spectra, SILYDER | 0.000 | 0.113 | 0.000 | 0.000 | 0.055 | 0.000 | 0.832 | 0.000 | ||
| 3 spectra, ATAMGK | 0.000 | 0.074 | 0.000 | 0.000 | 0.142 | 0.055 | 0.729 | 0.000 |
| Plot | Mito | Lyso or Perox | ER | Golgi | PM | Cytosol | Nucleus | ||||||
| Expt B |
3 peptides |
7 spectra |
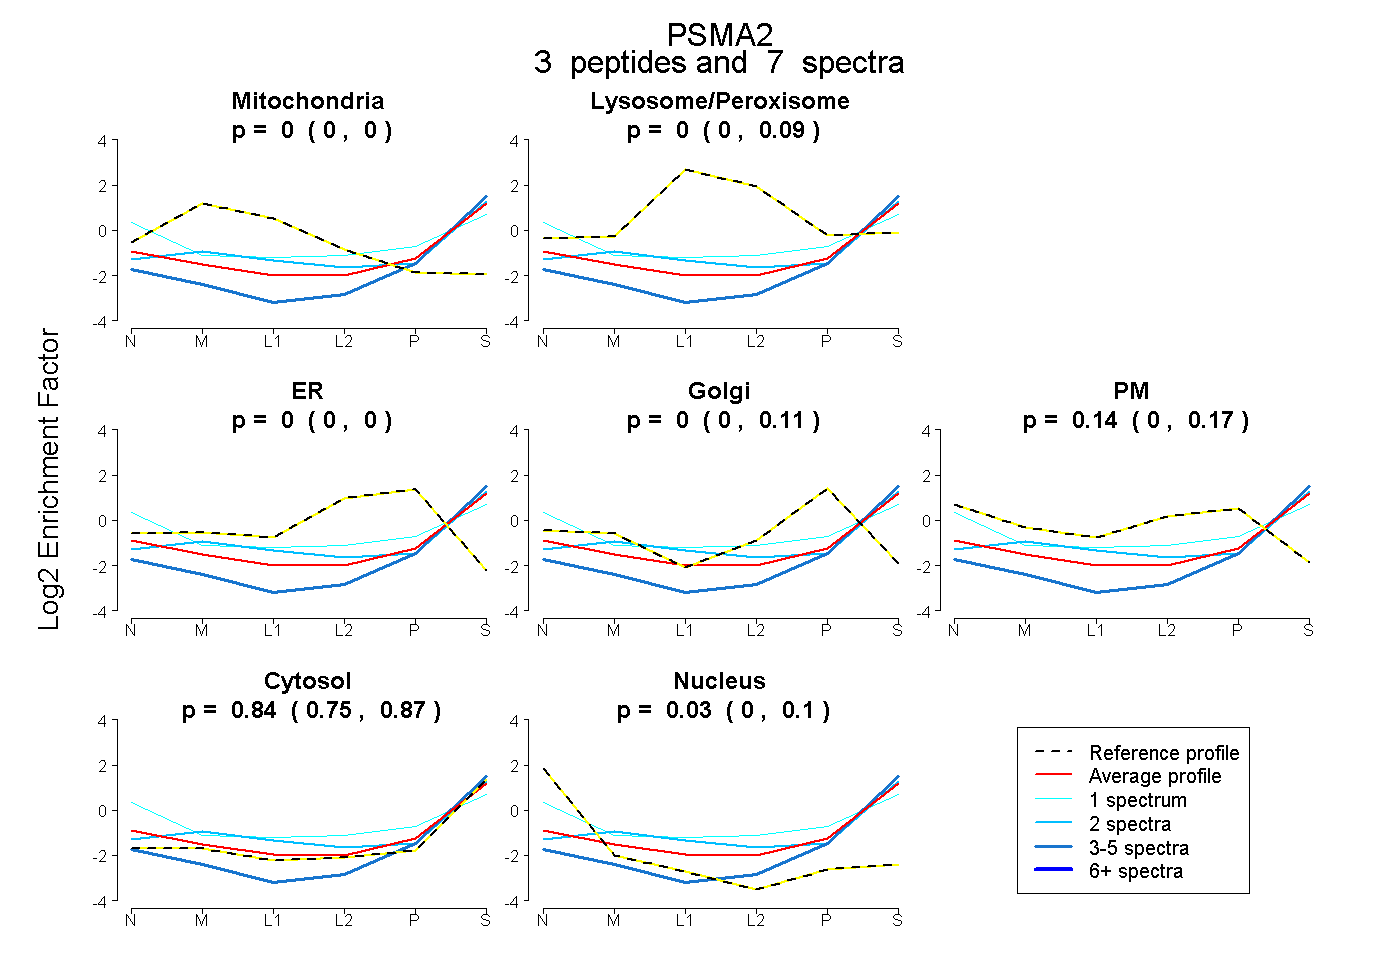 |
0.000 0.000 | 0.000 |
0.000 0.000 | 0.095 |
0.000 0.000 | 0.000 |
0.000 0.000 | 0.113 |
0.138 0.000 | 0.168 |
0.835 0.748 | 0.873 |
0.027 0.000 | 0.103 |
|||
| Plot | Lyso | Other | |||||||||||
| Expt C |
7 peptides |
39 spectra |
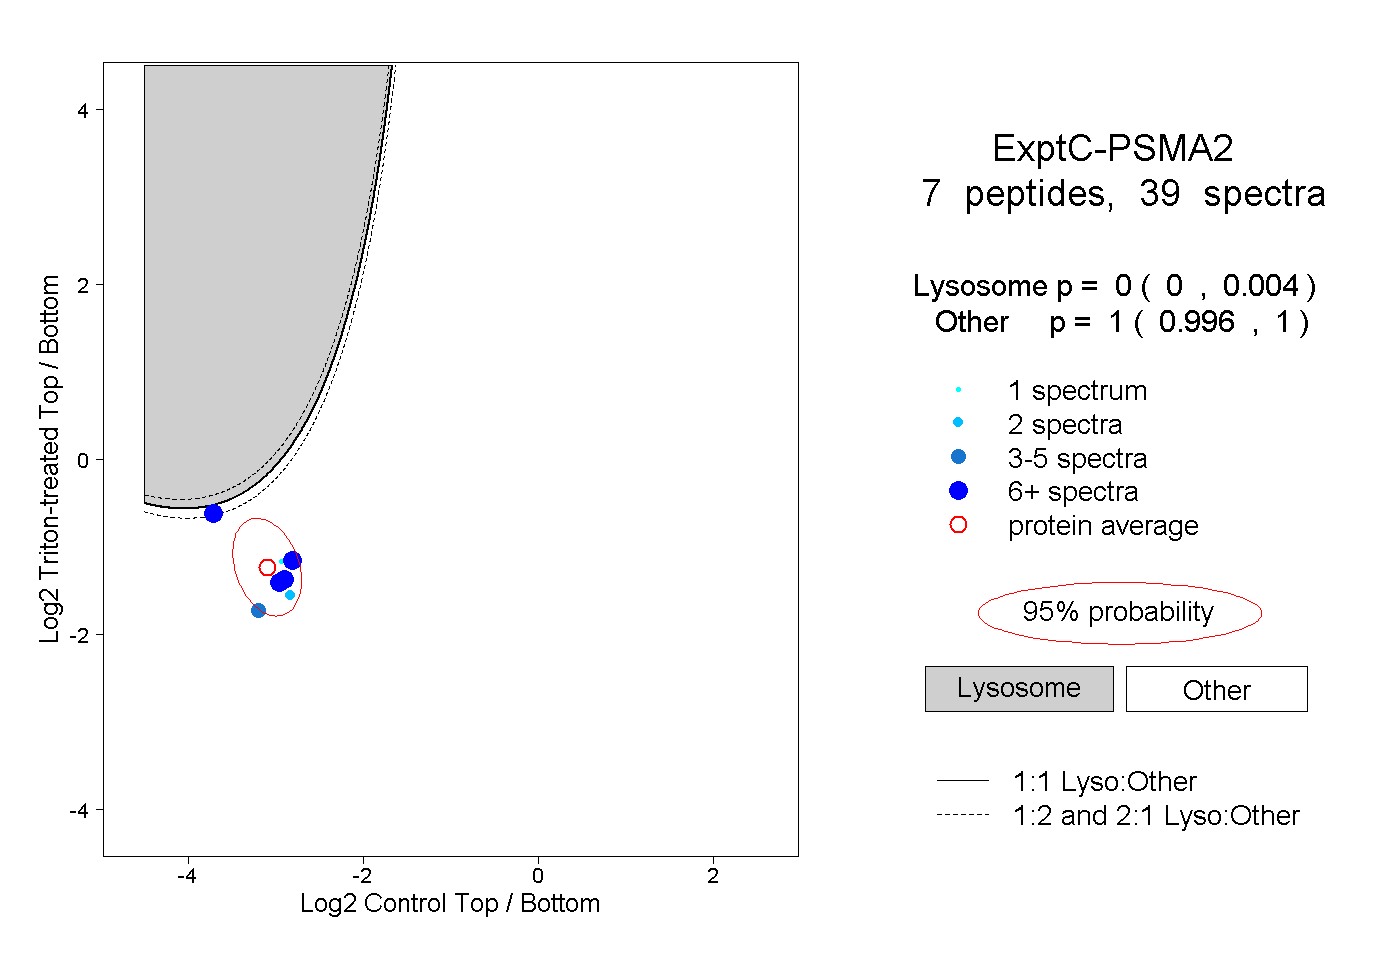 |
0.000 0.000 | 0.004 |
1.000 0.996 | 1.000 |
||||||||
| Plot | Lyso | Other | |||||||||||
| Expt D |
1 peptide |
1 spectrum |
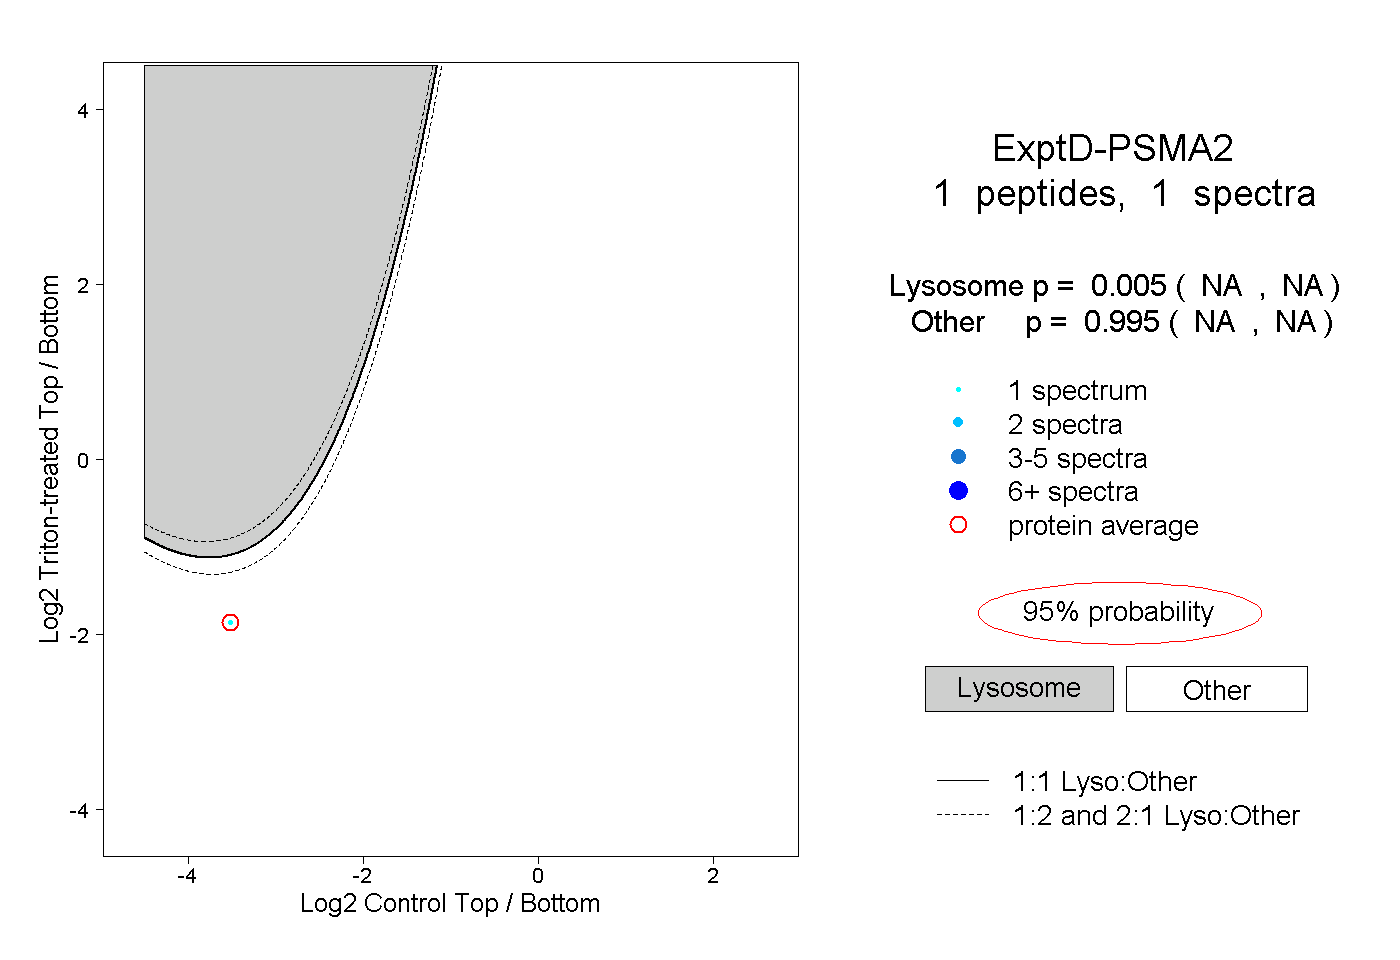 |
0.005 NA | NA |
0.995 NA | NA |