 6
6peptides
spectra
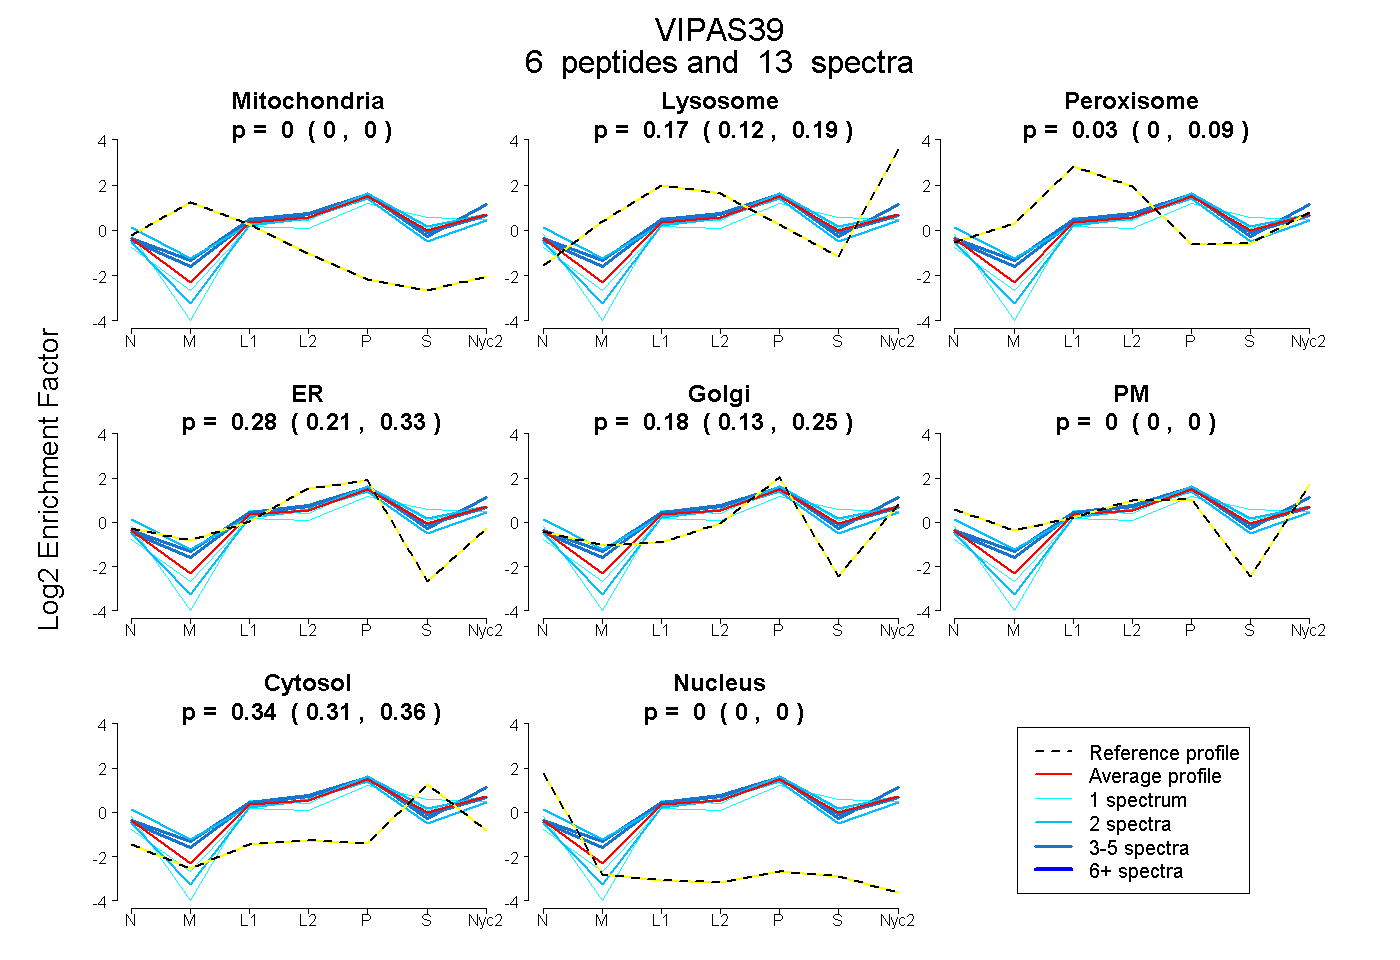
0.000 | 0.000
0.125 | 0.188
0.000 | 0.085
0.206 | 0.328
0.128 | 0.249
0.000 | 0.000
0.307 | 0.358
0.000 | 0.000
3peptides
spectra
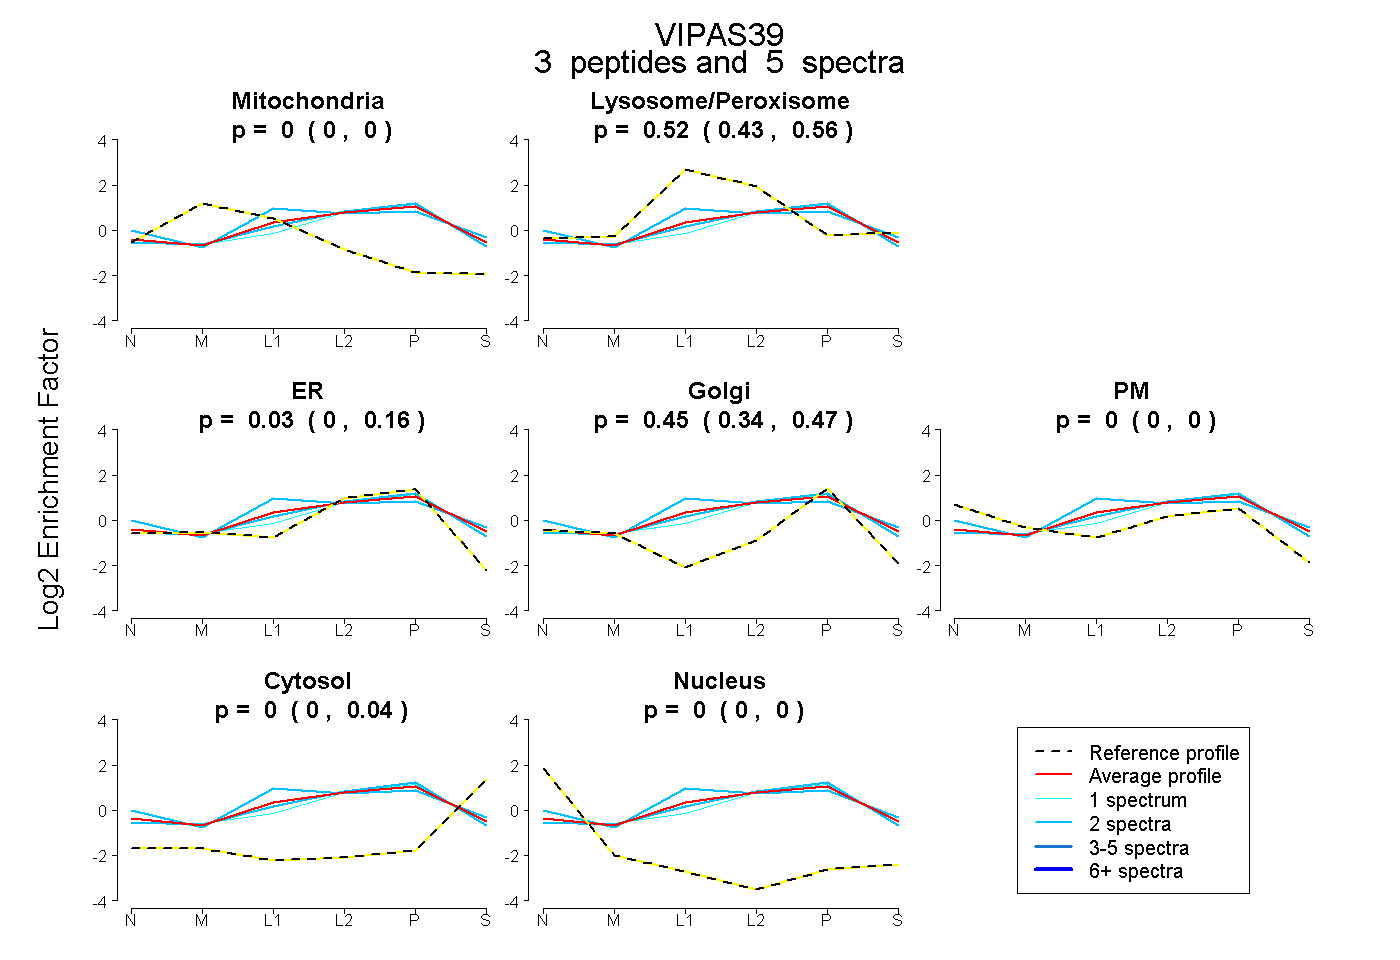
0.000 | 0.000
0.433 | 0.555
0.000 | 0.156
0.339 | 0.465
0.000 | 0.000
0.000 | 0.042
0.000 | 0.000
11peptides
spectra
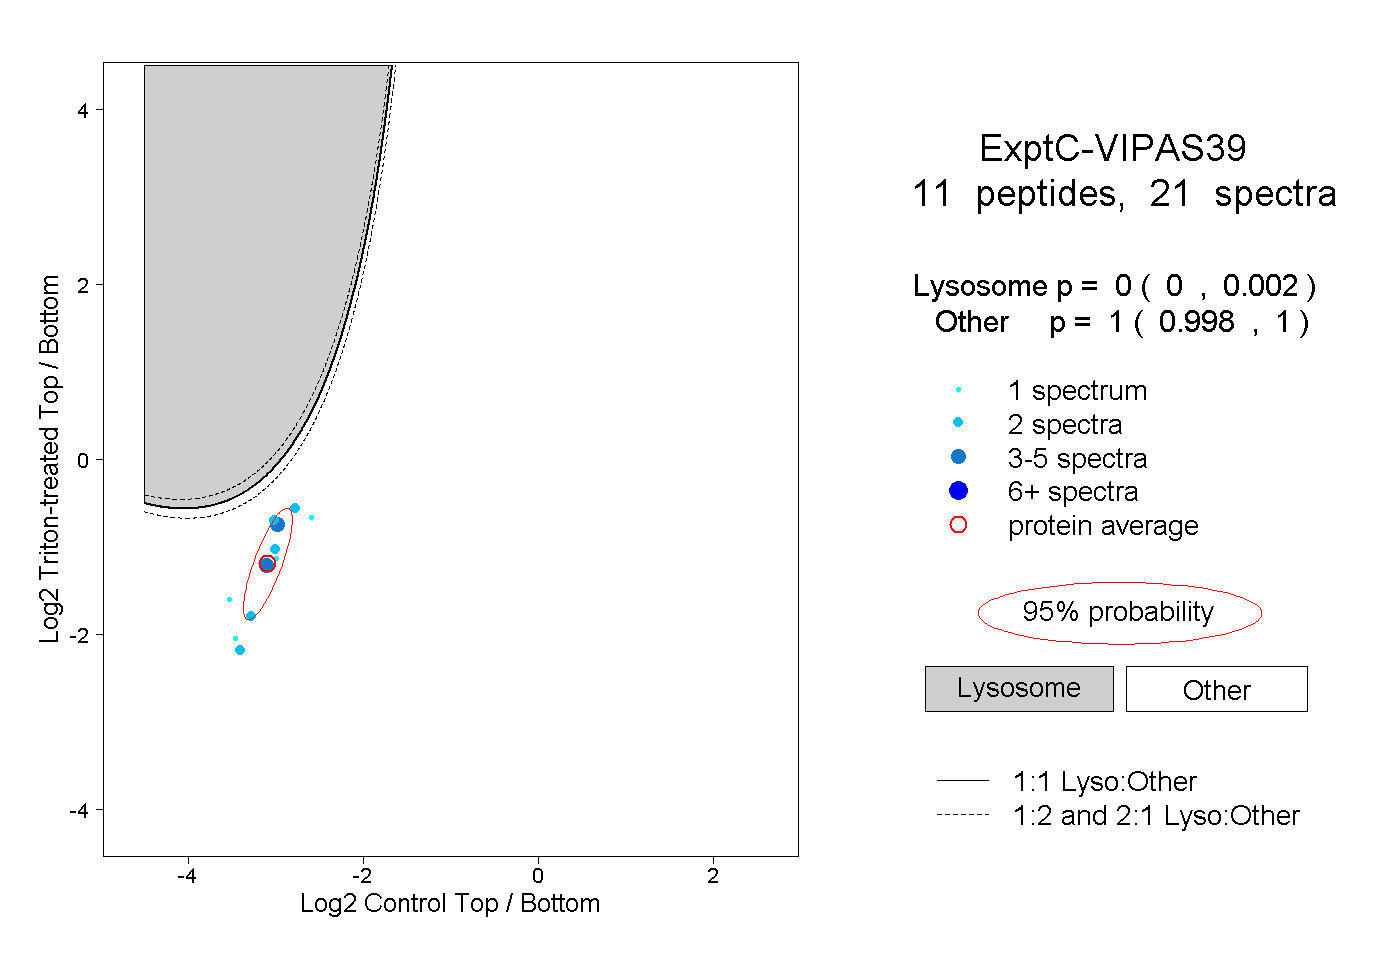
0.000 | 0.002
0.998 | 1.000
1peptide
spectrum
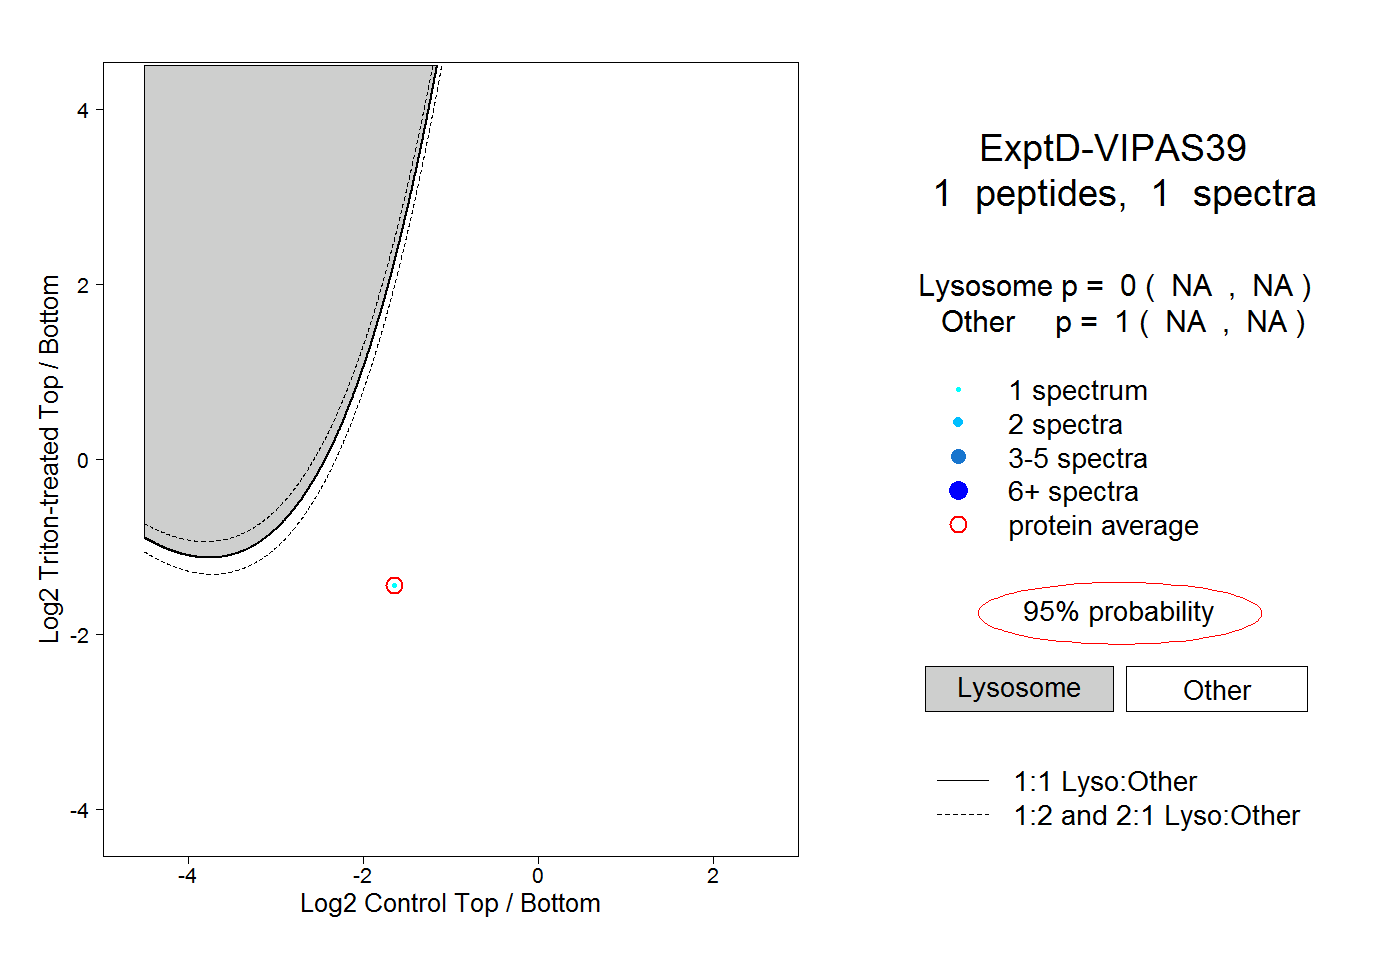
NA | NA
NA | NA