VIPAS39
[ENSRNOP00000066883]
Main page
| | | Plot |
Mito |
Lyso |
|
Perox |
ER |
Golgi |
PM |
Cytosol |
Nucleus |
|
| Expt A |
 6
6
peptides |
13
spectra |
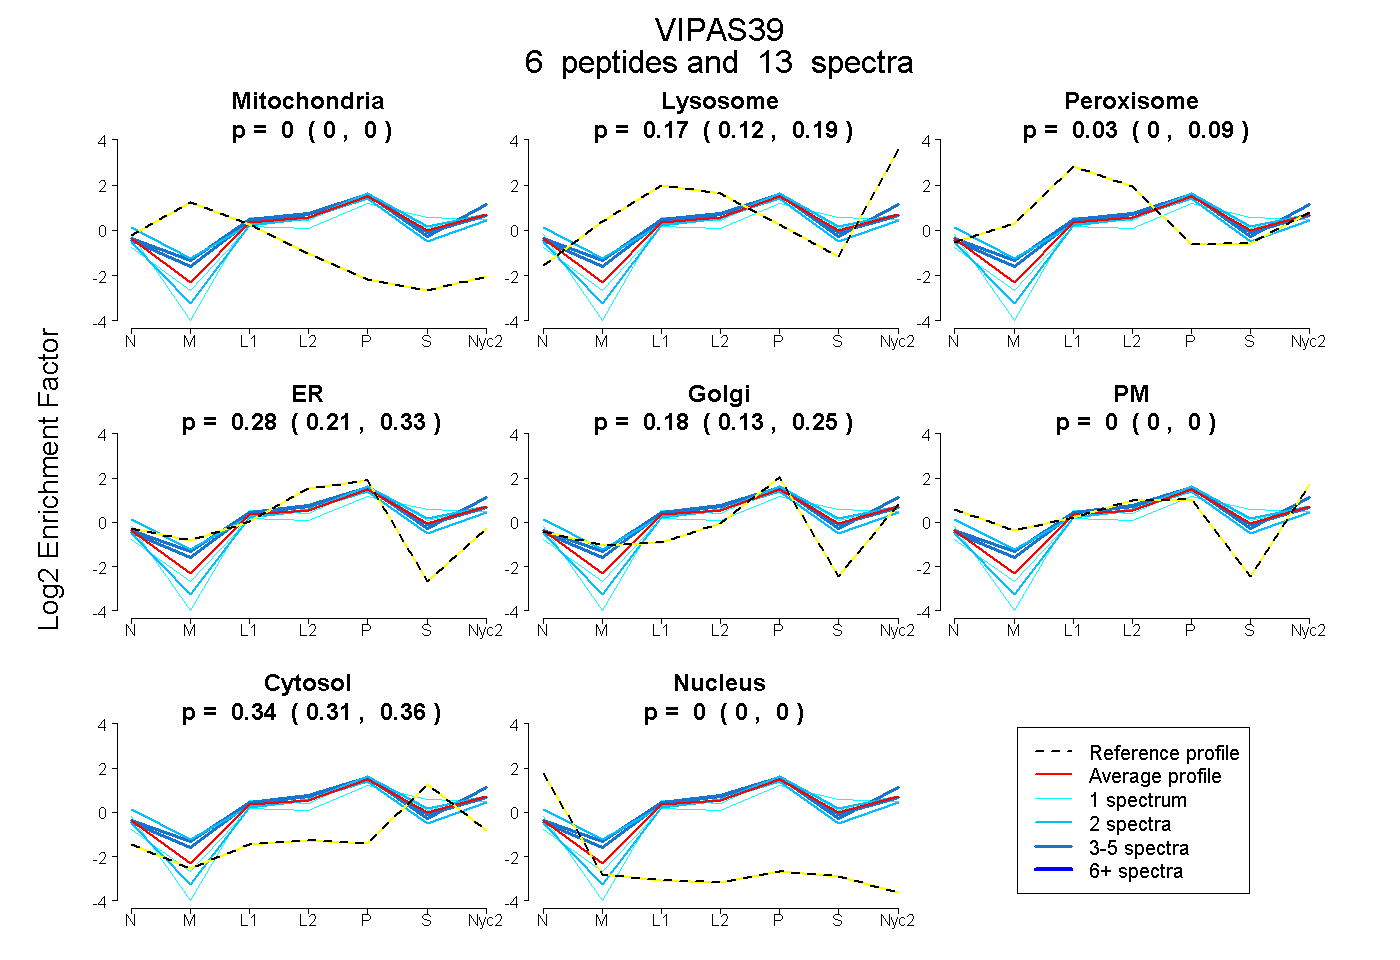 |
0.000
0.000 | 0.000 |
0.166
0.125 | 0.188 |
|
0.032
0.000 | 0.085 |
0.283
0.206 | 0.328 |
0.183
0.128 | 0.249 |
0.000
0.000 | 0.000 |
0.336
0.307 | 0.358 |
0.000
0.000 | 0.000 |
|
| | | Plot |
Mito |
|
Lyso or Perox |
|
ER |
Golgi |
PM |
Cytosol |
Nucleus |
|
| Expt B |
3
peptides |
5
spectra |
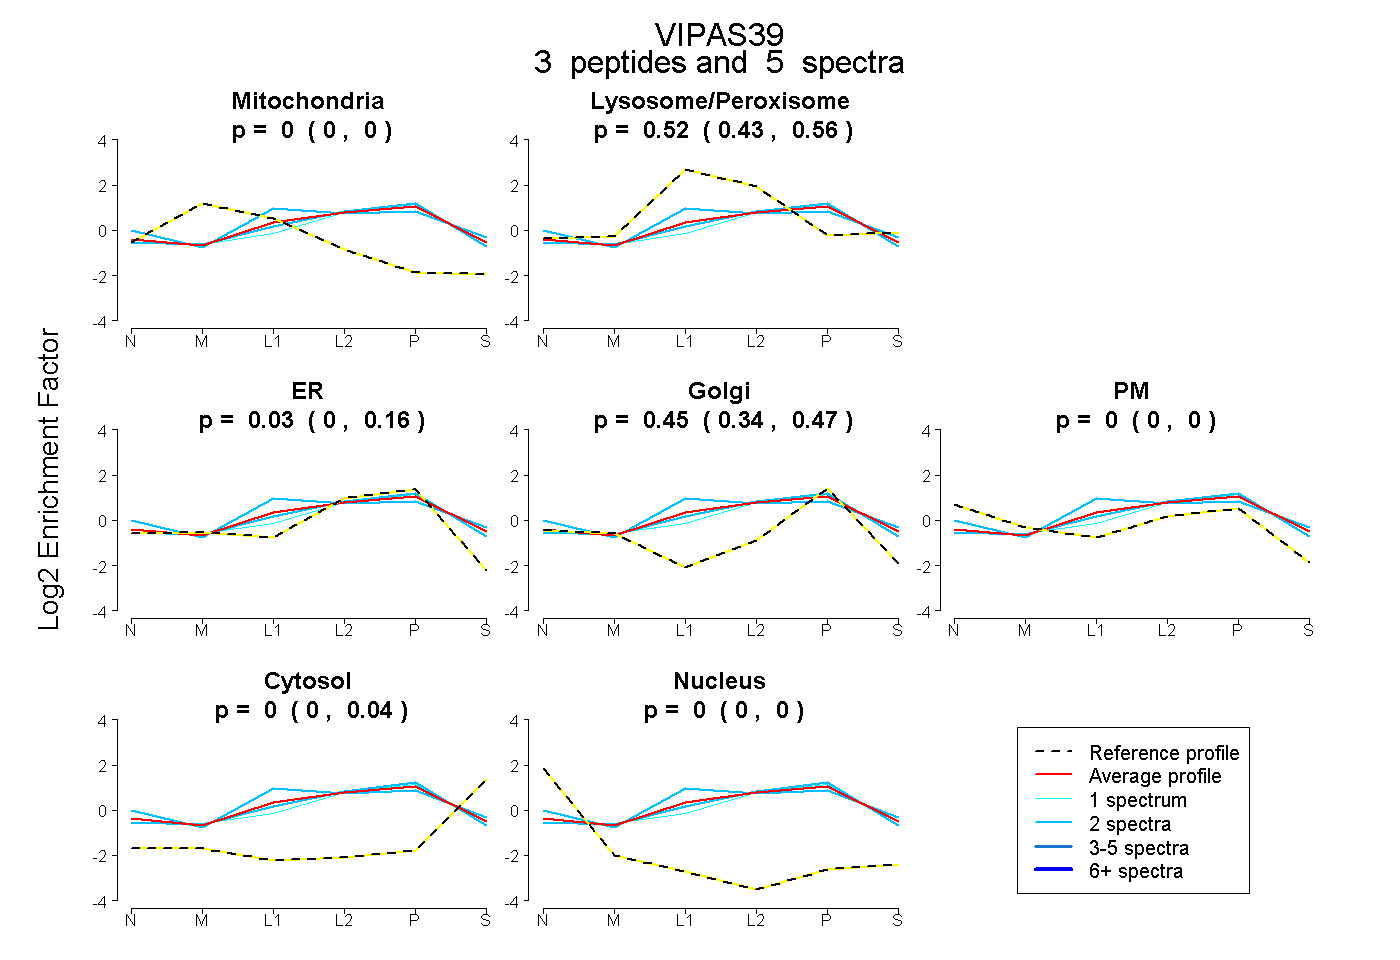 |
0.000
0.000 | 0.000 |
|
0.516
0.433 | 0.555 |
|
0.029
0.000 | 0.156 |
0.453
0.339 | 0.465 |
0.000
0.000 | 0.000 |
0.001
0.000 | 0.042 |
0.000
0.000 | 0.000 |
|
| 2 spectra, QYVLTALAAR |
0.000 |
|
0.624 |
|
0.000 |
0.371 |
0.000 |
0.005 |
0.000 |
|
| 2 spectra, LLLDLFR |
0.000 |
|
0.430 |
|
0.201 |
0.360 |
0.000 |
0.010 |
0.000 |
|
| 1 spectrum, HLIHFLK |
0.000 |
|
0.354 |
|
0.289 |
0.283 |
0.000 |
0.073 |
0.000 |
|
| | | Plot |
|
Lyso |
|
|
|
|
|
|
|
Other |
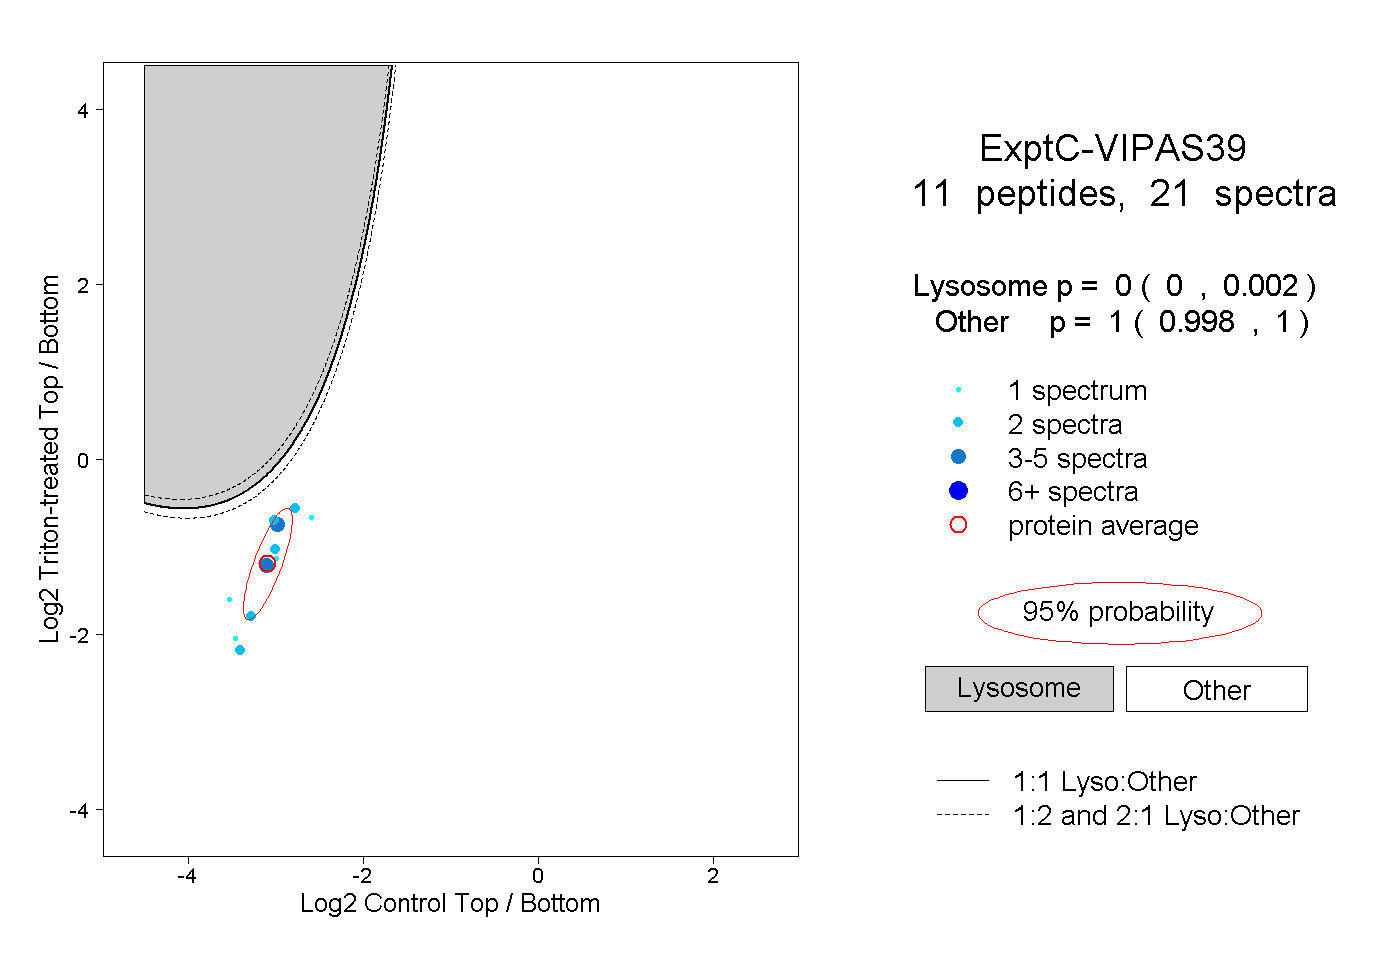
| Expt C |
11
peptides |
21
spectra |
 |
|
0.000
0.000 | 0.002 |
|
|
|
|
|
|
|
1.000
0.998 | 1.000 |
| | | Plot |
|
Lyso |
|
|
|
|
|
|
|
Other |
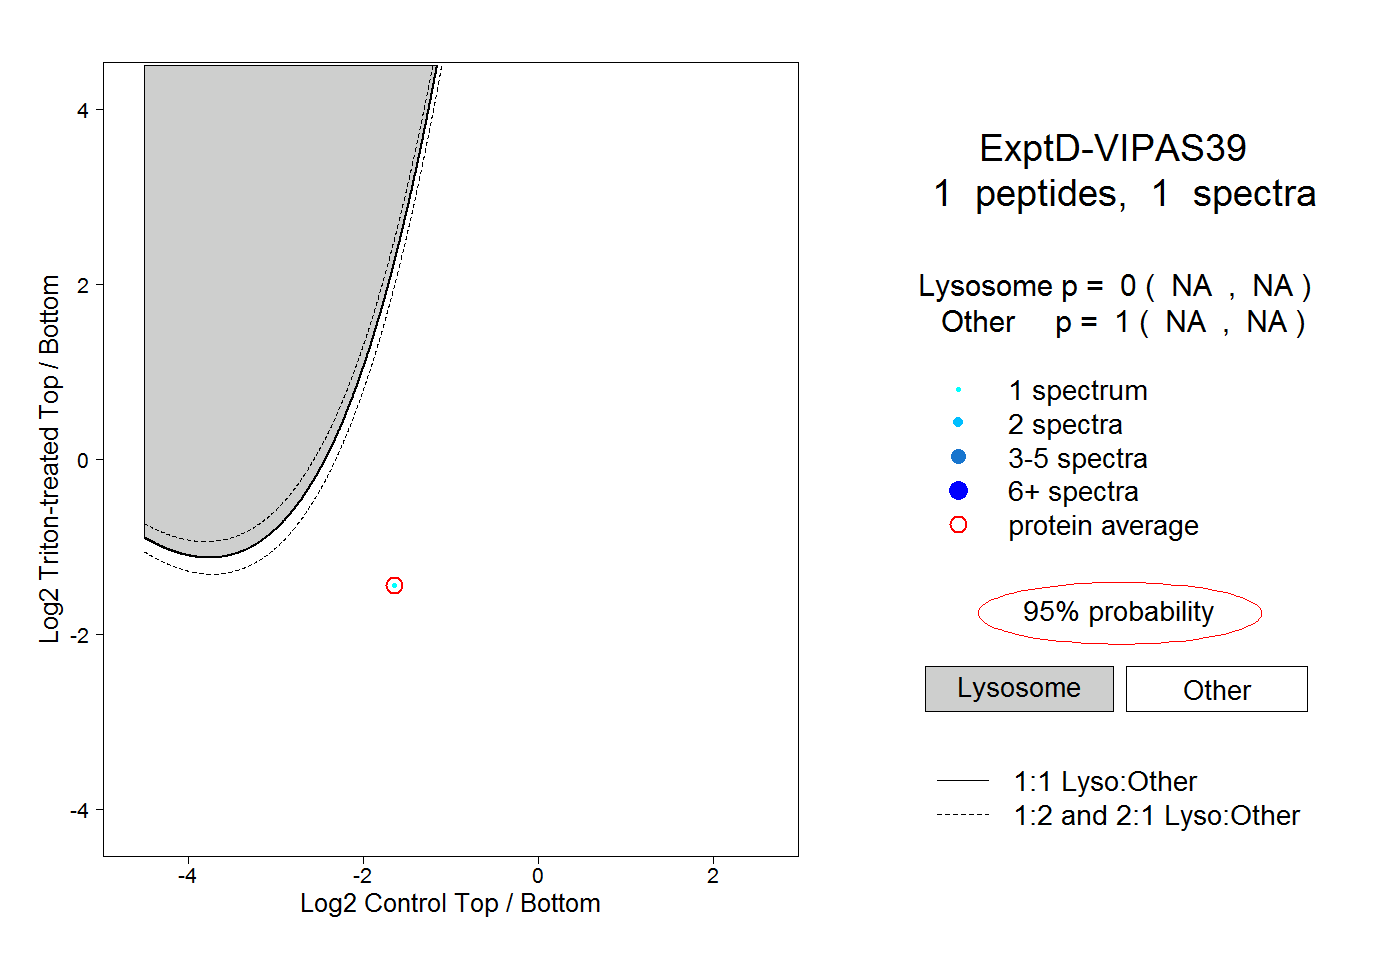
| Expt D |
1
peptide |
1
spectrum |
 |
|
0.000
NA | NA |
|
|
|
|
|
|
|
1.000
NA | NA |