 4
4peptides
spectra

0.000 | 0.000
0.000 | 0.000
0.000 | 0.003
0.000 | 0.080
0.162 | 0.272
0.212 | 0.277
0.408 | 0.434
0.055 | 0.075
3peptides
spectra
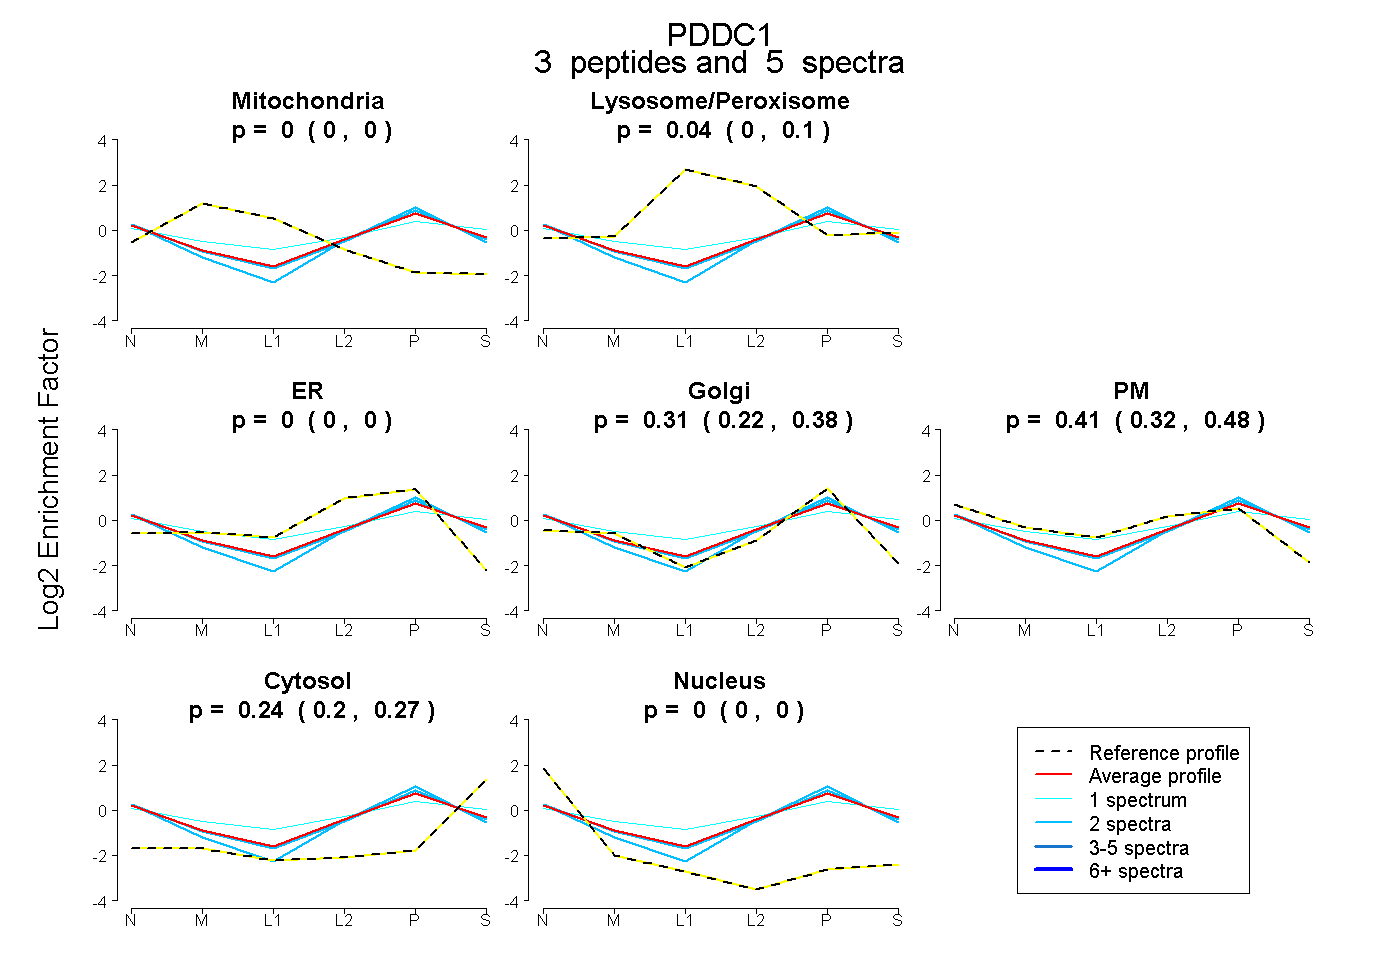
0.000 | 0.000
0.000 | 0.099
0.000 | 0.000
0.224 | 0.378
0.318 | 0.478
0.200 | 0.271
0.000 | 0.000
2peptides
spectra
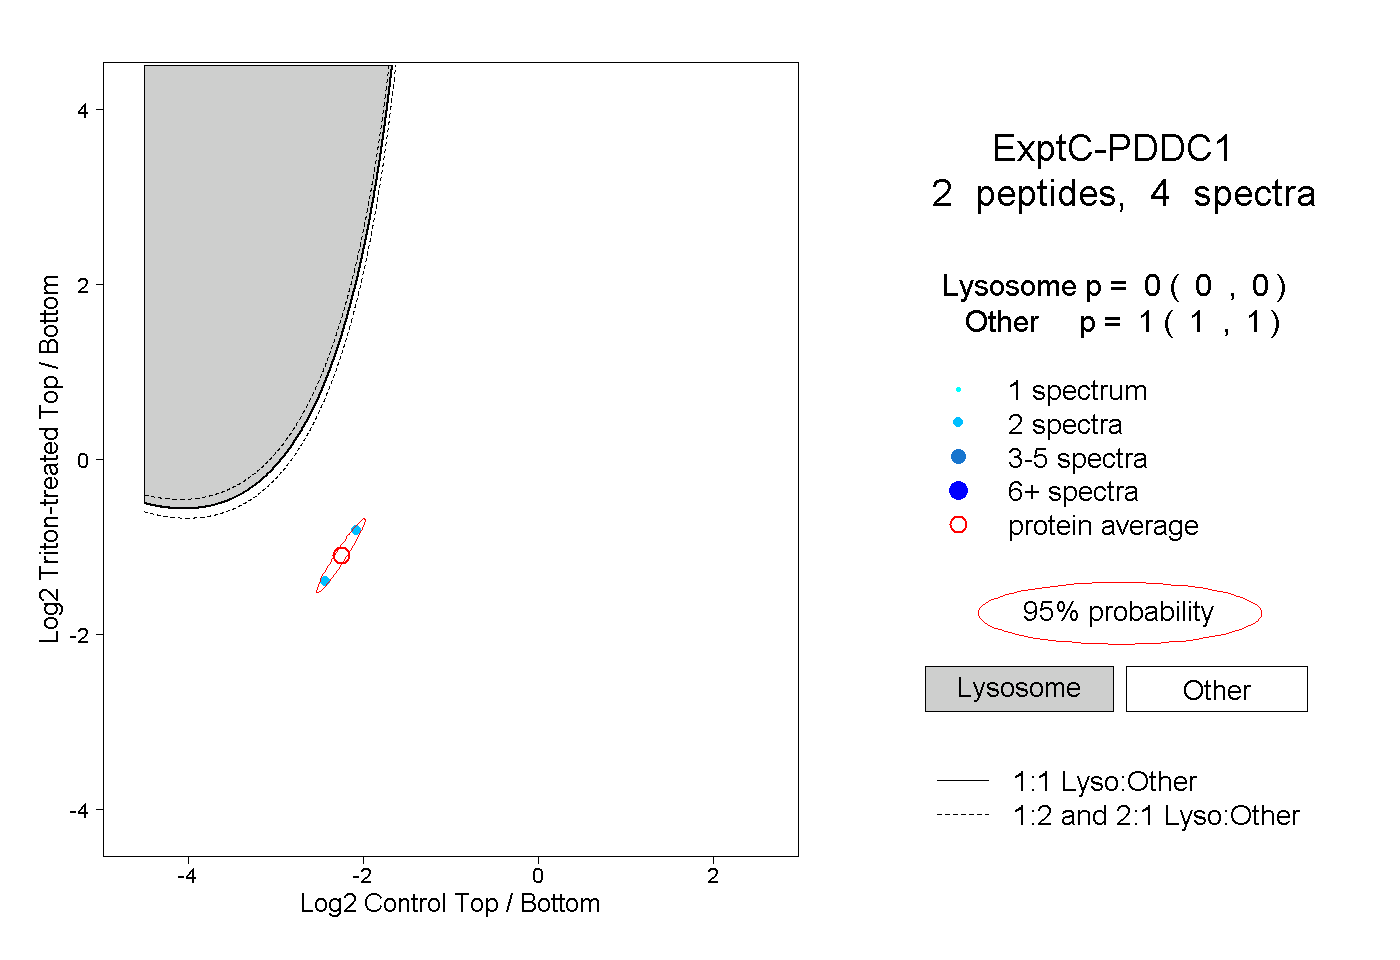
0.000 | 0.000
1.000 | 1.000
1peptide
spectra

NA | NA
NA | NA