 4
4peptides
spectra

0.000 | 0.000
0.000 | 0.000
0.000 | 0.003
0.000 | 0.080
0.162 | 0.272
0.212 | 0.277
0.408 | 0.434
0.055 | 0.075
| Plot | Mito | Lyso | Perox | ER | Golgi | PM | Cytosol | Nucleus | |||||
| Expt A |
4 peptides |
8 spectra |
|
0.000 0.000 | 0.000 |
0.000 0.000 | 0.000 |
0.000 0.000 | 0.003 |
0.041 0.000 | 0.080 |
0.221 0.162 | 0.272 |
0.248 0.212 | 0.277 |
0.425 0.408 | 0.434 |
0.066 0.055 | 0.075 |
| 1 spectrum, APGFAR | 0.000 | 0.000 | 0.000 | 0.154 | 0.256 | 0.137 | 0.420 | 0.033 | ||
| 4 spectra, AMDFVDVTENNAR | 0.000 | 0.000 | 0.017 | 0.125 | 0.033 | 0.318 | 0.472 | 0.035 | ||
| 2 spectra, WVQDFR | 0.000 | 0.000 | 0.000 | 0.000 | 0.354 | 0.183 | 0.381 | 0.081 | ||
| 1 spectrum, LSLIVEDFVK | 0.000 | 0.000 | 0.000 | 0.000 | 0.391 | 0.062 | 0.409 | 0.138 |
| Plot | Mito | Lyso or Perox | ER | Golgi | PM | Cytosol | Nucleus | ||||||
| Expt B |
3 peptides |
5 spectra |
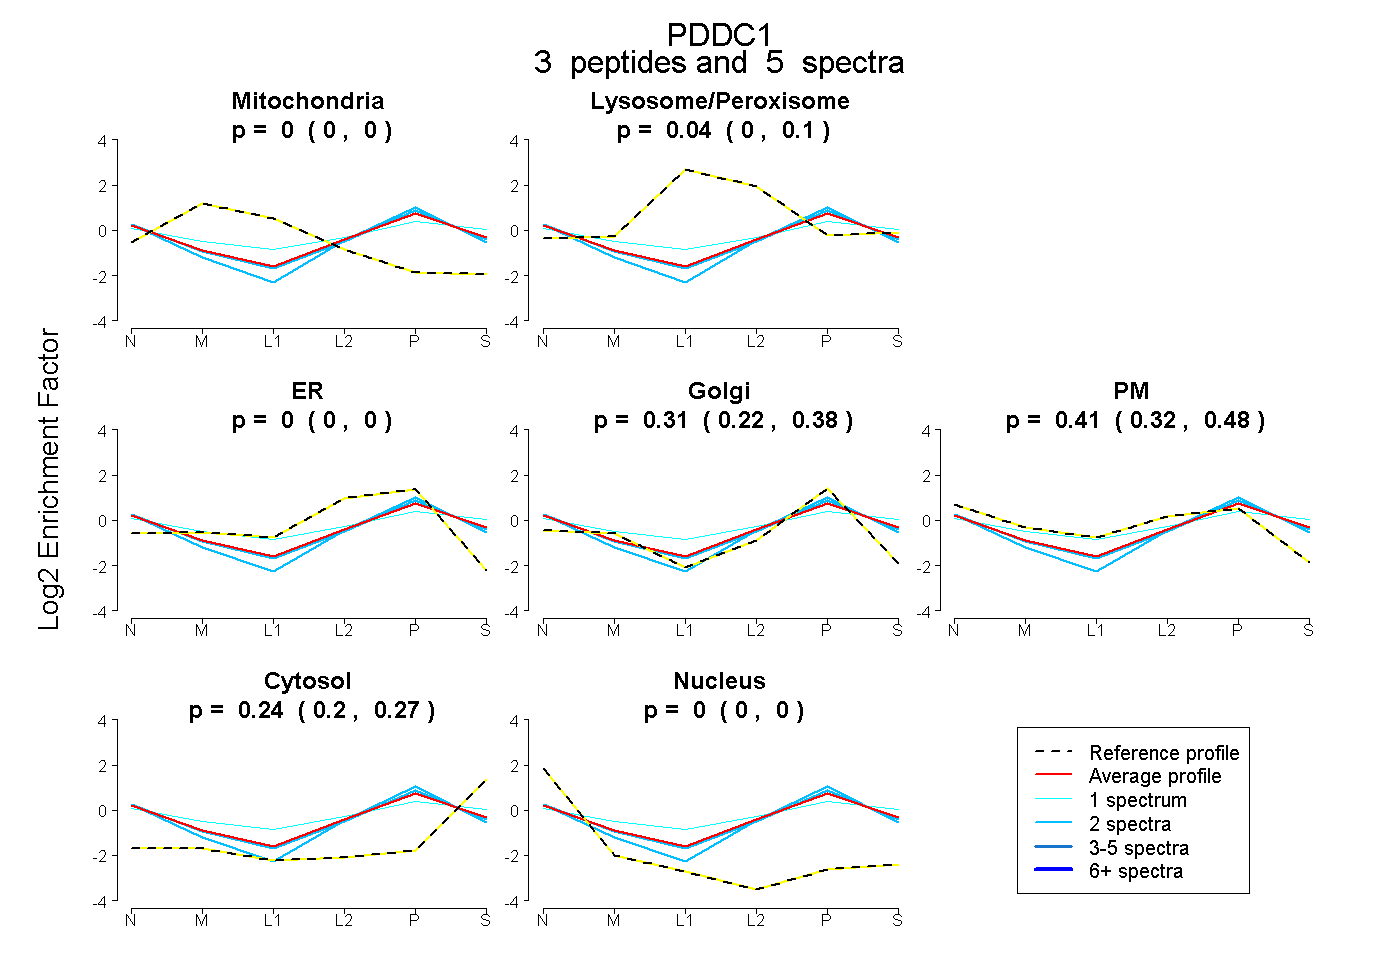 |
0.000 0.000 | 0.000 |
0.040 0.000 | 0.099 |
0.000 0.000 | 0.000 |
0.307 0.224 | 0.378 |
0.413 0.318 | 0.478 |
0.240 0.200 | 0.271 |
0.000 0.000 | 0.000 |
|||
| Plot | Lyso | Other | |||||||||||
| Expt C |
2 peptides |
4 spectra |
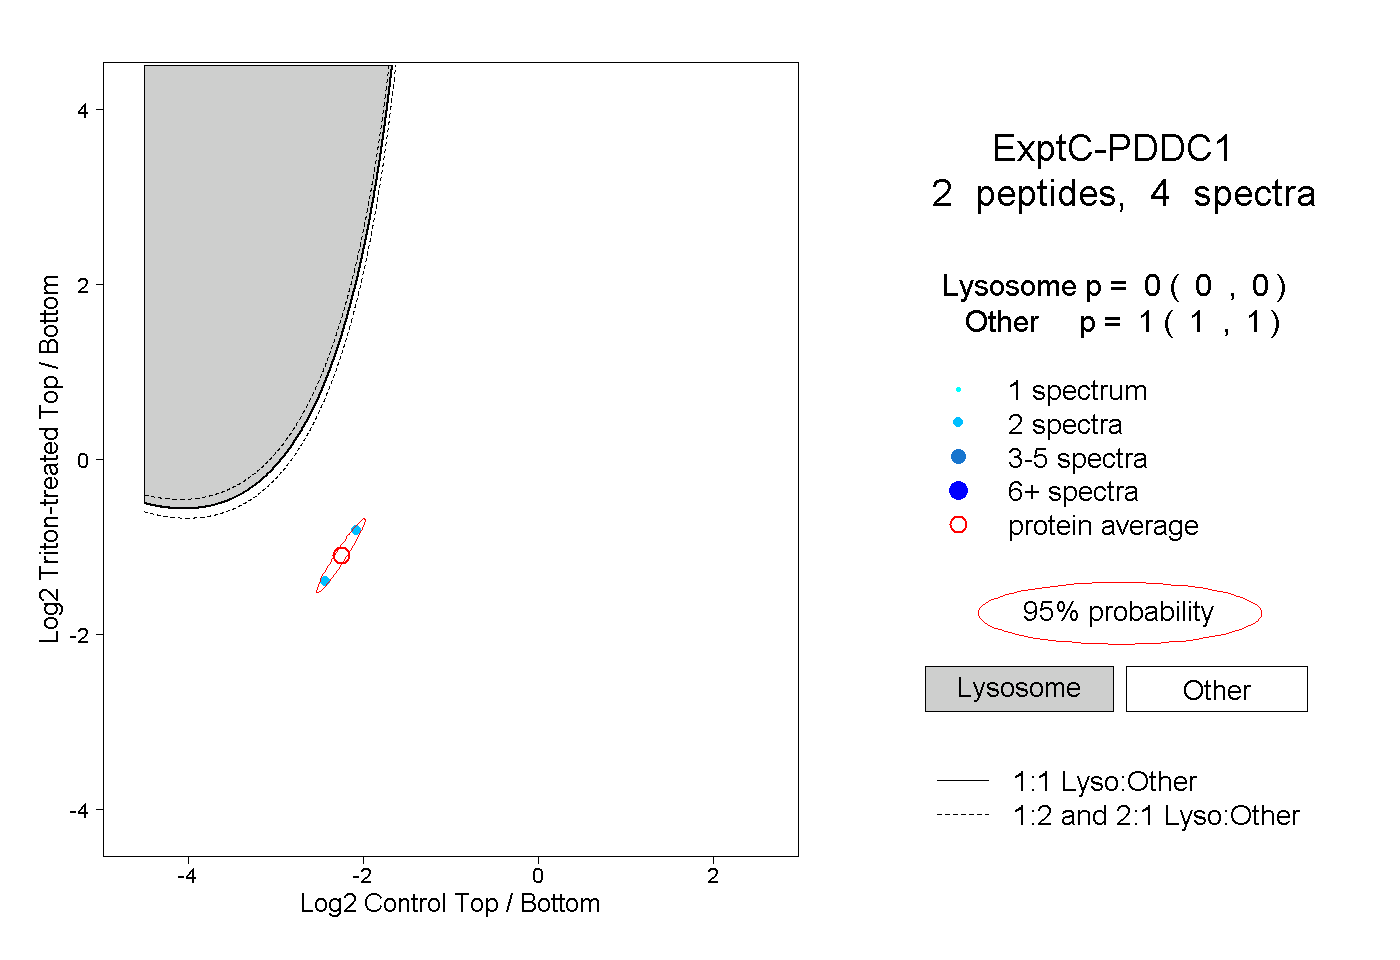 |
0.000 0.000 | 0.000 |
1.000 1.000 | 1.000 |
||||||||
| Plot | Lyso | Other | |||||||||||
| Expt D |
1 peptide |
2 spectra |
 |
0.000 NA | NA |
1.000 NA | NA |