 8
8peptides
spectra
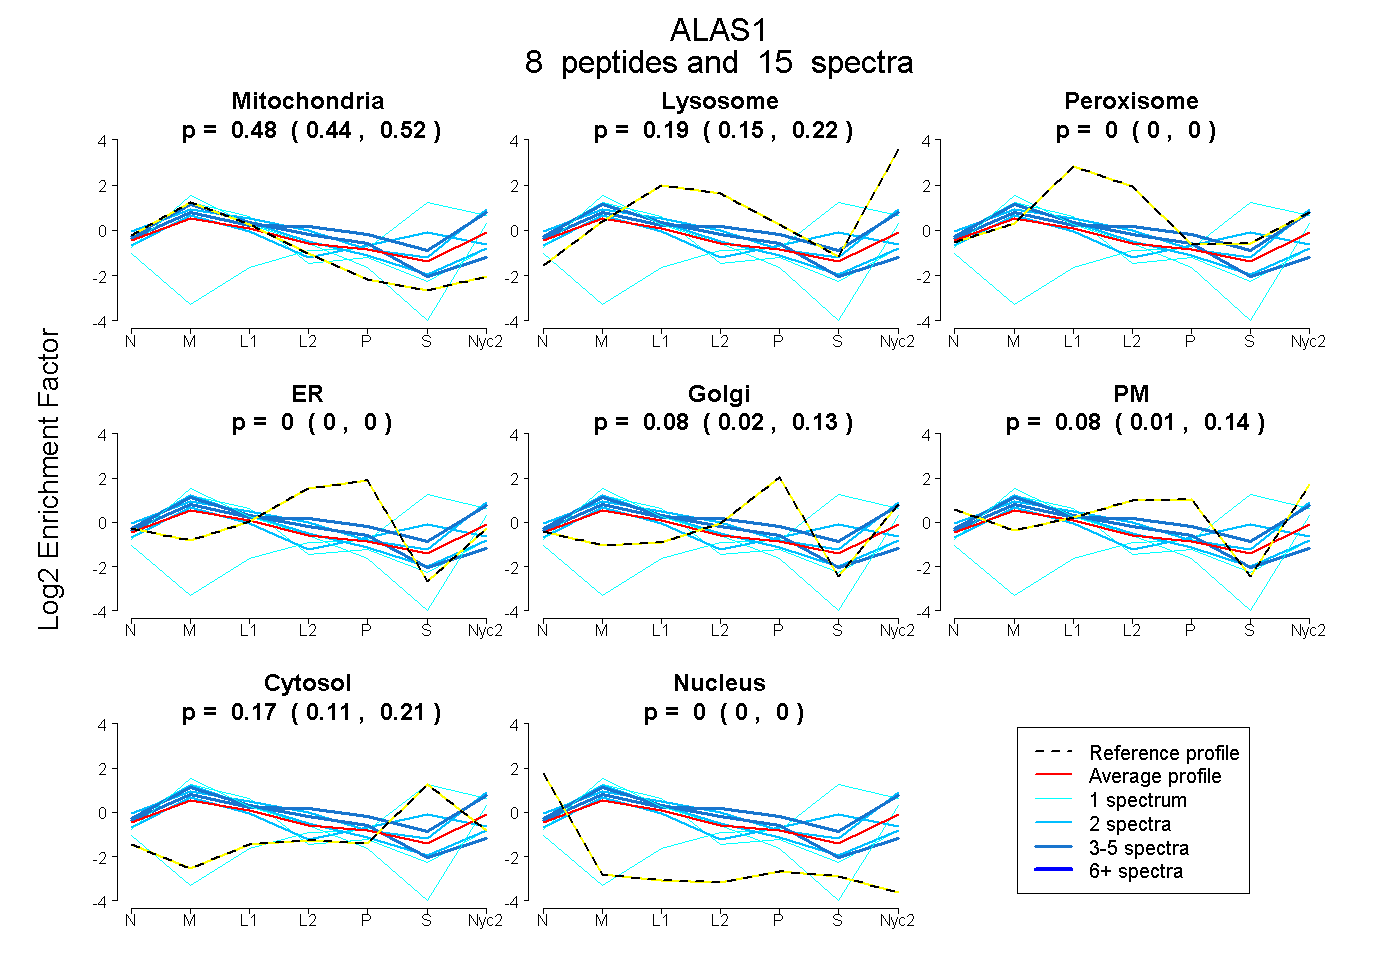
0.438 | 0.522
0.152 | 0.221
0.000 | 0.000
0.000 | 0.000
0.018 | 0.134
0.014 | 0.138
0.108 | 0.211
0.000 | 0.000
12peptides
spectra
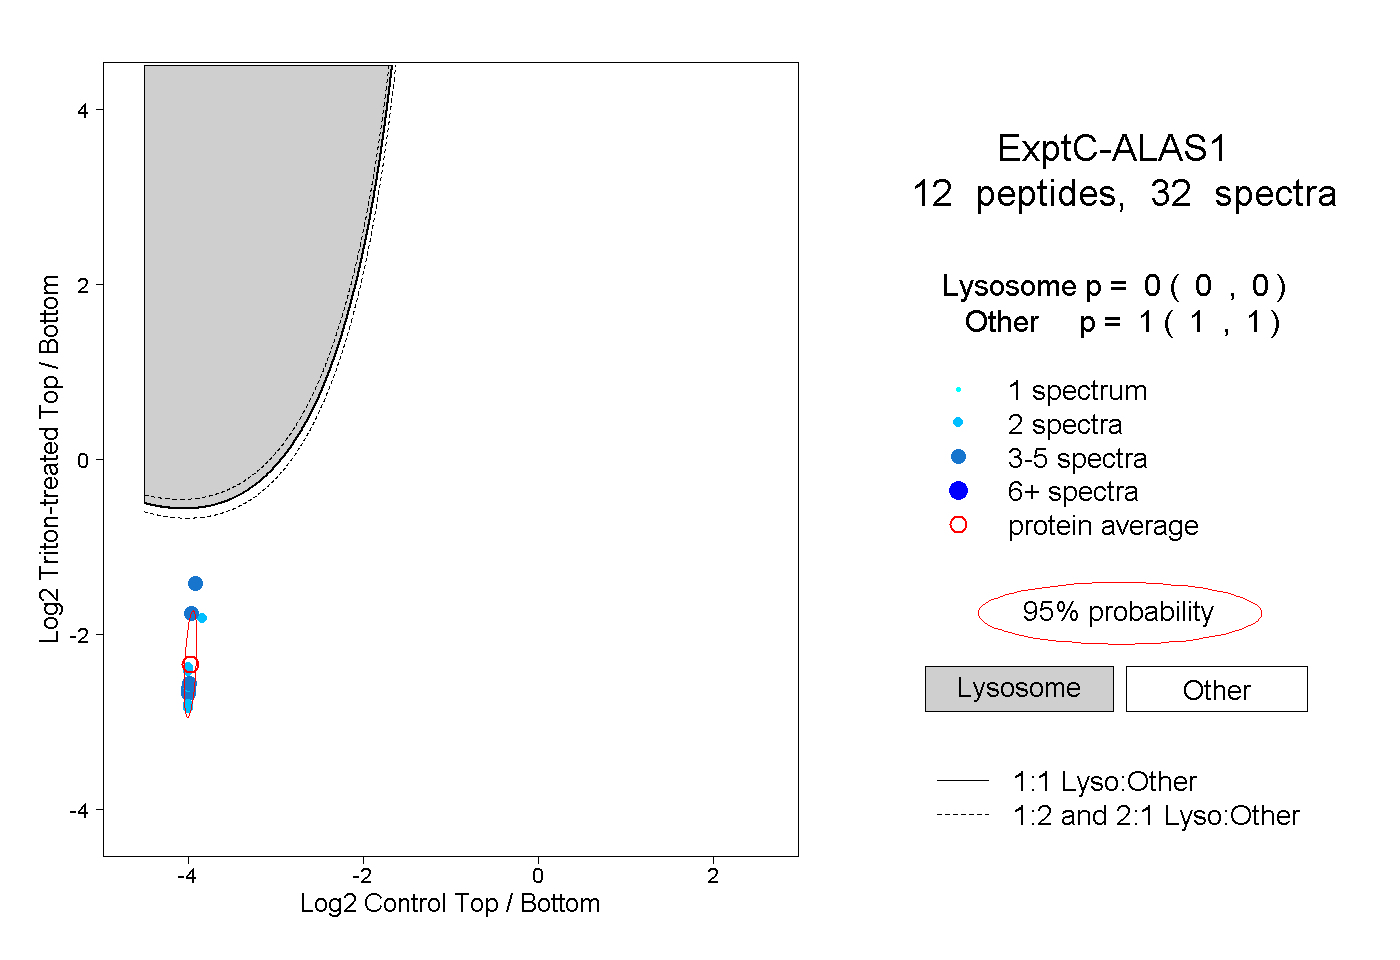
0.000 | 0.000
1.000 | 1.000
2peptides
spectra
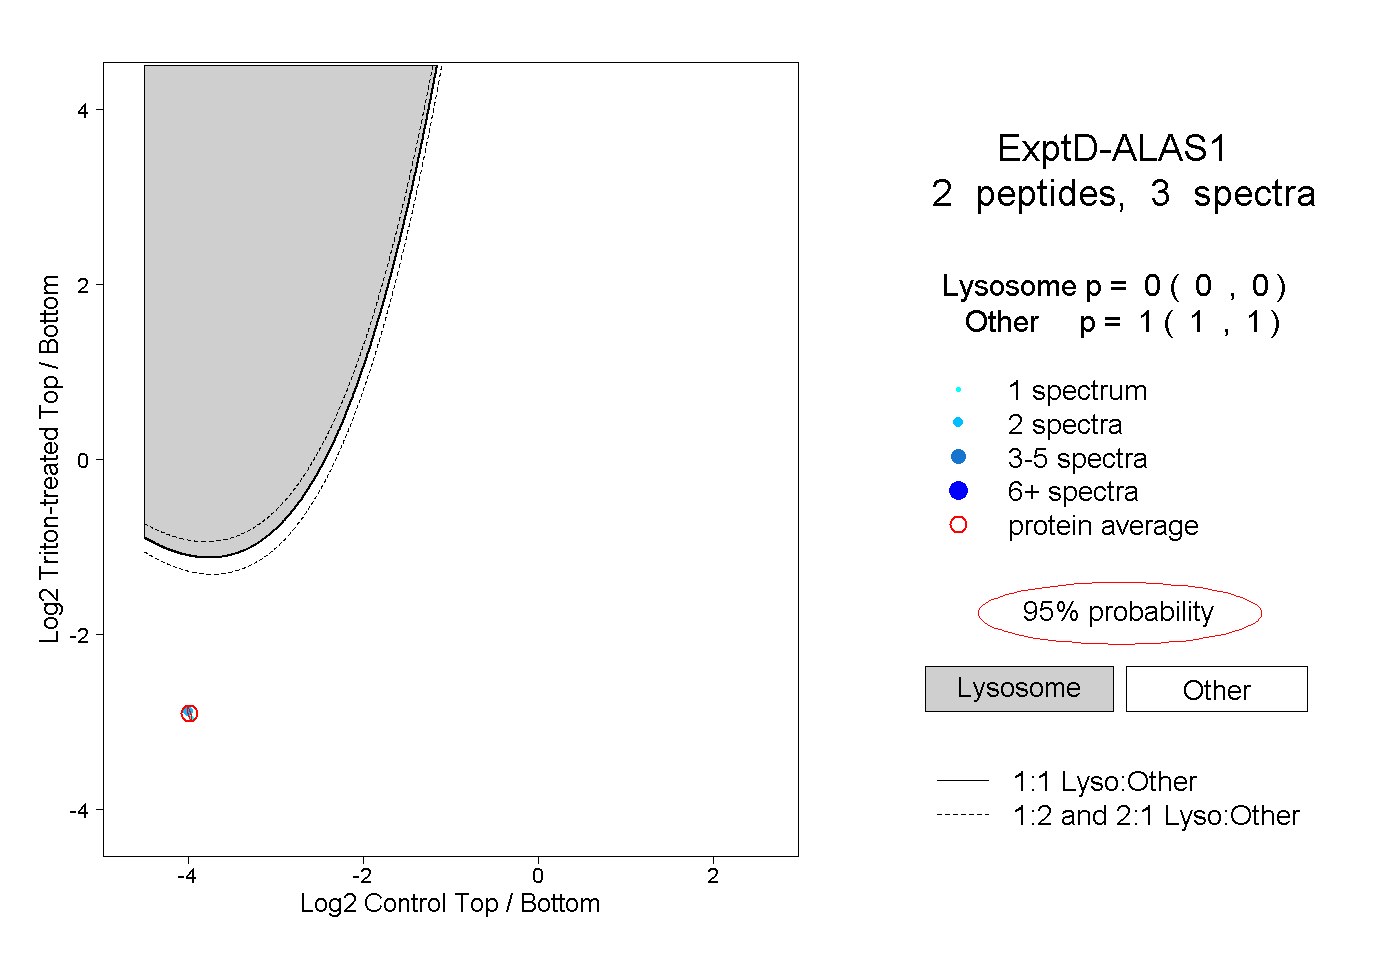
0.000 | 0.000
1.000 | 1.000