 8
8peptides
spectra
0.438 | 0.522
0.152 | 0.221
0.000 | 0.000
0.000 | 0.000
0.018 | 0.134
0.014 | 0.138
0.108 | 0.211
0.000 | 0.000
| Plot | Mito | Lyso | Perox | ER | Golgi | PM | Cytosol | Nucleus | |||||
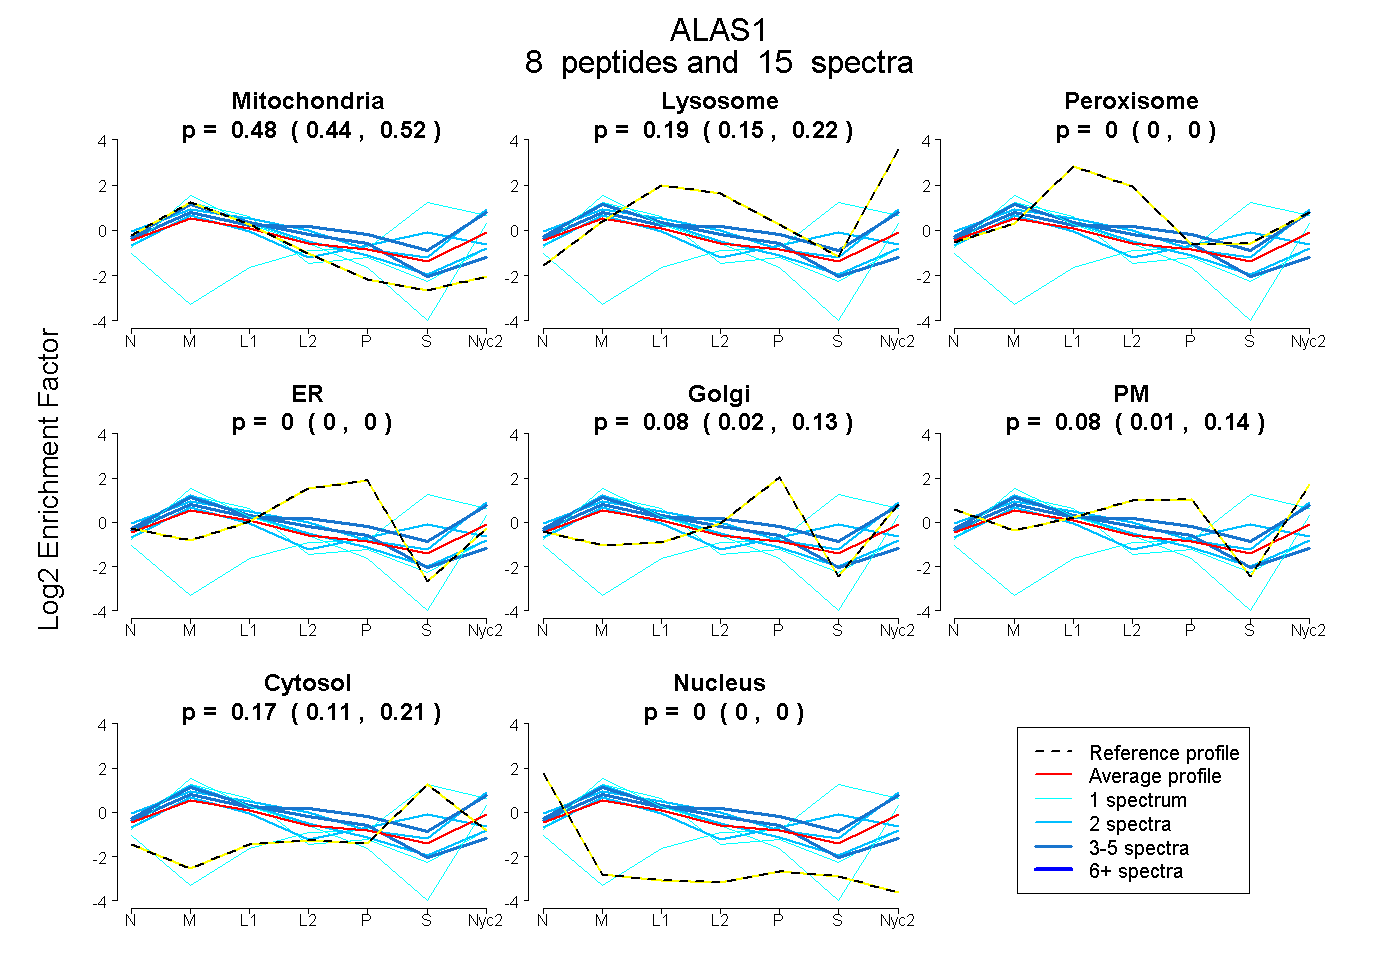
| Expt A |
8 peptides |
15 spectra |
|
0.482 0.438 | 0.522 |
0.190 0.152 | 0.221 |
0.000 0.000 | 0.000 |
0.000 0.000 | 0.000 |
0.080 0.018 | 0.134 |
0.082 0.014 | 0.138 |
0.166 0.108 | 0.211 |
0.000 0.000 | 0.000 |
| 2 spectra, HNDVNHLR | 0.402 | 0.349 | 0.000 | 0.000 | 0.000 | 0.164 | 0.085 | 0.000 | ||
| 3 spectra, RPLHFEVMSER | 0.294 | 0.311 | 0.007 | 0.000 | 0.000 | 0.234 | 0.154 | 0.000 | ||
| 1 spectrum, ASLELQEDVQEMHAVR | 0.778 | 0.124 | 0.000 | 0.000 | 0.097 | 0.000 | 0.000 | 0.000 | ||
| 3 spectra, NTEICDELMTR | 0.613 | 0.000 | 0.131 | 0.143 | 0.113 | 0.000 | 0.000 | 0.000 | ||
| 1 spectrum, DGVMPK | 0.000 | 0.066 | 0.000 | 0.000 | 0.062 | 0.000 | 0.873 | 0.000 | ||
| 2 spectra, NFQDIMR | 0.699 | 0.133 | 0.034 | 0.000 | 0.090 | 0.032 | 0.012 | 0.000 | ||
| 1 spectrum, VCGAVIETVK | 0.697 | 0.196 | 0.000 | 0.000 | 0.000 | 0.107 | 0.000 | 0.000 | ||
| 2 spectra, AYFSGMSK | 0.436 | 0.159 | 0.017 | 0.000 | 0.026 | 0.000 | 0.361 | 0.000 |
| Plot | Lyso | Other | |||||||||||
| Expt C |
12 peptides |
32 spectra |
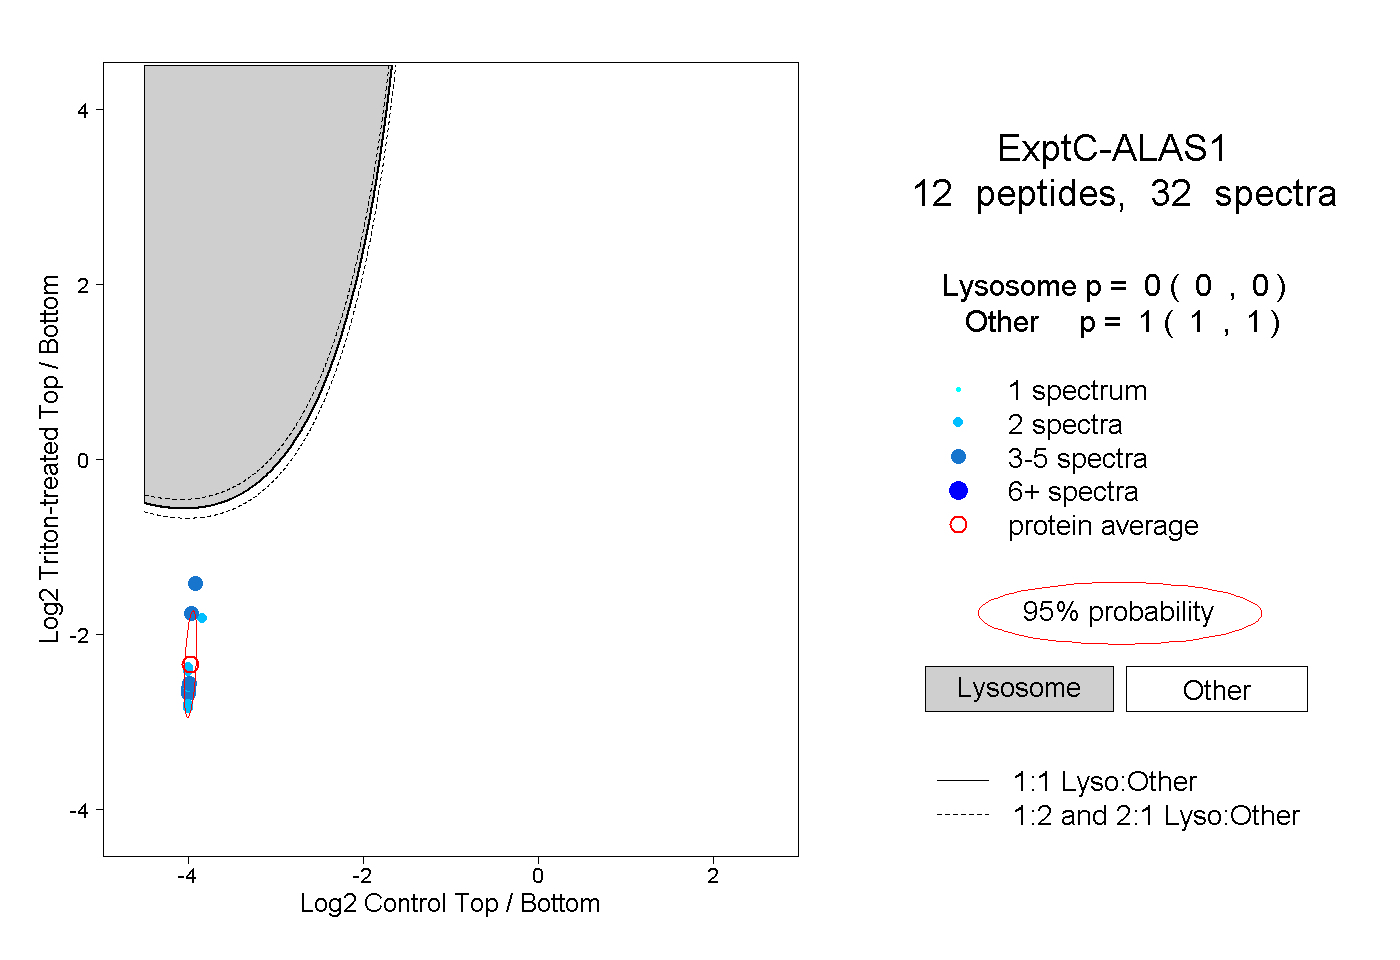 |
0.000 0.000 | 0.000 |
1.000 1.000 | 1.000 |
||||||||
| Plot | Lyso | Other | |||||||||||
| Expt D |
2 peptides |
3 spectra |
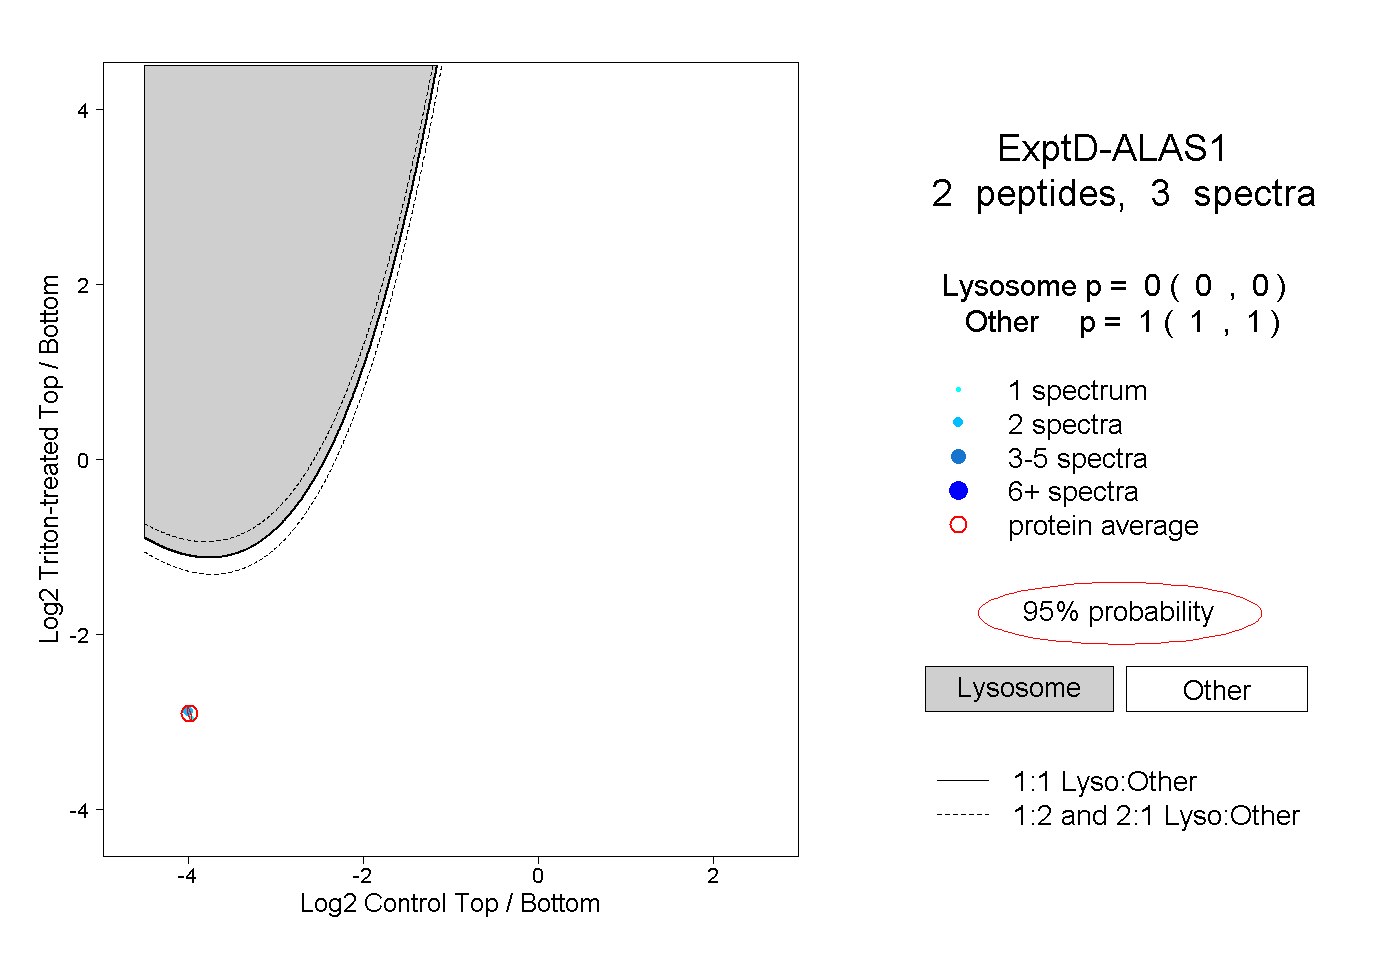 |
0.000 0.000 | 0.000 |
1.000 1.000 | 1.000 |