 9
9peptides
spectra
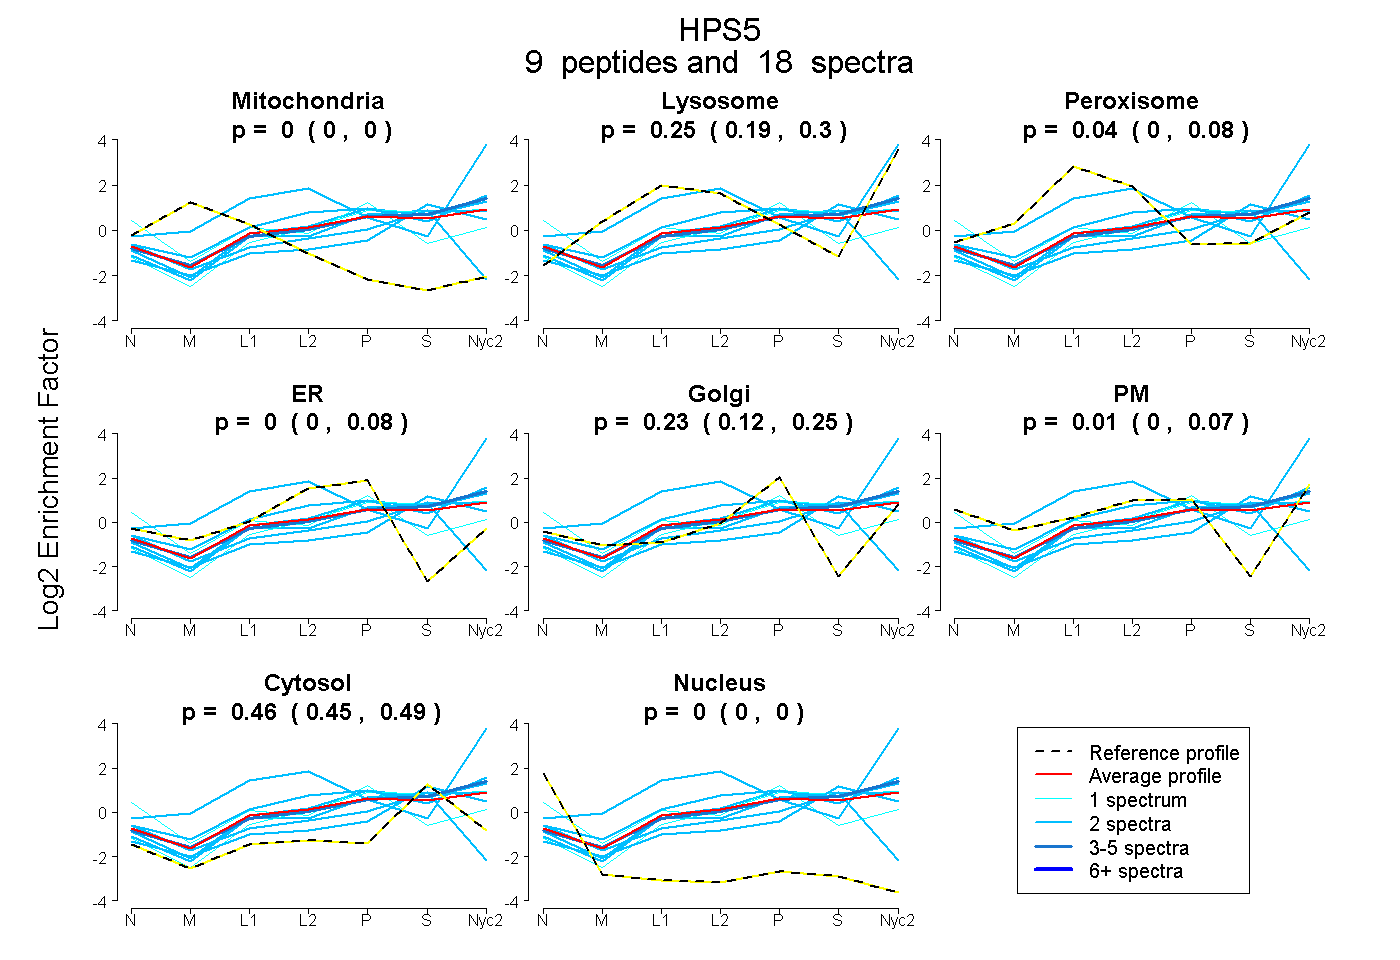
0.000 | 0.000
0.195 | 0.304
0.000 | 0.081
0.000 | 0.076
0.123 | 0.250
0.000 | 0.074
0.448 | 0.486
0.000 | 0.000
1peptide
spectra
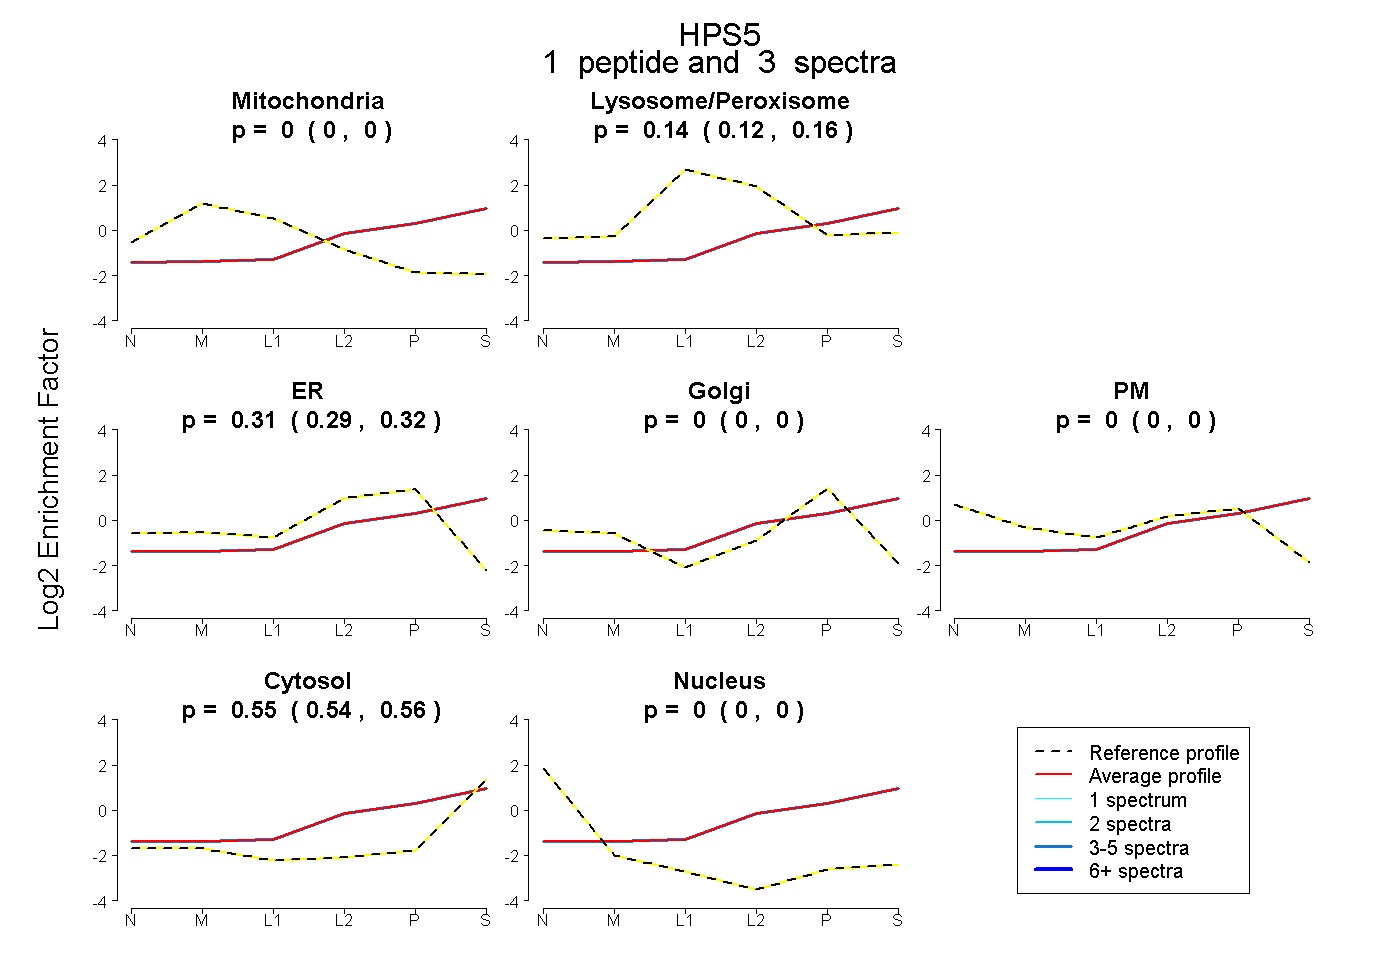
0.000 | 0.000
0.121 | 0.165
0.292 | 0.323
0.000 | 0.000
0.000 | 0.000
0.536 | 0.556
0.000 | 0.000
7peptides
spectra
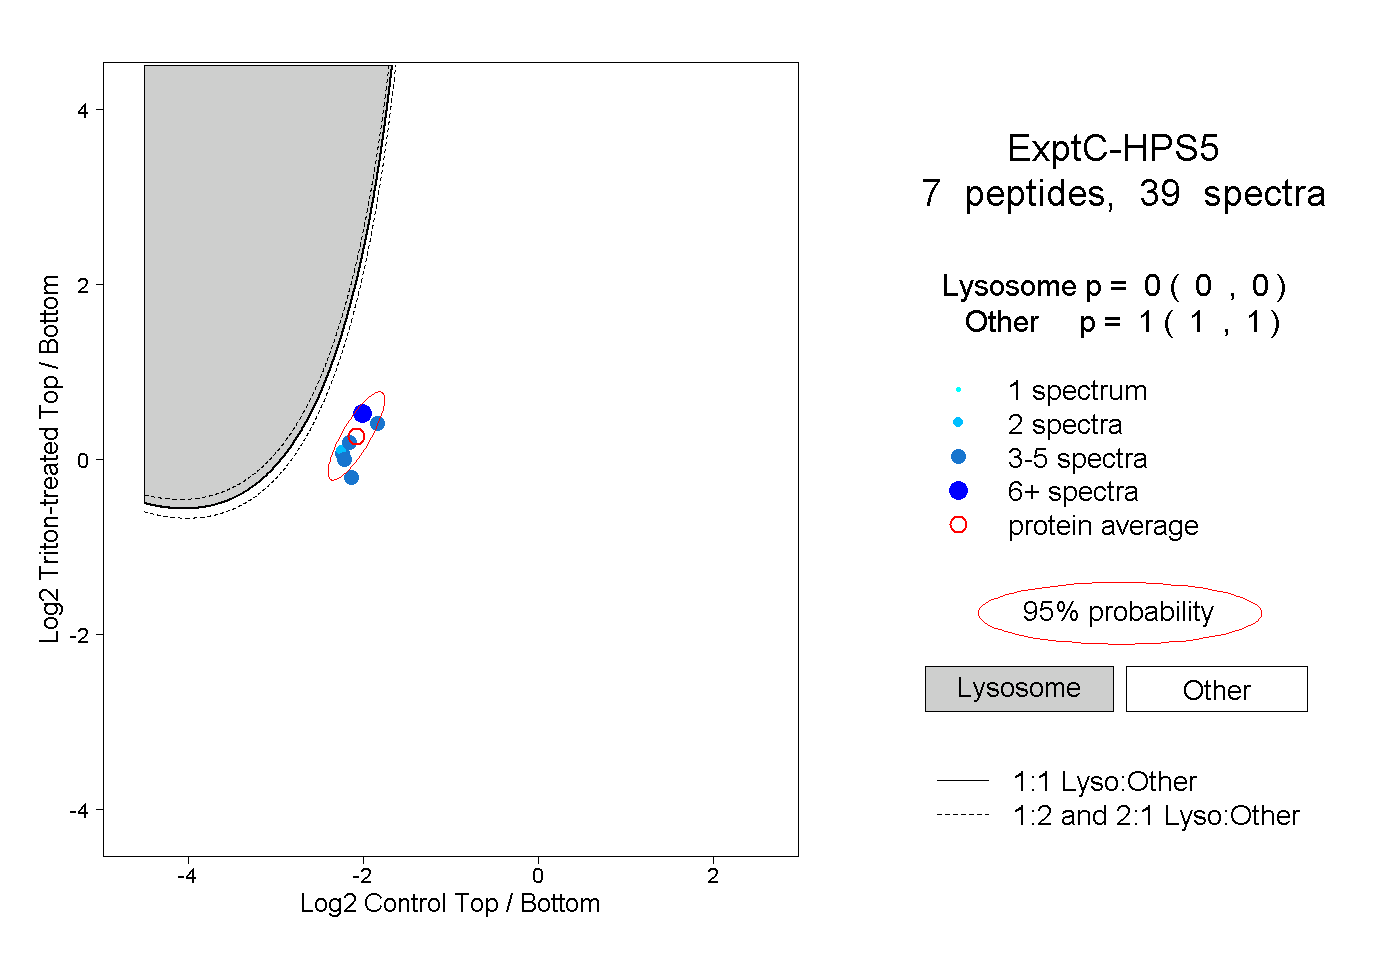
0.000 | 0.000
1.000 | 1.000
1peptide
spectra
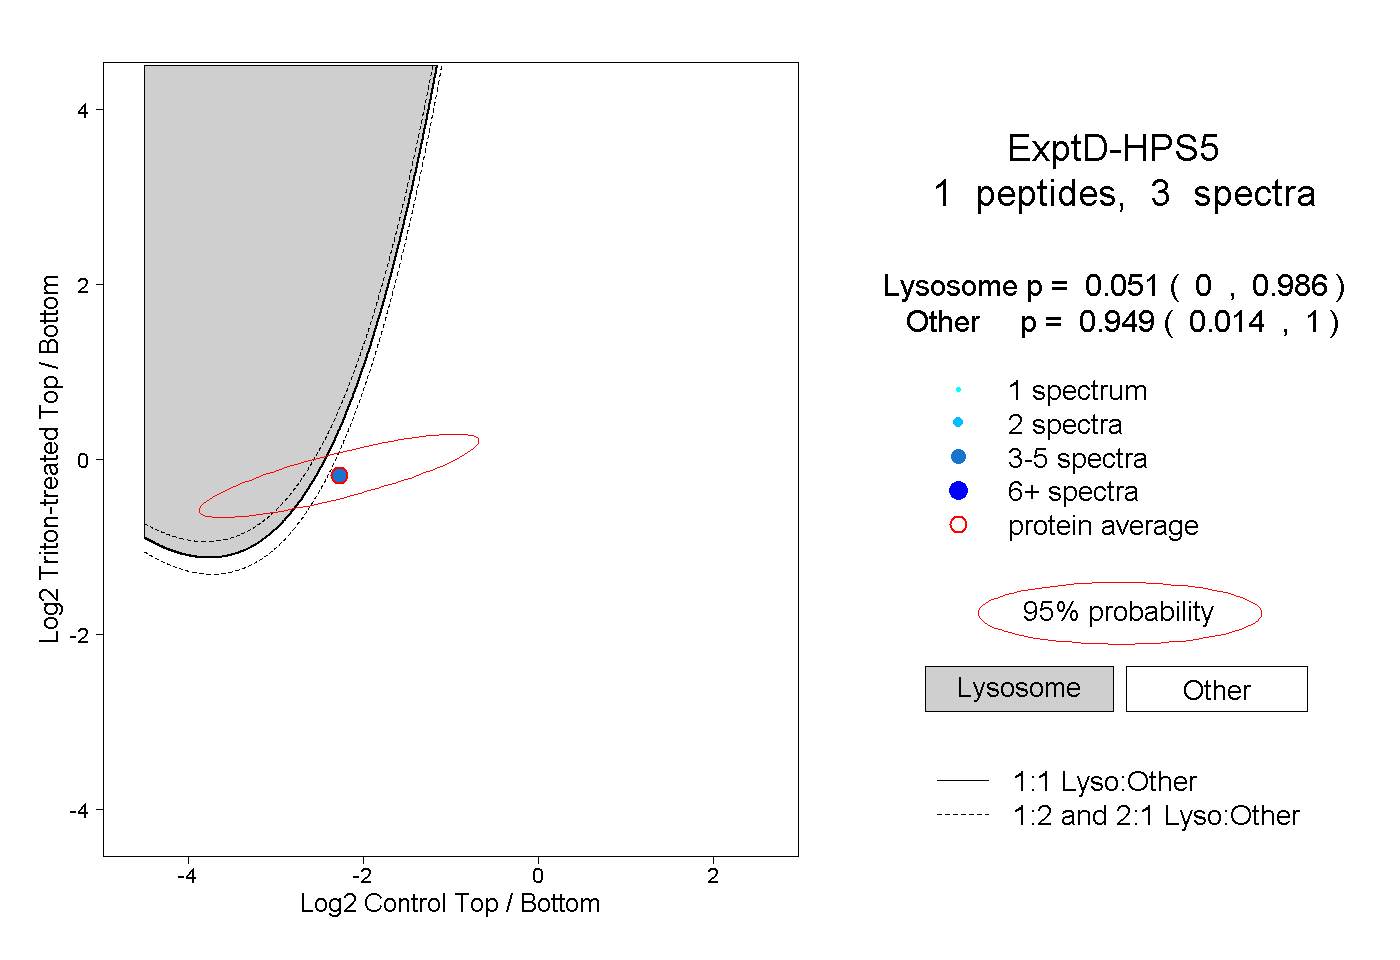
0.000 | 0.986
0.014 | 1.000