HPS5
[ENSRNOP00000064978]
Main page
| | | Plot |
Mito |
Lyso |
|
Perox |
ER |
Golgi |
PM |
Cytosol |
Nucleus |
|
| Expt A |
 9
9
peptides |
18
spectra |
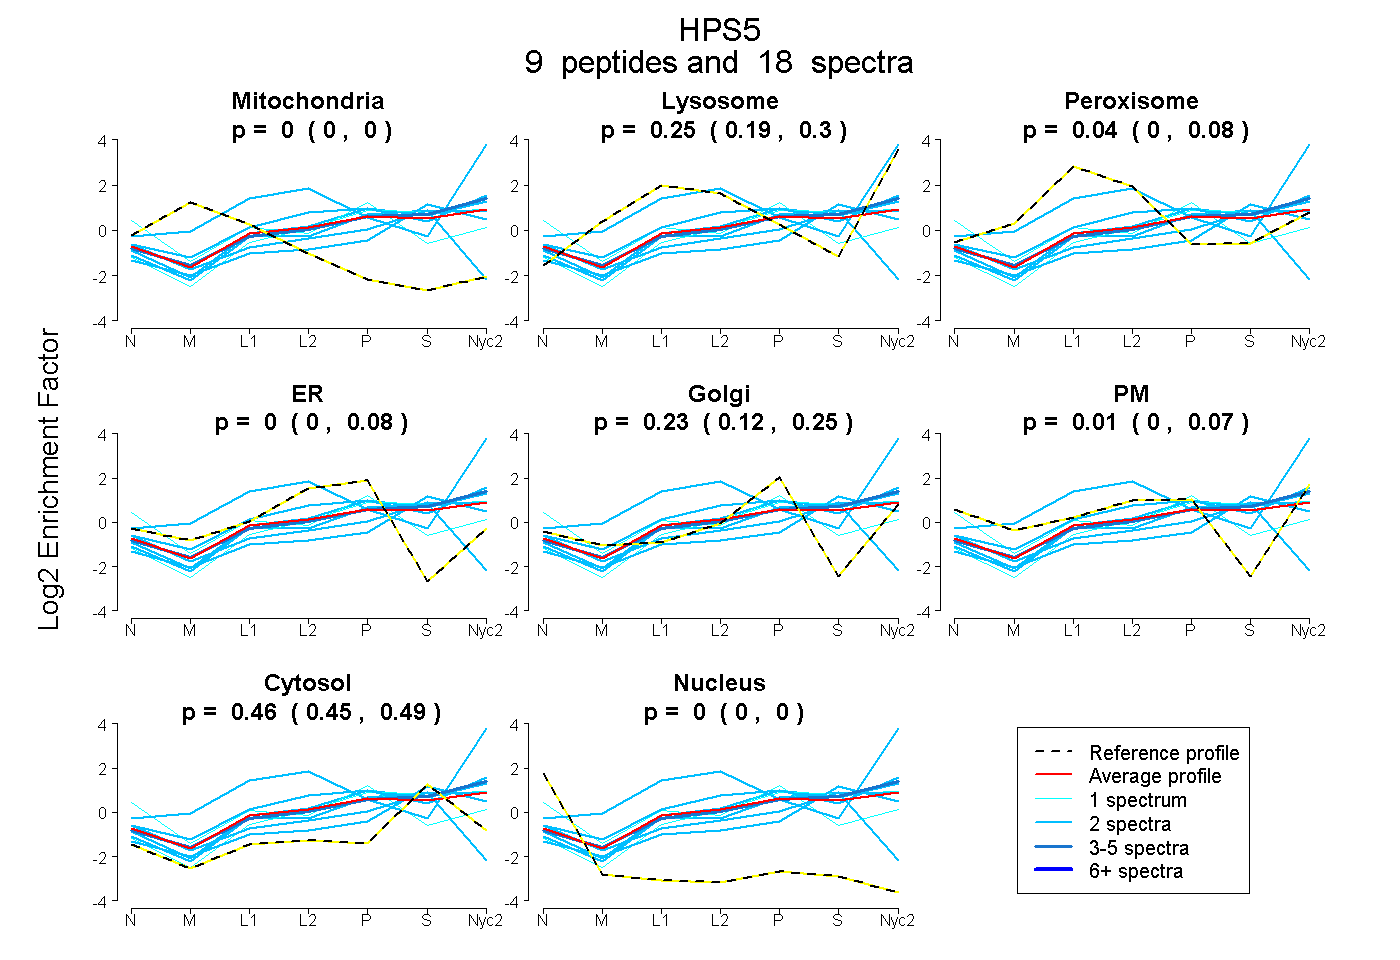 |
0.000
0.000 | 0.000 |
0.251
0.195 | 0.304 |
|
0.045
0.000 | 0.081 |
0.000
0.000 | 0.076 |
0.230
0.123 | 0.250 |
0.010
0.000 | 0.074 |
0.464
0.448 | 0.486 |
0.000
0.000 | 0.000 |
|
| | | Plot |
Mito |
|
Lyso or Perox |
|
ER |
Golgi |
PM |
Cytosol |
Nucleus |
|
| Expt B |
1
peptide |
3
spectra |
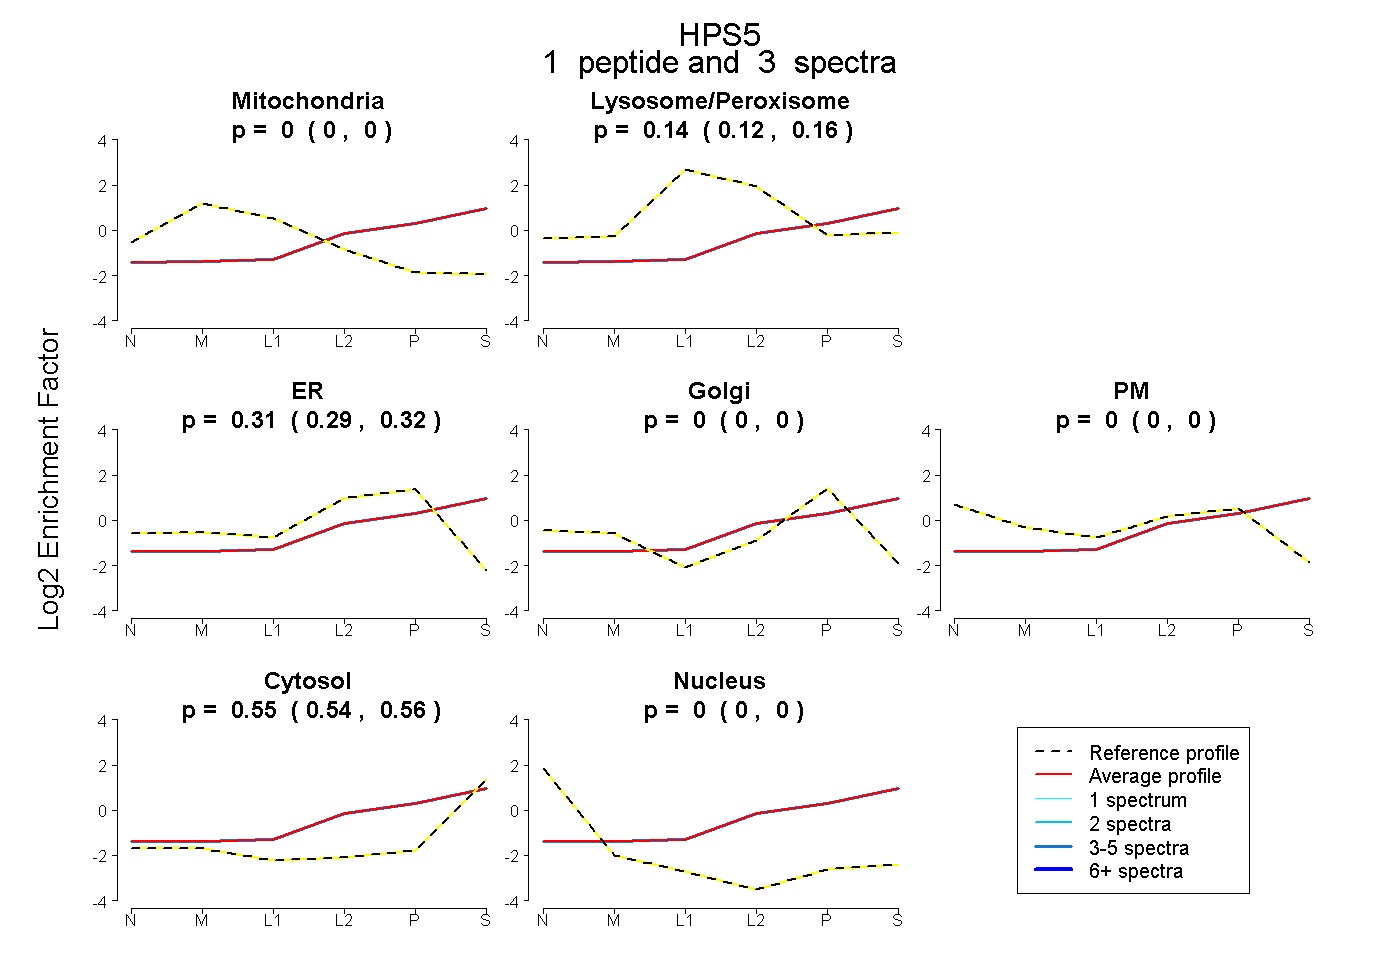 |
0.000
0.000 | 0.000 |
|
0.145
0.121 | 0.165 |
|
0.309
0.292 | 0.323 |
0.000
0.000 | 0.000 |
0.000
0.000 | 0.000 |
0.547
0.536 | 0.556 |
0.000
0.000 | 0.000 |
|
| | | Plot |
|
Lyso |
|
|
|
|
|
|
|
Other |
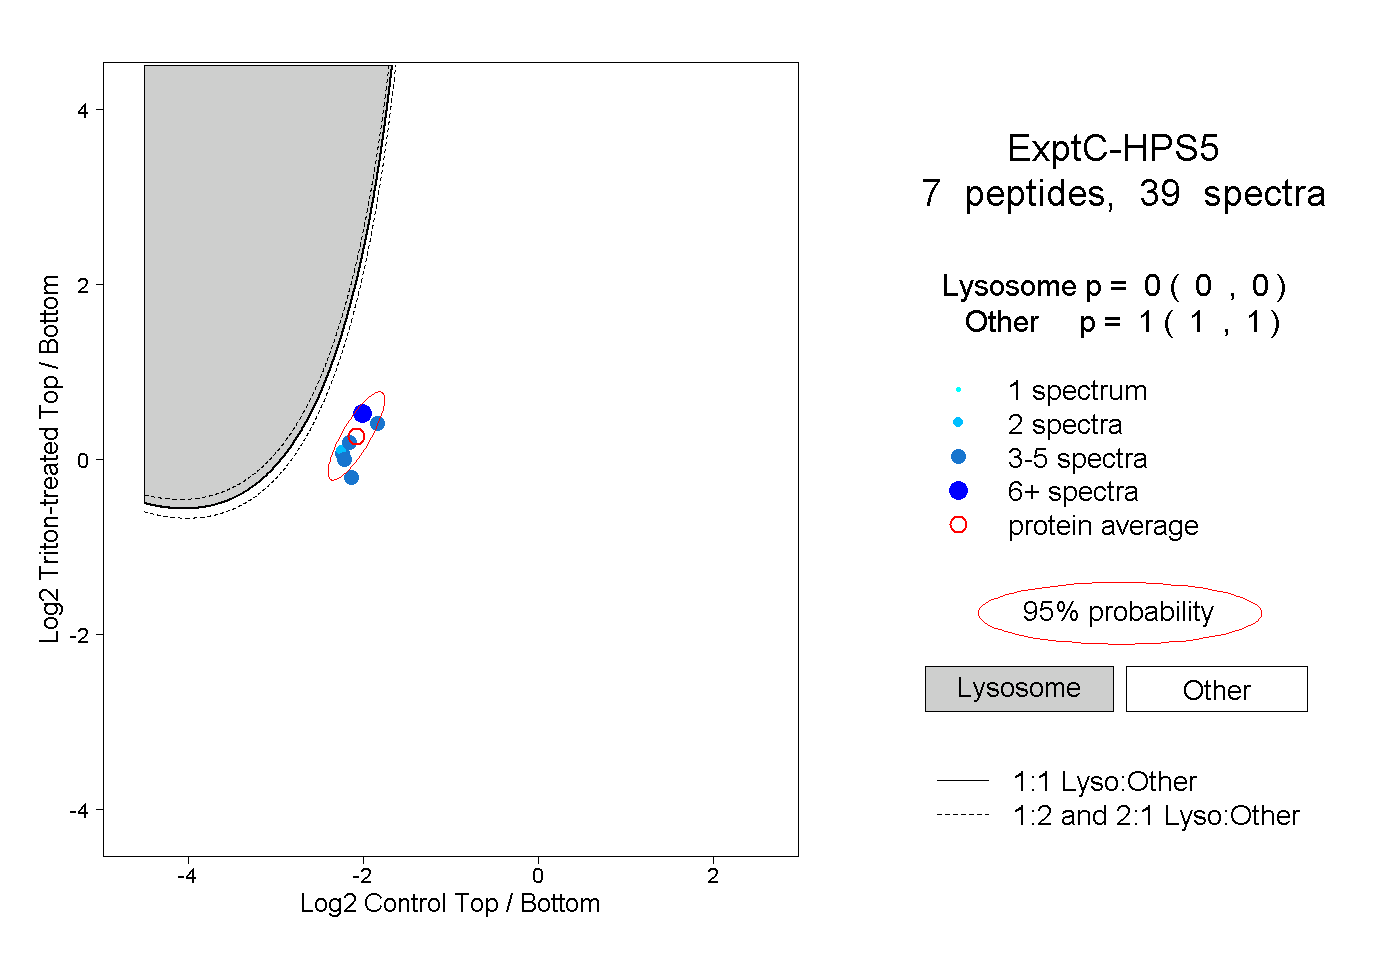
| Expt C |
7
peptides |
39
spectra |
 |
|
0.000
0.000 | 0.000 |
|
|
|
|
|
|
|
1.000
1.000 | 1.000 |
| 4 spectra, YYFGIR |
|
0.000 |
|
|
|
|
|
|
|
1.000 |
| 16 spectra, GNFEAQQR |
|
0.000 |
|
|
|
|
|
|
|
1.000 |
| 4 spectra, IISTGR |
|
0.000 |
|
|
|
|
|
|
|
1.000 |
| 4 spectra, EAIQGTWDLCR |
|
0.000 |
|
|
|
|
|
|
|
1.000 |
| 4 spectra, AEEWGR |
|
0.000 |
|
|
|
|
|
|
|
1.000 |
| 2 spectra, GSGGVWAAK |
|
0.000 |
|
|
|
|
|
|
|
1.000 |
| 5 spectra, YFQGLMNR |
|
0.000 |
|
|
|
|
|
|
|
1.000 |
| | | Plot |
|
Lyso |
|
|
|
|
|
|
|
Other |
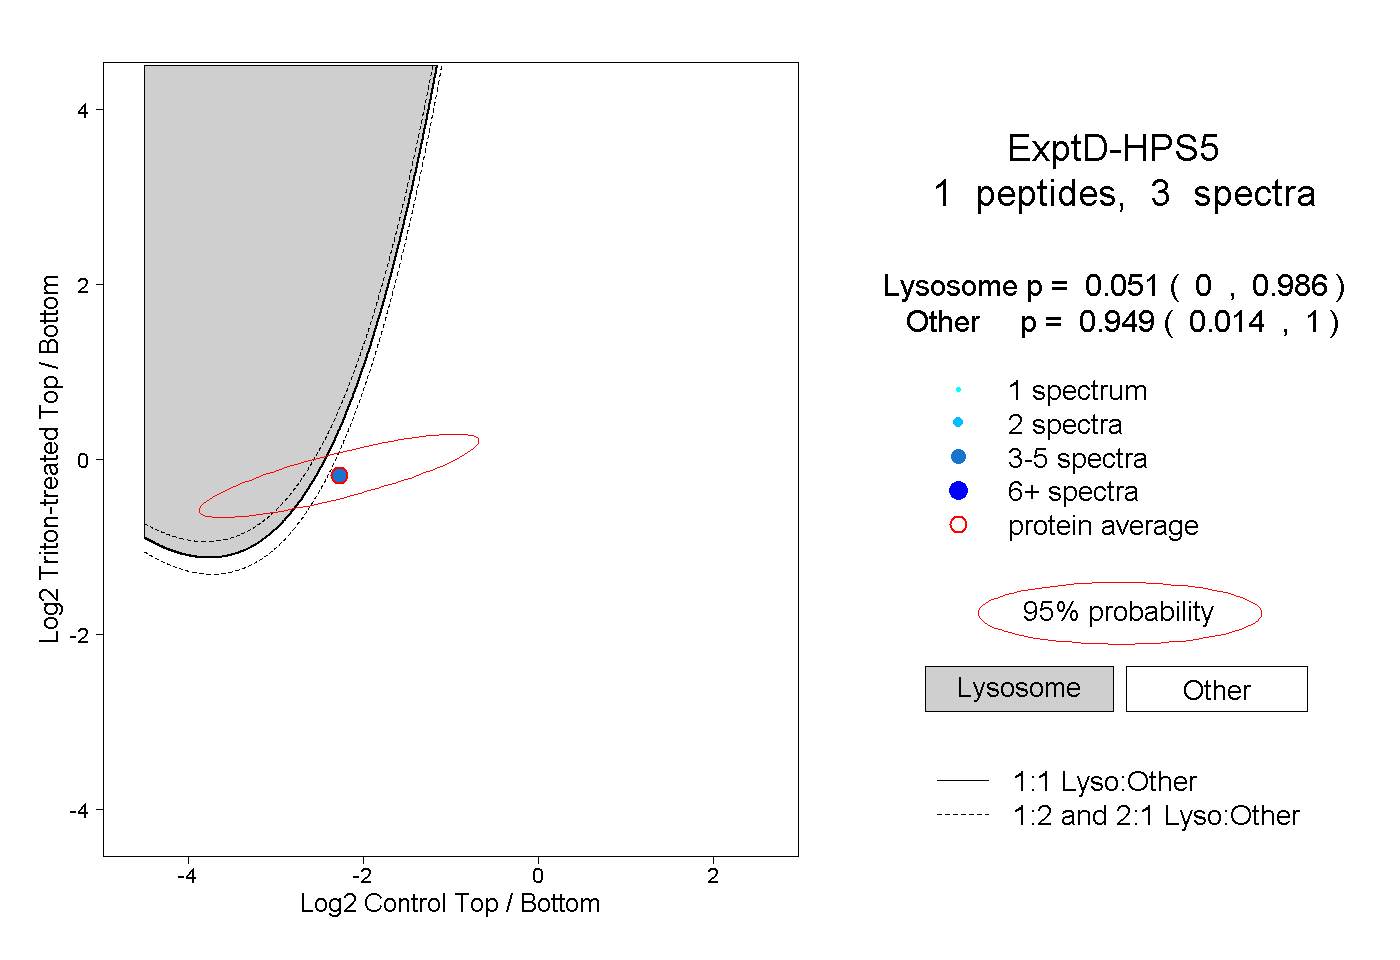
| Expt D |
1
peptide |
3
spectra |
 |
|
0.051
0.000 | 0.986 |
|
|
|
|
|
|
|
0.949
0.014 | 1.000 |