 4
4peptides
spectra
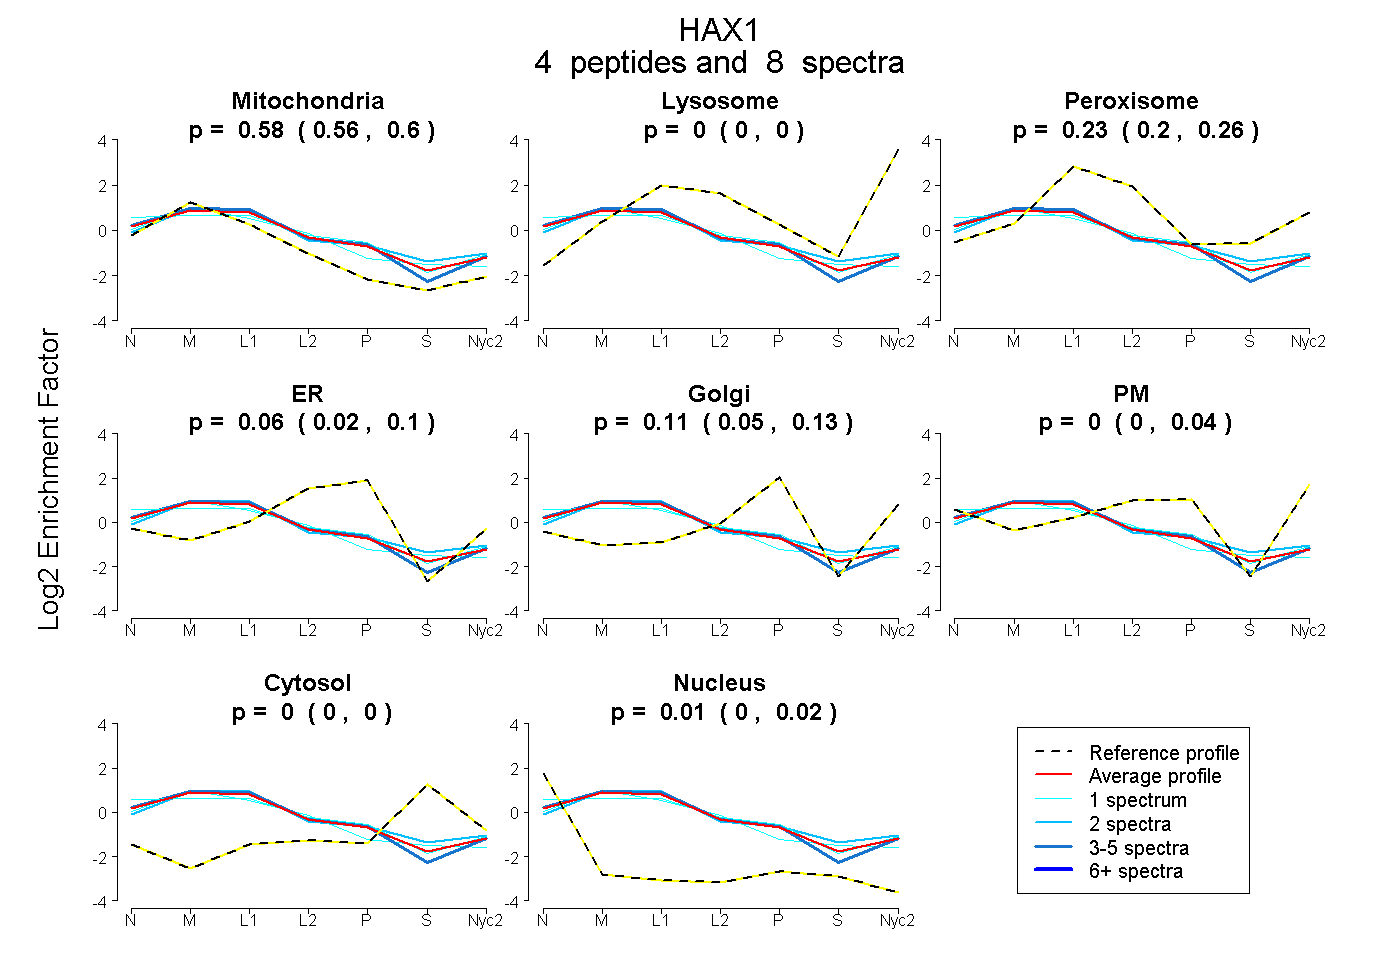
0.557 | 0.604
0.000 | 0.000
0.195 | 0.260
0.023 | 0.103
0.053 | 0.134
0.000 | 0.044
0.000 | 0.004
0.000 | 0.024
2peptides
spectra
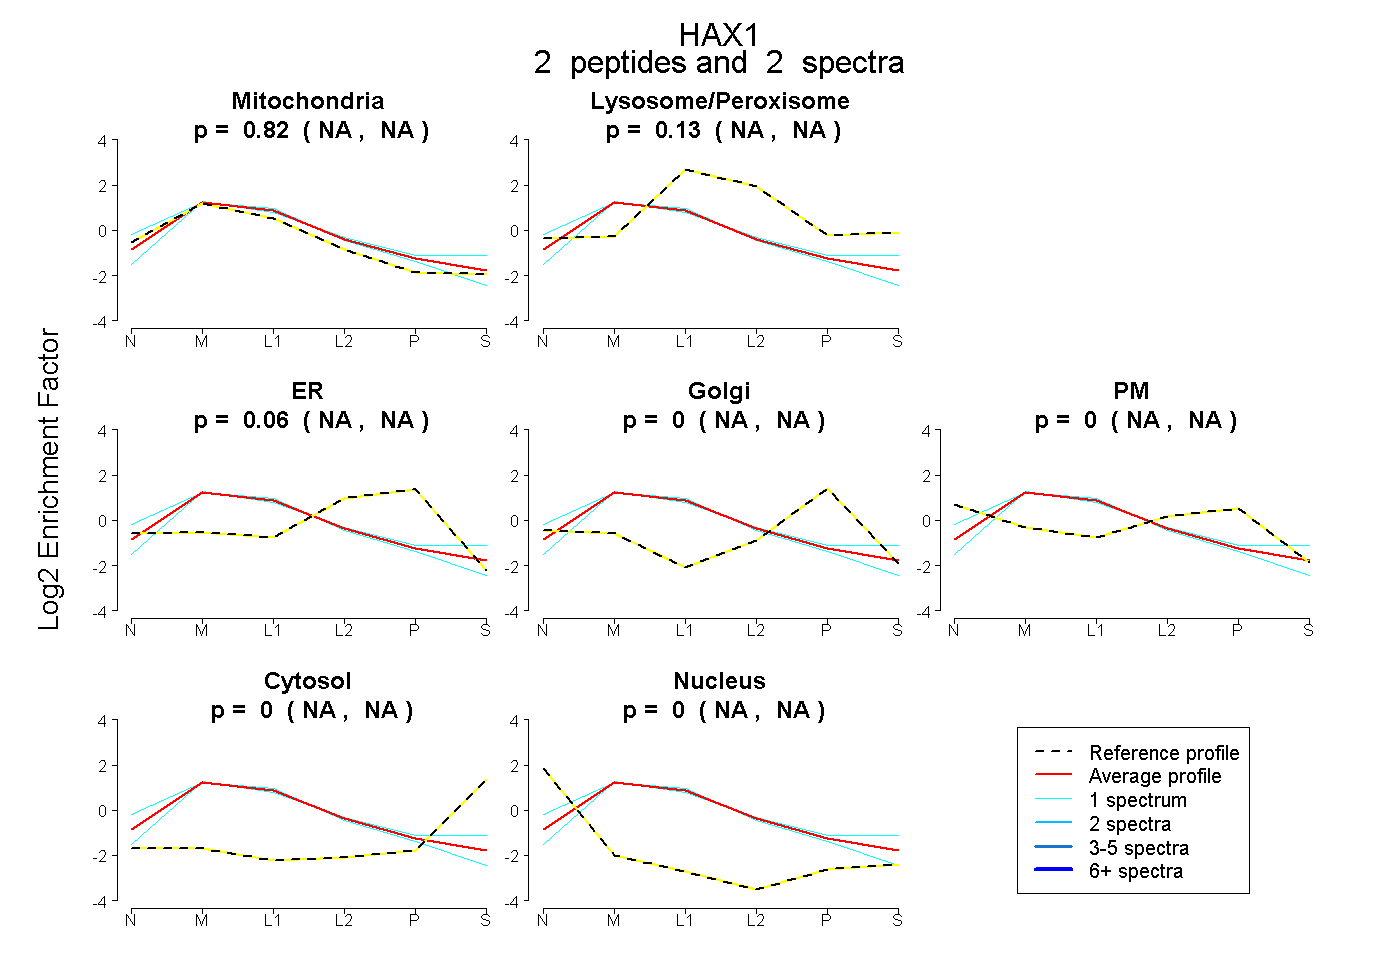
NA | NA
NA | NA
NA | NA
NA | NA
NA | NA
NA | NA
NA | NA
4peptides
spectra
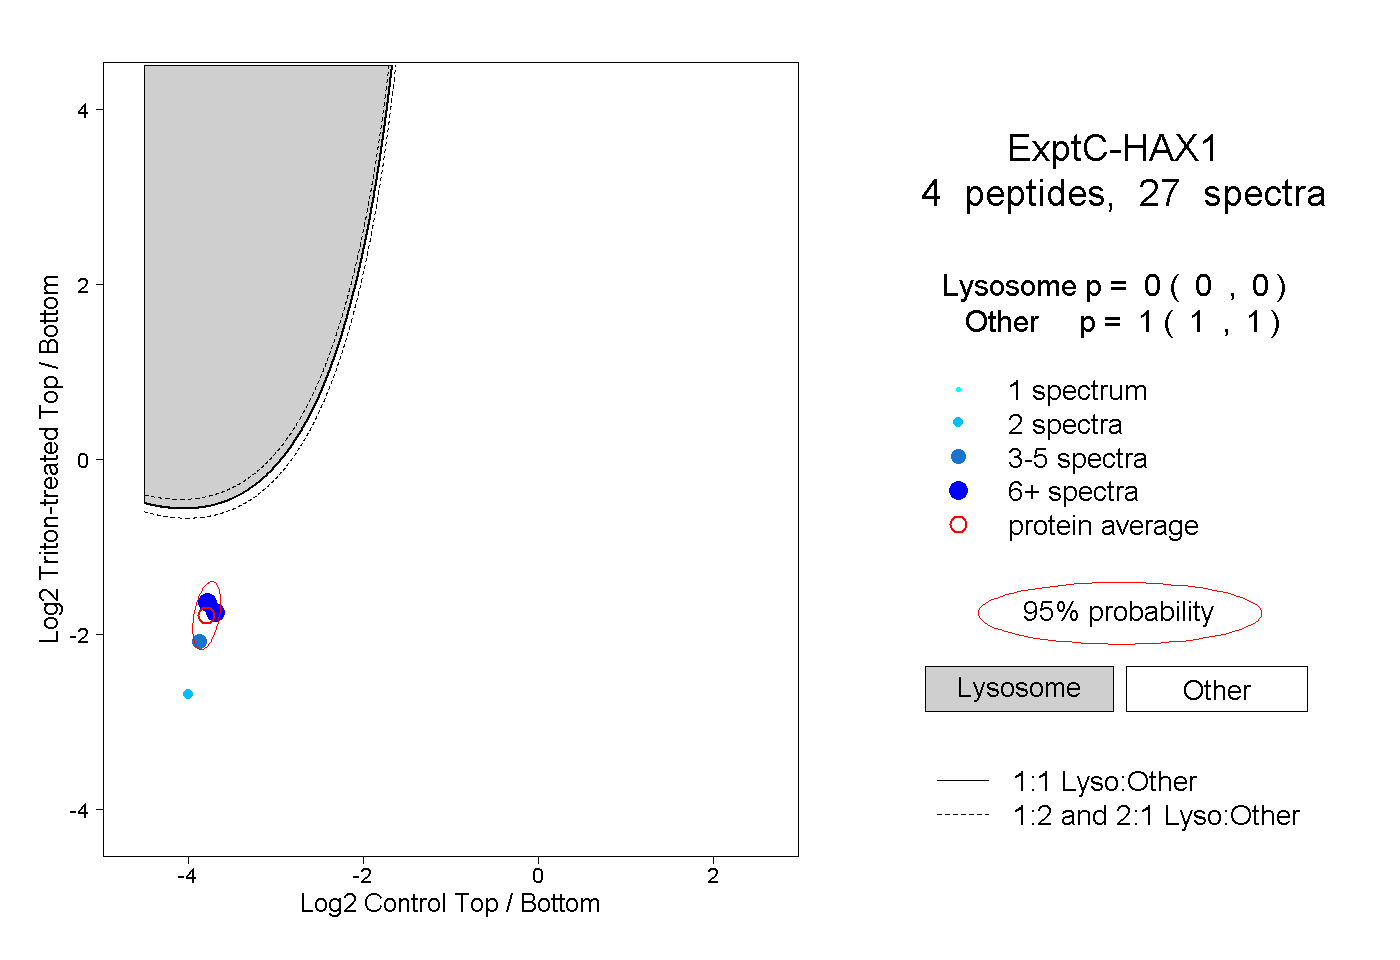
0.000 | 0.000
1.000 | 1.000
2peptides
spectra
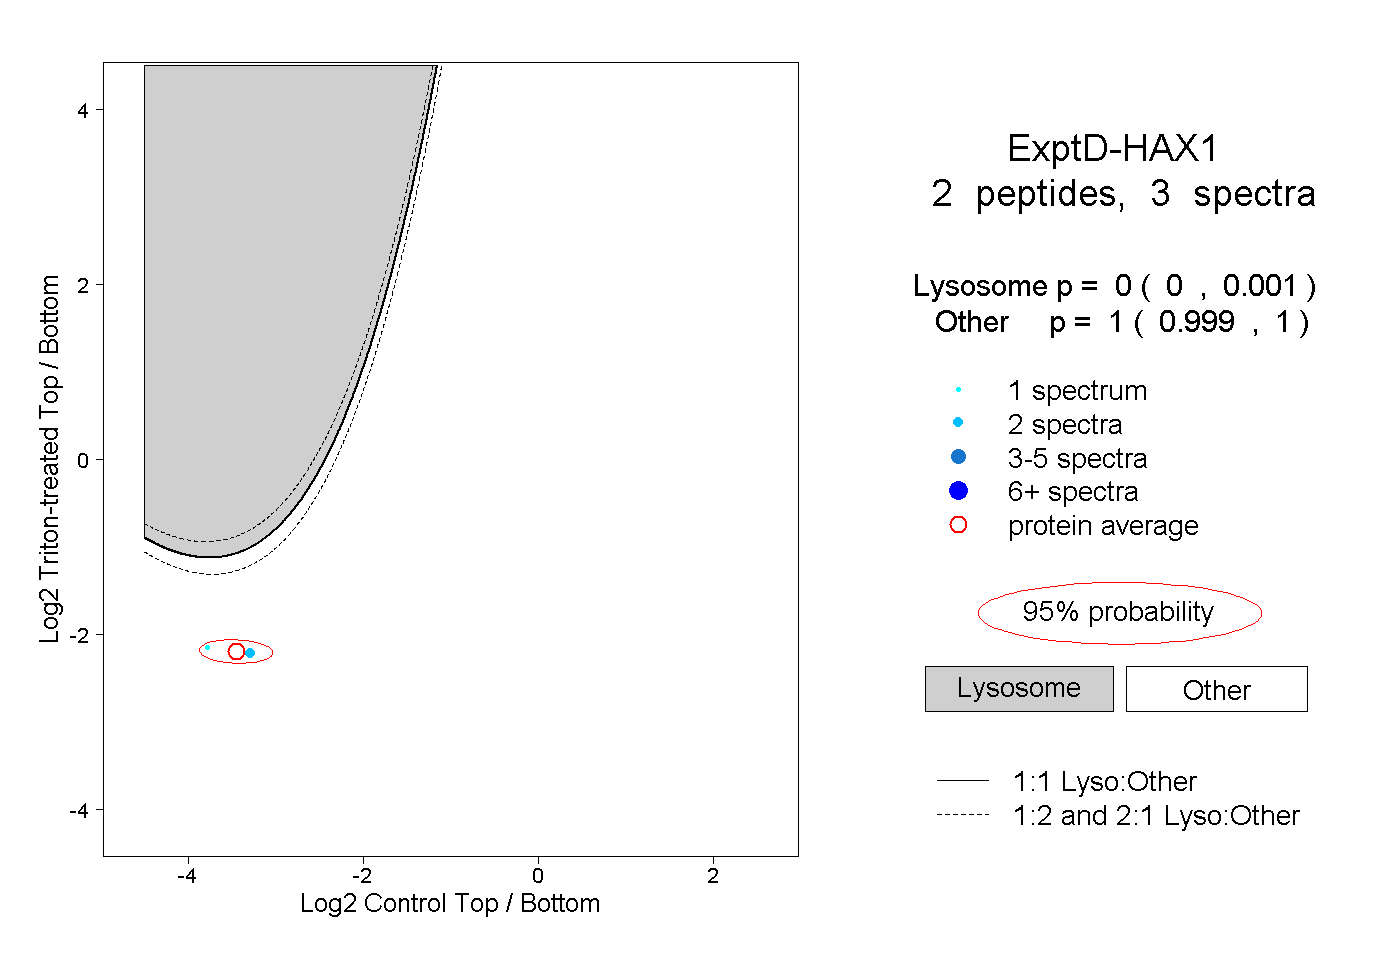
0.000 | 0.001
0.999 | 1.000